
The ring nematode, Mesocriconema xenoplax, is an economically important parasite of woody perennial fruit crops including Vitis spp. wine-grape (Pinkerton et al., 2004) and Prunus spp., such as peach and plum (Ferris et al., 2004; Cao et al., 2006). Most wine-grape and tree-fruit production in western North America occurs in semi-arid regions with nutrient-poor soils and is dependent on irrigation and supplemental nitrogen (N) inputs for optimal productivity. For reasons of optimizing fruit quality and minimizing environmental impacts, new and generally more conservative N fertilization (Hannam et al., 2013) and irrigation practices (Bowen et al., 2012; Hannam et al., 2013) are increasingly being evaluated and adopted by growers. Little is known, however, of the non-target and possibly longer-term influences of such changes in N inputs and irrigation practices on the development of pest and pathogen populations, particularly for plant-parasitic nematodes such as M. xenoplax.
As herbivores, the fecundity of plant-parasitic nematodes is likely to be positively influenced by the N status of their hosts (Mattson, 1980), but relationships between fertilization of woody perennial crops and the population dynamics of M. xenoplax have never been studied directly. Previous research suggests that M. xenoplax population growth is favored by moist soil conditions and therefore also likely to be influenced by irrigation practices. For example, Howland et al. (2014) reported that M. xenoplax population densities were spatially aggregated under drip emitters in a Washington vineyard. In three Spanish vineyards, population peaks of M. xenoplax population densities coincided with periods of high precipitation within a year (Pinochet and Cisneros, 1986). Similarly, changes in M. xenoplax population densities in a South Carolina peach orchard were more closely related to soil moisture than to temperature (Nesmith et al., 1981).
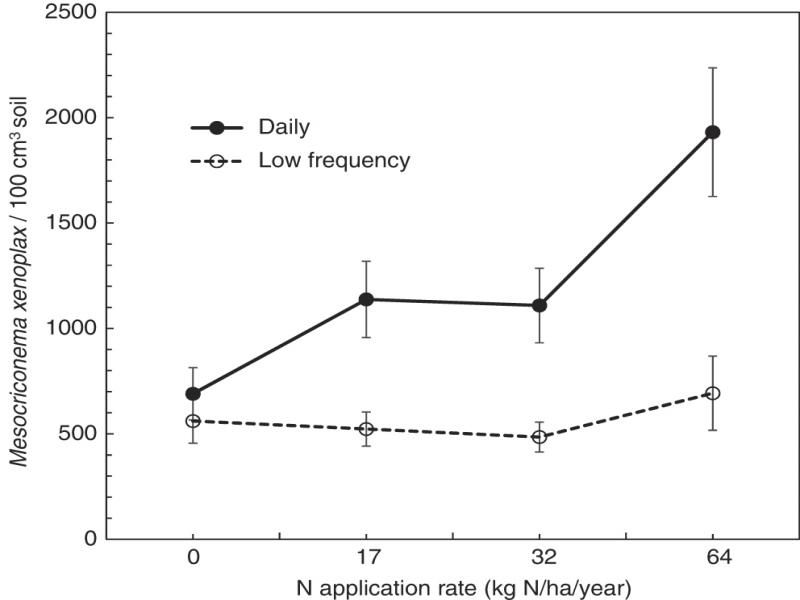
Because M. xenoplax has the potential to cause significant damage to perennial fruit crops at high population densities (Ferris et al., 2004; Pinkerton et al., 2004; Cao et al., 2006), it is important to determine how variation in N fertilization and irrigation practices affect its population dynamics. A field experiment designed to examine the effects of N fertilizer application rate and irrigation frequency on productivity and fruit quality of wine-grapes was established in the Okanagan Valley of British Columbia in 2006 (Hannam et al., 2013). Subsequently, the site was found to be infested with M. xenoplax. The objective of this research was to determine the interactive effects of N fertilizer application rates and drip irrigation frequency on population densities of M. xenoplax in the root zone of wine-grape in the semi-arid Okanagan Valley of British Columbia.
Materials and methods
Experimental design
The field experiment was initiated in 2006 in a three year-old experimental vineyard at the Summerland Research and Development Centre (SRDC), located in the Okanagan Valley, near Summerland, British Columbia (49° 34′N, 119° 39′W). The soil was an Osoyoos loamy sand (Wittneben, 1986) with 90% sand, 9% silt and 1% clay. The vines were variety Merlot (Vitis vinifera L.) grafted onto S0-4 rootstock (Vitis berlandieri × V. riparia), and planted at 1.2 m inter-vine spacing, and 3 m inter-row spacing. A 1 m herbicide strip was maintained on both sides of the vine rows, and disease and insect control measures followed standard industry practices (BC Tree Fruit Production Guide; www.bctfpg.ca; accessed November 9, 2018).
The experimental design was described previously (Hannam et al., 2013). Briefly, the planting was divided into six blocks, each of which was a section of row consisting of two irrigation whole-plots encompassing 20 vines each. The irrigation system was set up as two parallel systems with two separate lines running down each vine row, with each line used to irrigate one of the two irrigation whole-plots via two 4 L h-1 drip emitters per vine, located approximately 0.3 m to each side of every vine within the irrigation whole-plot. The two irrigation treatments randomly applied to the two whole-plots in each block were: daily irrigation, in which 100% of the previous day’s losses to evapotranspiration (ET) were replaced each day; and reduced frequency irrigation, in which irrigation was withheld for at least three days and water losses to evapotranspiration were only replaced when a minimum of three hours of irrigation were required. Irrigation treatments were initiated between two and four weeks pre-bloom and were maintained until harvest each year. The intention of the treatments was to alter irrigation frequency while applying the same total amount of water in the two treatments (100% ET). However, the actual quantity of water applied to the reduced irrigation frequency treatment plots was 87 to 93% of that applied to the daily irrigation treatments each year (Hannam et al., 2013). An equipment failure resulted in the low frequency treatment receiving only 61% of the water applied to the daily irrigation treatment plots in July 2010.
Evapotranspiration was measured using an electronic atmometer (ETGage Co, Loveland, CO) linked to irrigation valves via a CR10X datalogger (Campbell Scientific, Logan, UT), and a seasonal crop coefficient curve for grape was used to convert atmometer readings to an estimate of vineyard ET as described in Hannam et al. (2013). Soil moisture was monitored periodically over three weeks in August of each year, 2007 through 2010 (no data were collected in 2011 due to equipment failure). Soil moisture was measured using time domain reflectometry (TDR – Trase TDR, Soilmoisture Corp., Santa Barbara, CA). TDR probes were 20 cm in length and were placed within the vine row, approximately 0.15 m from a vine, in six daily irrigation plots and six reduced frequency irrigation plots. Summary data for the four years of soil moisture monitoring (2007 to 2010) were used to compare overall differences between the two irrigation frequency treatments (Table 1).
Table 1.
Effects of nitrogen (N, as urea) input and irrigation frequency on grapevine petiole N concentrations (% dry weight) determined at full bloom.
| Irrigation frequency | ||
|---|---|---|
| Fertilizer N input | Daily (% N) | Low frequency (% N) |
| 0 kg N ha−1 year−1 | 0.91 (0.02) | 0.89 (0.02) |
| 16.6 kg N ha−1 year−1 | 0.91 (0.02) | 0.94 (0.04) |
| 33.2 kg N ha−1 year−1 | 1.01 (0.05) | 0.94 (0.04) |
| 66.4 kg N ha−1 year−1 | 1.12 (0.06) | 1.11 (0.06) |
| ANOVA table | Pr > F | |
| Irrigation frequency | 0.63 | |
| N fertilization | < 0.0001 | |
| Irrigation × N fert | 0.61 | |
| Irrigation frequency | ||
|---|---|---|
| Soil moisture | Daily | Low frequency |
| Mean (cm3/cm3) | 14.25 (0.62) | 11.39 (0.76) |
| CVa | 0.11 | 0.16 |
| Maximum (cm3/cm3) | 17.81 | 16.30 |
| Minimum (cm3/cm3) | 11.37 | 8.03 |