
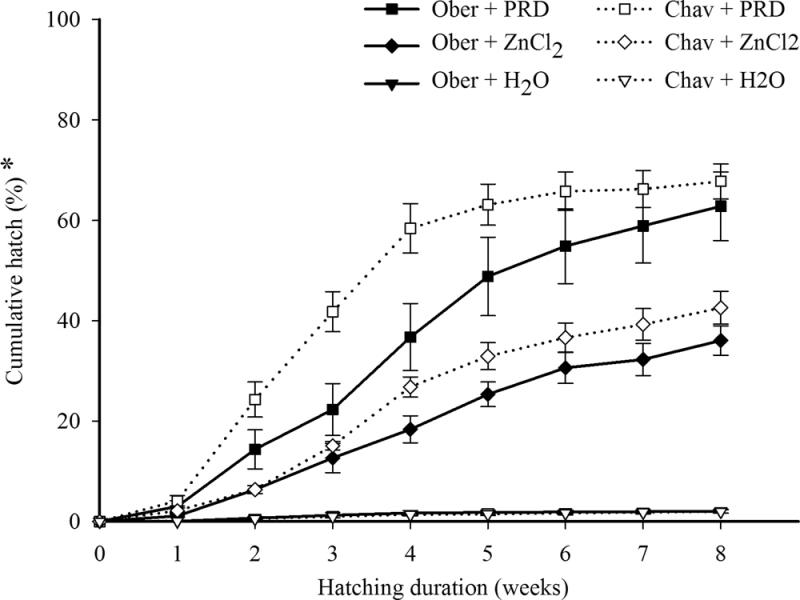
Figure 1:
Cumulative percentage hatch of Globodera pallida Oberlangen (Ober) and Chavornay (Chav) in potato root diffusate (PRD), Zinc Chloride (ZnCl2), and water (H2O) over a period of eight weeks. The error bars represent the standard error of the mean.
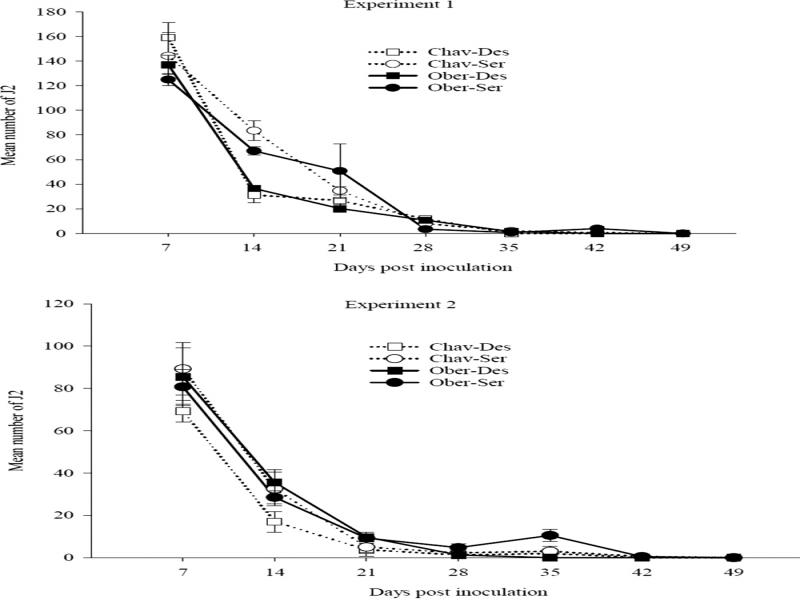
Figure 2:
Number of second-stage juveniles (J2s) of Globodera pallida Oberlangen (Ober) and Chavornay (Chav) in the roots of the susceptible cv. ‘Desiree’ (Des) and resistant cv. ‘Seresta’ (Ser) potato cultivars 49 days after inoculation. Four plants (n = 4) of each nematode-cultivar combination were sampled and J2s enumerated at different days post inoculation in experiments 1 and 2. The vertical bars represent the standard error of the mean.
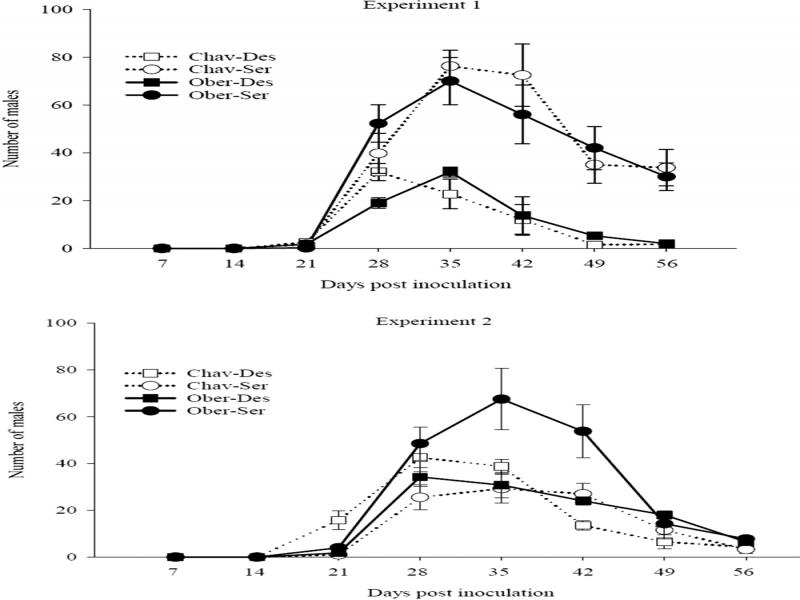
Figure 3:
Numbers of male nematodes of Globodera pallida Oberlangen (Ober) and Chavornay (Chav) in the roots and soils of the susceptible cv. ‘Desiree’ (Des) and the resistant cv. ‘Seresta’ (Ser) potato cultivars 56 days after inoculation. Four plants (n = 4) in each treatment were sampled and the males enumerated at different days post inoculation in experiments 1 and 2. The vertical bars represent the standard error of the mean.
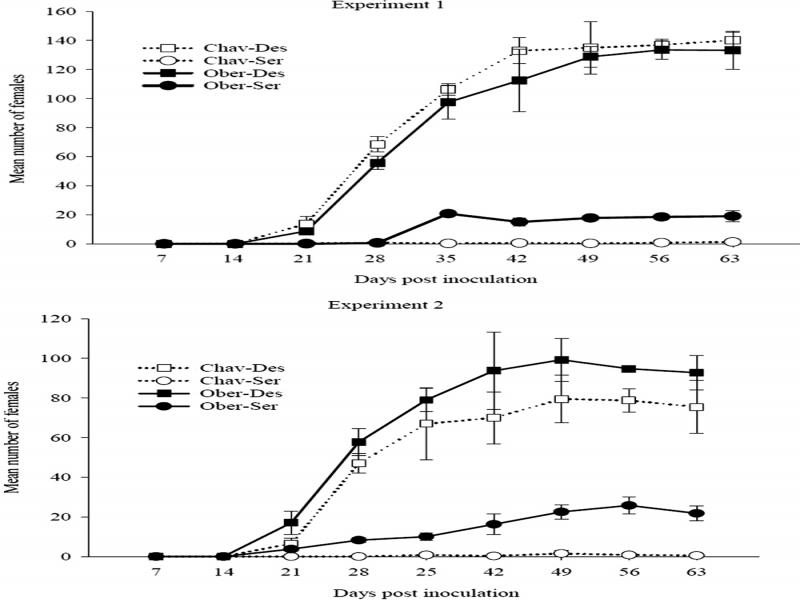
Figure 4:
Numbers of females of Globodera pallida Oberlangen (Ober) and Chavornay (Chav) on the roots of the susceptible cv. ‘Desiree’ (Des) and the resistant cv. ‘Seresta’ (Ser) potato cultivars. Four plants (n = 4) in each treatment were sampled and females enumerated at different days post inoculation in experiments 1 and 2. The vertical bars represent the standard error of the mean.
Table 1.
Effect of selected potato cultivars on the number of cysts per pot and percentage relative susceptibility (Rs) 12 weeks after inoculation with 5 eggs and second-stage juveniles of Globodera pallida populations Oberlangen and Chavornay per ml soil.
| Oberlangen | Chavornay | ||||
|---|---|---|---|---|---|
| Cultivars | No. cystsa | Rs | No. cystsa | Rs | Ratiob |
| ‘Desiree’ | 1,298.5 ± 111.3 a | 100 | 1,158.6 ± 51.6 a | 100 | 1.1 |
| ‘Albatros’ | 896.3 ± 39.3 b | 69.0 | 732.6 ± 77.6 b | 63.2 | 1.2 |
| ‘Laura’ | 822.4 ± 70.9 b | 63.3 | 617.8 ± 65.3 b | 53.3 | 1.3 |
| ‘Belana’ | 590.3 ± 60.1 c | 45.5 | 452.5 ± 32.8 e | 39.1 | 1.3 |
| ‘Amado’ | 382.1 ± 22.7 d | 29.4 | 39.3 ± 4.8 d | 3.4 | 9.7 |
| ‘Ribera’ | 308.3 ± 25.3 e | 23.7 | 176.3 ± 16.8 f | 15.2 | 1.8 |
| ‘Euroviva’ | 277.3 ± 17.8 ef | 21.4 | 16.1 ± 2.7 fg | 1.4 | 17.2 |
| ‘Eurotonda’ | 238.6 ± 20.8 f | 18.4 | 11.9 ± 2.7 fh | 1.0 | 20.1 |
| ‘Seresta’ | 137.6 ± 15.4 g | 10.6 | 6.6 ± 1.8 gh | 0.6 | 20.8 |
| ‘Amanda’ | 89.3 ± 10.0 g | 6.9 | 4.9 ± 1.2 h | 0.4 | 18.3 |
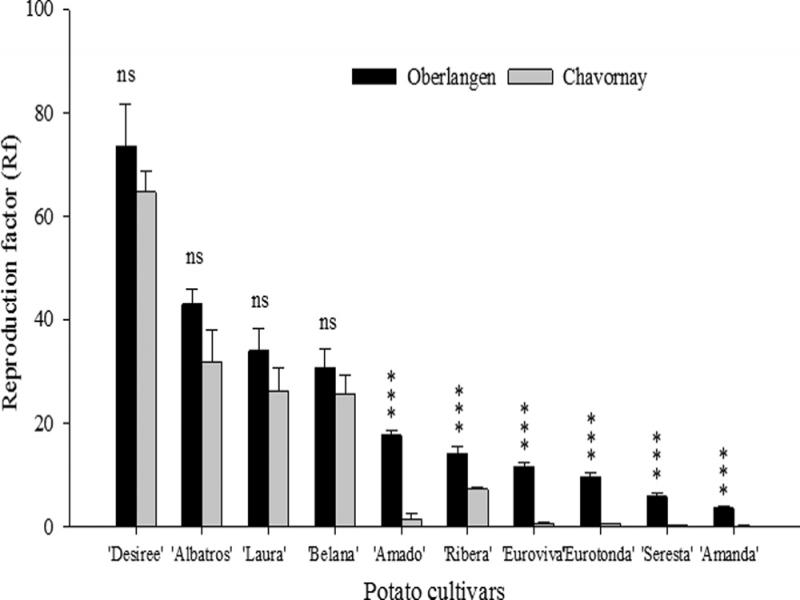
Figure 5:
Mean reproduction factor ± standard error of Globodera pallida Oberlangen and Chavornay on 10 potato cultivars with different levels of resistance (n = 10). The standard error bars with ns were not significantly different at P ≤ 0.05).
Table 2.
Life history traits of Globodera pallida Oberlangen and Chavornay reproduced on susceptible potato cultivar ‘Desiree’ and resistant cultivar ‘Seresta’.
| Treatment | Cyst size (µm)a | Eggs/cystb | J2 Size (µm) | Male size (mm) |
|---|---|---|---|---|
| Chavornay-‘Desiree’ | 547.6 ± 5.6 ac | 355.9 ± 20.9 a | 472.9 ± 4.3 | 1.18 ± 19.6 ab |
| Oberlangen-‘Desiree’ | 535.8 ± 4.9 ab | 339.1 ± 11.6 ab | 466.8 ± 2.9 | 1.23 ± 16.8 a |
| Oberlangen-‘Seresta’ | 518.4 ± 5.6 b | 284.5 ± 18.3 b | 463.8 ± 3.9 | 1.21 ± 15.6 a |
| Chavornay-‘Seresta’ | nd | nd | nd | 1.14 ± 14.3 b |
| P-value | P < 0.05 | P < 0.05 | P < 0.05 | P < 0.05 |
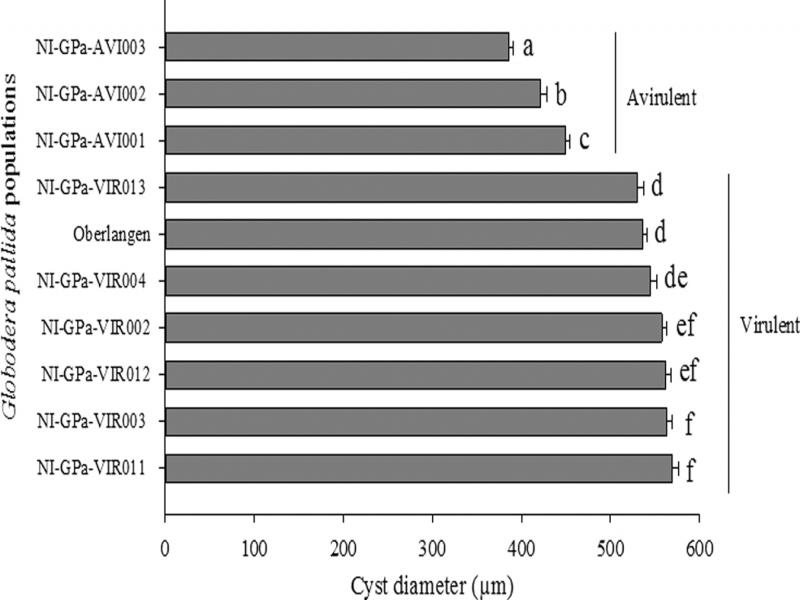
Figure 6:
Means cyst diameter ± standard error of avirulent and virulent populations of Globodera pallida (n = 150). Standard error bars with a common letter are not significantly different at P ≤ 0.05.