
Table 1.
Morphometric measurements of Cryphodera gayae n. sp.
| Paratype | ||||
|---|---|---|---|---|
| Stage | Character | Holotype | Range (min.–max.) | Mean ± SD |
| Female | ||||
| n | 10 | |||
| L (including neck) | 462.7 | 363.1–544.6 | 471.5 ± 53.8 | |
| L (excluding neck) | 380.3 | 430.6–255.5 | 367.8 ± 51.4 | |
| W (width) | 286.5 | 166.6–329.1 | 259.3 ± 46.2 | |
| Neck | 82.5 | 77.2–164.8 | 103.6 ± 26.9 | |
| L (inc. neck)/W ratio | 1.6 | 1.6–2.2 | 1.8 ± 0.2 | |
| Stylet length | 30.7 | 28.2–31.9 | 30.1 ± 1.0 | |
| Anterior end to median bulb | 65.0 | 53.9–93.7 | 70.3 ± 14.7 | |
| Length of medium bulb | 28.3 | 22.6–31.9 | 25.9 ± 2.9 | |
| Width of medium bulb | 25.2 | 20.6–29.9 | 24.3 ± 3.2 | |
| Vulva-nus distance | 46.9 | 35.8–51.6 | 44.7 ± 4.3 | |
| Vulval slit length | – | 51.9–54.1 | 52.6 ± 1.3 | |
| Excretory pore from anterior end | 80.1 | 72.6–124.5 | 92.4 ± 17.5 | |
| Second stage (J2) | ||||
| n | 20 | |||
| L (body length) | 469.1 | 424.2–525.9 | 482.8 ± 28.5 | |
| a (L/body diam.) | 22.7 | 18.5–22.7 | 20.1 ± 1.4 | |
| b (L/esophago-intestinal valve) | 3.9 | 3.4–4.4 | 3.9 ± 0.3 | |
| b′ (L/end of esophageal) | 2.7 | 2.2–3.0 | 2.7 ± 0.2 | |
| c (L/tail length) | 7.2 | 6.2–7.4 | 7.0 ± 0.3 | |
| c′ (tail length/tail diam.) | 4.4 | 3.3–5.0 | 4.2 ± 0.4 | |
| Stylet length | 29.8 | 26.8–31.3 | 29.3 ± 1.2 | |
| Tail length | 64.8 | 59.6–76.7 | 69.4 ± 4.4 | |
| Max. body diam. | 20.6 | 20.3–28.3 | 24.1 ± 2.5 | |
| Hyaline length | 39.0 | 31.7–47.8 | 38.4 ± 3.9 | |
| Excretory pore from anterior end | 111.93 | 101.43–132.66 | 118.6 ± 8.9 | |
| Egg | ||||
| n | 10 | |||
| L | 92.8–144.2 | 114.1 ± 15.1 | ||
| W | 31.4–39.7 | 36.1 ± 2.8 | ||
| L/W ratio | 2.9–3.9 | 3.2 ± 0.3 | ||
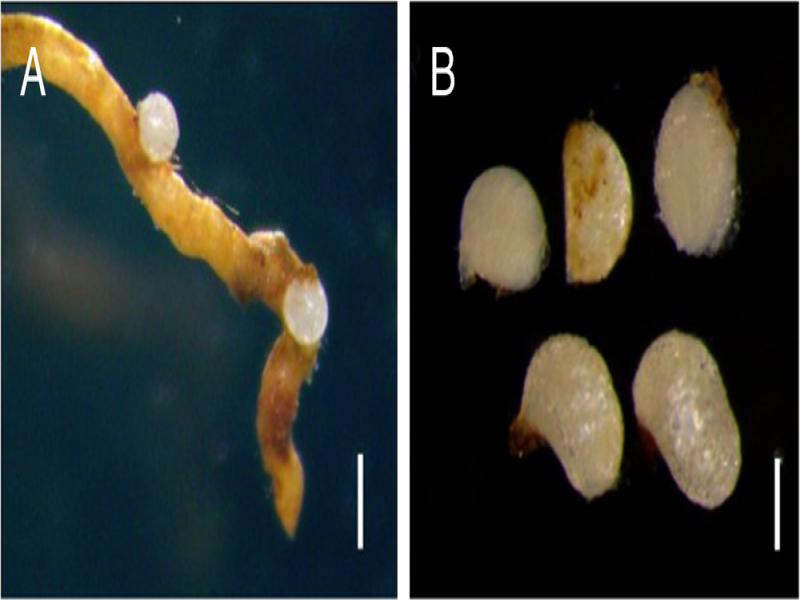
Figure 1:
Stereo microscopic photos of Cryphodera gayae n. sp. A: females attached on crapemyrtle (Lagerstroemia indica) root; B: females (scale bars: A = 500 µm, B = 200 µm).
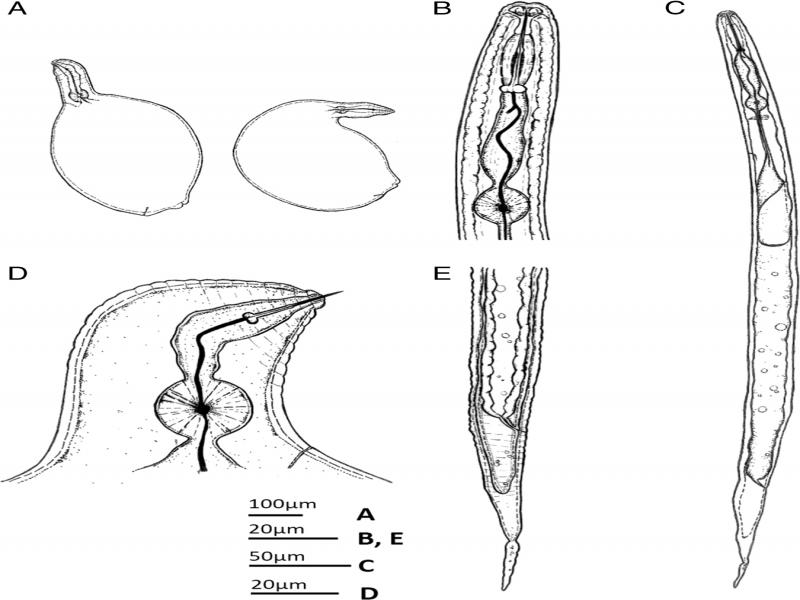
Figure 2:
Drawings of Cryphodera gayae n. sp. A: female; B: anterior region of J2; C: entire of J2; D: anterior region of female; E: tail region of J2.
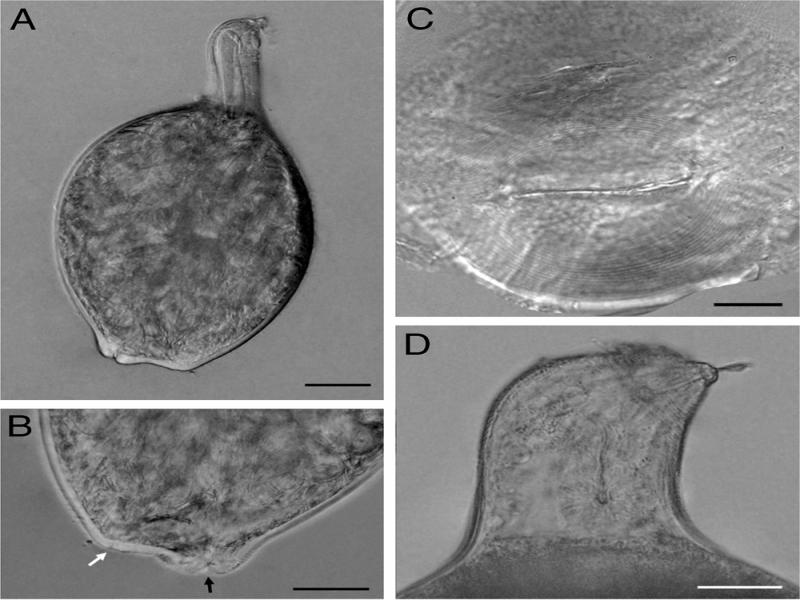
Figure 3:
Light microscope photos of female of Cryphodera gayae n. sp. A: entire of body; B: vulva-anus region (white arrow = anus; black arrow = vulva); C: perineal pattern; E: anterior region (scale bars: A = 50 µm, B–D = 20 µm).
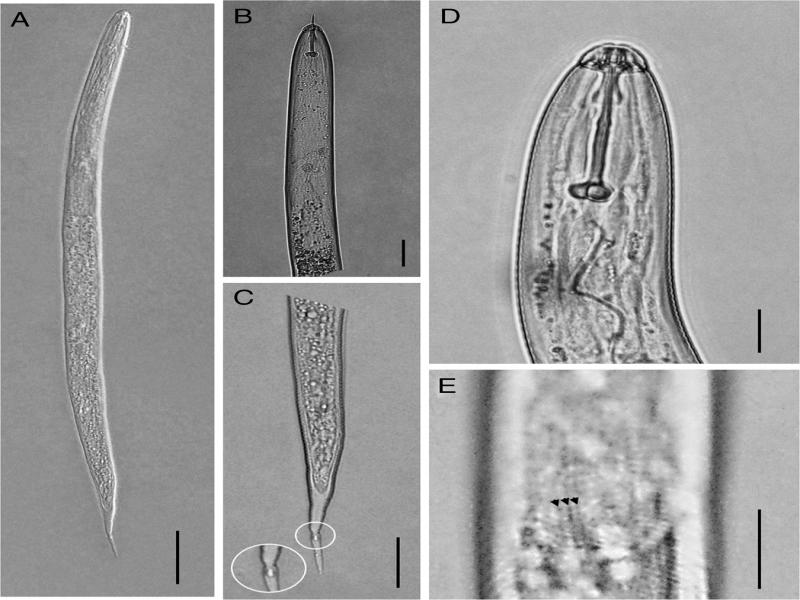
Figure 4:
Light microscope photos of second-stage juvenile (J2) of Cryphodera gayae n. sp. A: entire body of second-stage juvenile (J2); B: anterior region of J2; C: tail region of J2. Note (inset) the middle of hyaline in tail with a constriction; D: head of J2; E: Lateral lines (arrowed) (scale bars: A = 50 µm, B = 20 µm, C = 20 µm, D = 10 µm, E = 10 µm).
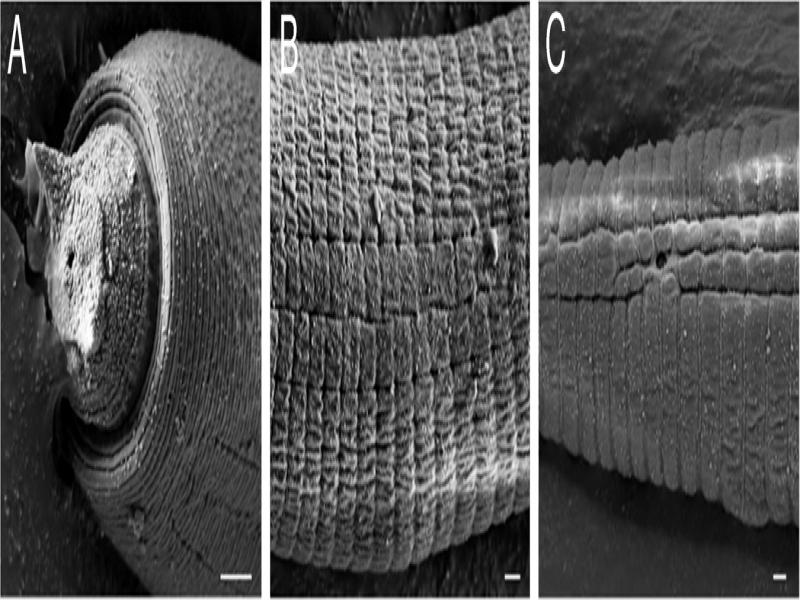
Figure 5:
SEM photos of second-stage juvenile (J2) of Cryphodera gayae n. sp. A: cephalic region; B: lateral field; C: phasmid (scale bars: A = 2 µm, B, C = 1 µm).
Table 2.
Comparative morphometrics (in µm) of female in species of Cryphodera with ranges in brackets.
| C. gayae n. sp. | C. sinensis | C. eucalypti | C. kalesari | C. brinkmani | C. podocarpi | C. nothophagi | C. coxi | ||
|---|---|---|---|---|---|---|---|---|---|
| Present study | Zhuo et al. (2014) | Colbran (1966) | Wouts (1973) | Bajaj et al. (1989) | Karssen and Van Aelst (1999) | Wouts (1973) | Wouts (1973) | Wouts (1973) | |
| Body length (L) | 471.5 ± 53.8 (363.1–544.6) | 460.9 ± 53.1 (362.9–526.8) | 400–636 | 353 (286–428) | 311 ± 21 (272–353) | 450 ± 52 (384–544) | 393 (300–473) | 341 (261–423) | 331 (218–455) |
| Body diameter | 259.3 ± 46.2 (166.6–329.1) | 240.1 ± 51.6 (172.4–314.0) | 201–274 | 210 (147–290) | 205.5 ± 51 (112–288) | 238 ± 35 (160–339) | 276 (217–335) | 226 (148–305) | 184 (116–369) |
| Number of lip annulus | – | – | – | 1 | 2–3 | – | 2 | 2 more or less | 2 more or less |
| Vulval slit length | 52.6 ± 1.3 (51.9–54.1) | 51.3 ± 6.8 (42.8–58.3) | 45 (44–49) | – | 35 | 51 ± 3.8 (44–60) | – | – | – |
| Anus-vulva profile | Flat to concave | Distinctly concave | Flat to concave | Concave | Distinctly concave | Flat to concave | Flat | Flat | Flat |
1 Data referred to Colbran (1966), Wouts (1973), Bajaj et al. (1989), Karssen and Van Aelst (1999), Siddiqi (2000), Sturhan (2010), Zhuo et al. (2014). –, not available.
Table 3.
Comparative morphometrics (in µm) of second-stage juveniles (J2) in species of Cryphodera with ranges in brackets.
| C. gayae n. sp. | C. sinensis | C. eucalypti | C. kalesari | C. brinkmani | C. podocarpi | C. nothophagi | C. coxi | ||
|---|---|---|---|---|---|---|---|---|---|
| Present study | Zhuo et al. (2014) | Colbran (1966) | Wouts (1973) | Bajaj et al. (1989) | Karssen and Van Aelst (1999) | Wouts (1973) | Wouts (1973) | Wouts (1973) | |
| Body length (L) | 482.8 ± 28.5 (424.2–525.9) | 435.2 ± 25.4 (388.8–474.5) | 379–461 | 428 ± 6 | 383 ± 19 (353–424) | 393 ± 23 (450–541) | 525 ± 5 | 450 ± 4 | 457 ± 4 |
| a = L/max. width | 20.1 ± 1.4 (18.5–22.7) | 22.6 ± 1.5 (19.4–25.9) | 22.0–26.0 | 24.8 ± 0.6 | 22 ± 1.5 (18–26) | 23.2 ± 1.3 (20.3–24.6) | 27.2 ± 0.5 | 24.5 ± 0.3 | 25.3 ± 0.4 |
| b = L/esophageal length | 3.9 ± 0.3 (3.4–4.4) | 3.9 ± 0.2 (3.7–4.4) | 3.5-4.8 | 3.7 ± 0.06 | 3.84 ± 0.38 (3.2–5.0) | – | 3.8 ± 0.06 | 3.7 ± 0.05 | 3.7 ± 0.04 |
| c = L/tail length | 7.0 ± 0.3 (6.2–7.4) | 7.8 ± 0.5 (6.4–8.6) | 7.9–9.8 | 8.3 ± 0.15 | 8.4 ± 1.2 (7–13) | 7.1 ± 0.4 (6.4–7.8) | 7.7 ± 0.07 | 8.2 ± 0.08 | 8.5 ± 0.08 |
| Number of lip annuli | 4 | 3 | 3 | 3 | 3 | 4 | 5 | 4 | 4 |
| Stylet length | 29.3 ± 1.2 (26.8–31.3) | 29.1 ± 0.8 (28.0–31.0) | – a | 32.9 ± 0.3 (31–35) | 26.5 ± 1 (24–29) | 33.3 ± 1.0 (31.6–35.4) | 38.7 ± 0.4 | 33.9 ± 0.2 | 34.4 ± 0.2 |
| Stylet knobs | Flat posteriorly | Project distinctly anteriorly | Concave | Flat or pointing slightly anteriorly | Flat to concave | Concave | Pointing distinctly anteriorly | Flat anteriorly | Pointing slightly anteriorly |
| DGO | 4.6 ± 0.9 (3.3–6.1) | 5.4 ± 0.7 (4.5–6.5) | 4.3–5.0 | 5.5 ± 0.17 | 3–4 | 5.8 ± 0.6 (4.4–7.0) | 6.0 ± 0.26 | 5.6 ± 0.17 | 6.1 ± 0.28 |
| Number of lateral line | 3 | 3 | 3 | 3 | 3 | 3 | 3 | 3 (occasionally 4)b | 3 |
| Tail length | 69.4 ± 4.4 (59.6–76.7) | 56.0 ± 3.2 (52.0–65.0) | – | 46.5 ± 6 (27–54) | 46.5 ± 6 (27–54) | 69.7 ± 4.4 (61.3–76.5) | 68.9 ± 0.1 | 55.3 ± 0.8 | 53.7 ± 0.8 |
| Hyaline portion of tail | 38.4 ± 3.9 (31.7–47.8) | 28.3 ± 2.3 (24.5–35.0) | – | 21.5 ± 2.5 (18–26) | 21.5 ± 2.5 (18–26) | 37.2 ± 3.6 (30.3–42.3) | 36.0 ± 0.1 | 30.1 ± 0.7 | 30.6 ± 0.5 |
| Tail terminus | Sharp point with constriction at the middle of hyaline | Point with mucro-like tip | Buntly rounded | Narrow rounded | Narrow rounded | Point with mucro-like tip | Narrow rounded | Narrow rounded | Narrow rounded |
1 DGO, distance of dorsal esophageal gland orifice to base of stylet; Data referred to Colbran (1966), Wouts (1973), Bajaj et al. (1989), Karssen and Van Aelst (1999), Siddiqi (2000), Sturhan (2010), Zhuo et al. (2014). –, not available; a Colbran (1966) reported stylet length for J2 of C. eucalypti was 26–35.9 mm. Wouts (1973) mentioned that the minimum 26 mm belonged to J2 of Heterodera. Bajaj et al. (1989) and Karssen and Van Aelst (1999) accepted the point of Wouts (1973). Thus, the value of C. eucalypti described by Colbran (1966) is omitted here; b Wouts (1973) described four incisures in the field of C. nothophagi J2. Sturhan (2010) re-examined paratype J2 of C. nothophagi, which revealed three incisures in the field, with the inner incisure occasionally diverging into two. Thus, the point of Sturhan (2010) is accepted here.
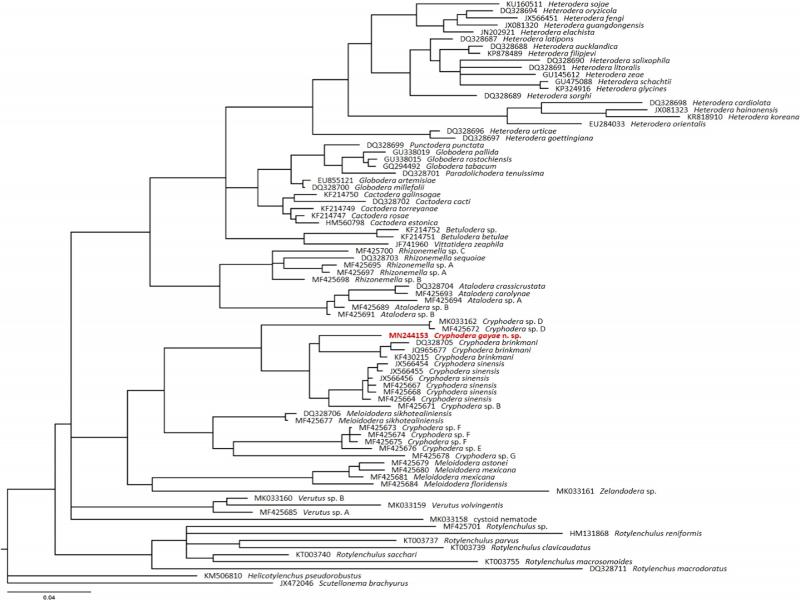
Figure 6:
Phylogenetic relationships within population and species of Heteroderidae. Bayesian 50% majority-rule consensus tree from two runs as inferred from the analysis of the D2–D3 of 28 S rDNA gene sequences under the GTR + I + G model (1nL = 15776.80; AIC = 31899.59; freqA = 0.2234; freqC = 0.2247; freqG = 0.2958; freqT = 0.2561; R(a) = 0.3202; R(b) = 2.082; R(c) = 1.008; R(d) = 0.2953; R(e) = 4.3966; R(f) = 1; Pinva = 0.3467; Shape = 0.7997). Posterior probability values more than 70% are given in appropriate clades. Newly sequenced sample is indicated by red color and bold font.
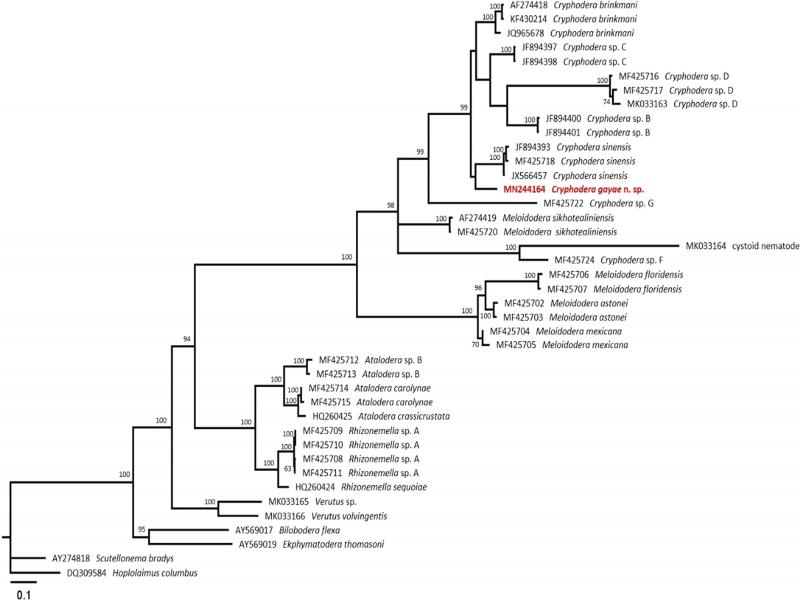
Figure 7:
Phylogenetic relationships within population and species of Heteroderidae. Bayesian 50% majority-rule consensus tree from two runs as inferred from the analysis of the ITS region gene sequences under the GTR + I + G model (1nL = 18933.04; AIC = 38056.30; freqA = 0.2111; freqC = 0.2291; freqG = 0.2717; freqT = 0.2881; R(a) = 1.1195; R(b) = 3.0260; R(c) = 1.5414; R(d) = 0.6272; R(e) = 3.0260; R(f) = 1; Pinva = 0.1554; Shape = 2.1166). Posterior probability values more than 70% are given in appropriate clades. Newly sequenced sample is indicated by red color and bold font.