
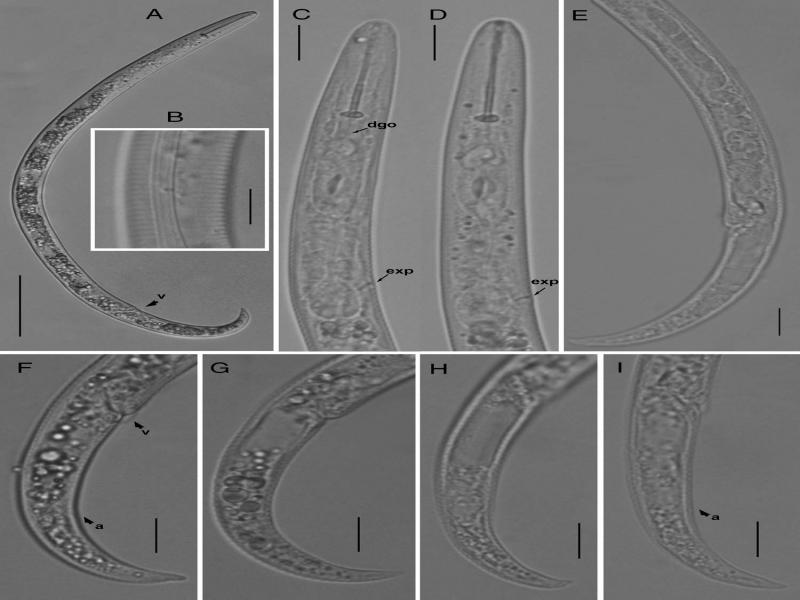
Figure 1:
Light photomicrographs of Paratylenchus lepidus (Raski, 1975a, b). (A) Entire female; (B) lateral lines; (C-D) pharyngeal regions, arrow pointing on the excretory pore (exp); (E) posterior region showing gonad; (F-I) tail regions, arrows pointing on vulva and anus (a) (Scale bars = A = 50 μm, B-I = 10 μm).
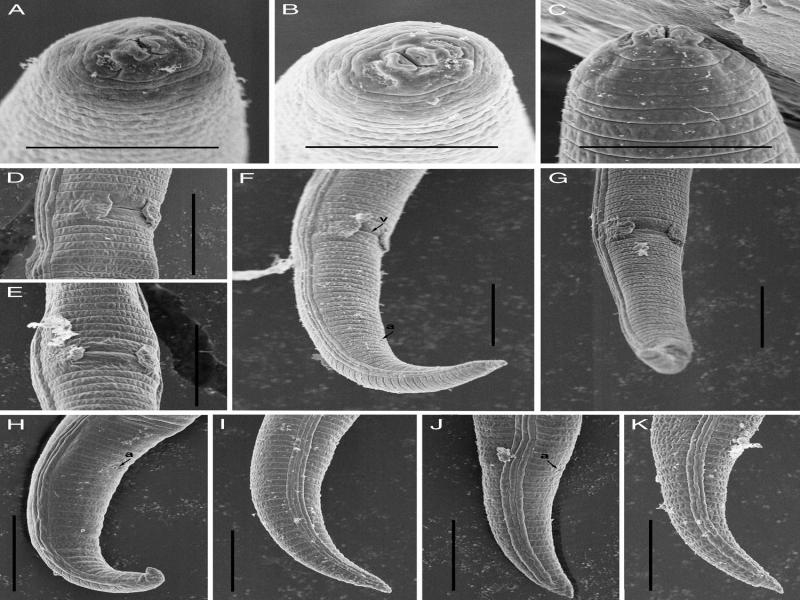
Figure 2:
Scanning electron microscopy of Paratylenchus lepidus (Raski, 1975a, 1975b). (A-C) Lip regions; (D, E) vulval regions; (F, G) posterior region arrows showing position of vulva; (H-K) female tails (Scale bars, A-C = 5 μm; D-K = 10 μm).
Table 1.
Morphometric data for Paratylenchus lepidus (Raski, 1975a, 1975b).
| Type | Additional type pop. | ||||
|---|---|---|---|---|---|
| This study | Raski (1975b) | Raski (1975b) | Chen et al. (2007) | Yu et al. (2014) | |
| Elaeocarpus sp. | Thea sinensis L. | Thea sinensis L. | a | Boehmeria nivea L. | |
| Characters/ratios | Taizhou | Sri Lanka | Sri Lanka | Taiwan | Hunan |
| n | 23 | 21 | 13 | 26 | |
| Body length | 324.2 ± 21.0 (288.4–359) | 330 (280–400) | 320 (290–370) | 270–400 | 260–420 |
| a | 27.4 ± 2.5 (22.2–31.6) | 25 (23–31) | 27 (23–31) | 19.4–31 | 13.1–23.1 |
| b | 4.0 ± 0.3 (3.5–4.4) | 4.0 (3.4–4.0) | 3.8 (3.5–4.6) | 3.2–4.6 | 3.3–5.1 |
| c | 10.4 ± 0.6 (9.2–11.6) | 14 (11–16) | – | 11–16 | 5.3–10.3 |
| c' | 3.8 ± 0.2 (3.3–4.3) | – | – | – | |
| V | 81.4 ± 0.9 (80.0–83.3) | 82 (80–84) | 82 (80–83) | 78.5–84 | 78–84 |
| Lip height | 3.1 ± 0.2 (2.6–3.4) | – | – | – | – |
| Lip width | 5.5 ± 0.3 (5.1–6.2) | – | – | – | – |
| Stylet | 27 ± 1.0 (24.8–28.7) | 25 (22–27) | 25 (23–28) | 21.3–27 | 13.7–27.9 |
| Stylet percentage | 8.3 ± 0.4 (7.6–9.2) | – | – | – | – |
| Median bulb Length | 18.0 ± 1.4 (15.2–19.9) | – | – | – | – |
| Median bulb width | 6.4 ± 0.5 (5.3–7.2) | – | – | – | – |
| SE pore | 71.4 ± 2.9 (65.2–76.4) | – | – | – | – |
| Pharynx | 80.2 ± 2.9 (73.7–85.4) | 75 (69–82) | 68 (66–75) | 58–85 | |
| Body width | 12.0 ± 1.0 (10.2–13.5) | – | – | – | – |
| Vulval body diam | 10.6 ± 0.8 (8.9–12.1) | – | – | – | – |
| Anal body diam | 8.3 ± 0.6 (7.3–9.4) | – | – | 8–15 | – |
| Distance from vulva to tail terminus | 60.3 ± 4.6 (51.7–69) | – | – | 79–84 | – |
| Tail length | 31.2 ± 2.3 (26.5–34.8) | – | – | – | – |
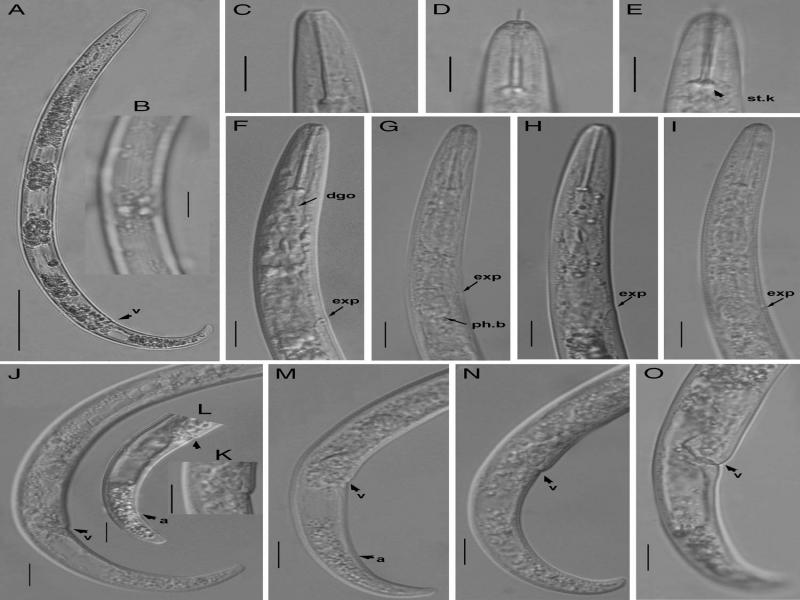
Figure 3:
Light photomicrographs of Paratylenchus minor (Sharma et al., 1986). (A) Entire female; (B) lateral lines; (C-D) lip region arrow pointing on the stylet basal knobs (st.k): (F-I) pharyngeal regions, arrow pointing on dorsal pharyngeal gland orifice (dgo), excretory pore (exp), hemizonid (h) and pharyngea basal bulb (ph.b); (J) posterior region showing gonad, arrow pointing on vulva (v); (K) vulval region; (L-O) tail regions, arrows pointing on vulva and anus (a). (Scale bars =A = 50 μm, B-O1 = 0 μm).
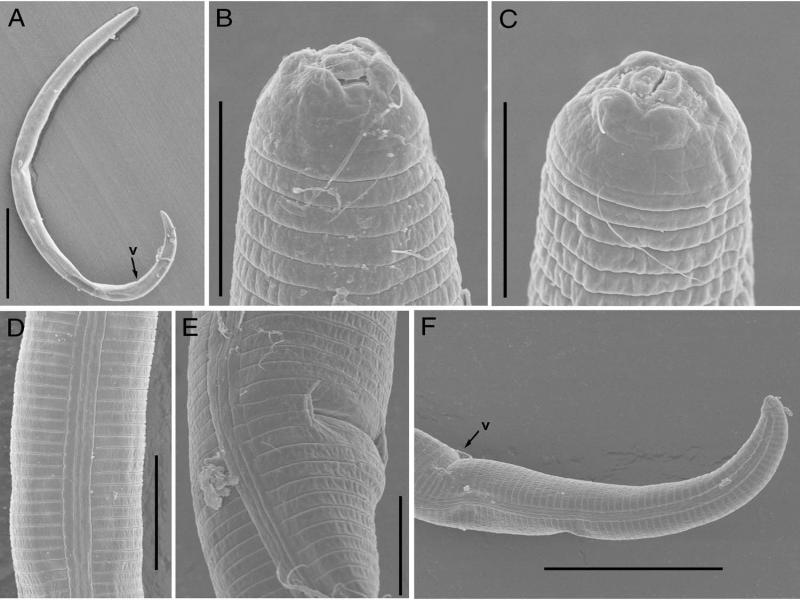
Figure 4:
Scanning electron microscopy of Paratylenchus minor (Sharma et al., 1986). (A) Entire female; (B, C) lip regions; (D) lateral lines; (E) vulval region; (F) posterior region, arrows showing position of vulva (Scale bars, A = 50 μm; B, C, E = 5 μm; D = 10 μm; F = 20 μm).
Table 2.
Morphometric data for Paratylenchus minor (Sharma et al., 1986).
| Characters/ratios | Zhejiang population | Type species |
|---|---|---|
| n | 23 | 10 |
| L | 314.0 ± 17.0 (284.4–352.0) | 260 (230–280) |
| a | 25.0 ± 1.8 (21.6–28.0) | 21 (18–24) |
| b | 4.3 ± 0.2 (3.8–4.7) | 3.8 (3.4–4.3) |
| c | 13.0 ± 2.2 (9.6–17.3) | 12.0 (10–16) |
| c' | 2.9 ± 0.3 (2.3–3.4) | – |
| V | 81.7 ± 0.9 (80.0–83.6) | 81 (73–84) |
| Lip height | 2.8 ± 0.3 (2.2–3.3) | – |
| Lip width | 5.6 ± 0.3 (5.1–6.3) | – |
| Stylet | 23.2 ± 0.9 (21.8–24.8) | 22 (20–24) |
| Stylet percentage | 7.4 ± 0.4 (6.6–7.9) | – |
| Median bulb length | 15.0 ± 1.1 (12.4–16.9) | – |
| Median bulb diam. | 6.6 ± 0.6 (5.7–8.0) | – |
| Ant. end to excretory pore | 66.7 ± 3.1 (61.7–72.5) | – |
| Pharynx | 73.0 ± 2.4 (68.6–77.3) | – |
| Max. body diam. | 12.6 ± 0.9 (10.6–14.3) | – |
| Vulval body diam | 11.0 ± 0.8 (8.4–12.1) | – |
| Anal body diam. | 8.7 ± 1.1 (7.0–11.3) | – |
| Vulva to tail term. | 57.5 ± 4.2 (51.0–65.3) | – |
| Tail length | 25.0 ± 3.9 (18.4–32.5) | – |
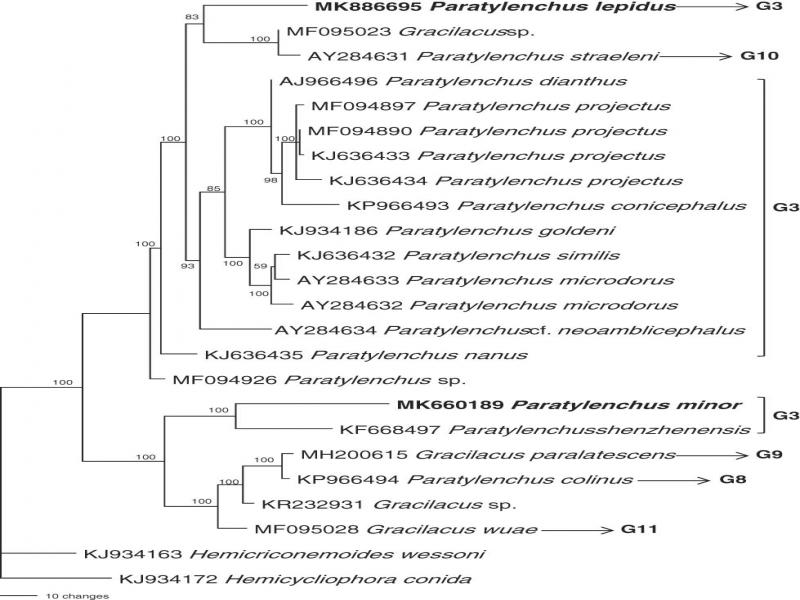
Figure 5:
Tree inferred from 18S under TrN+I+G model (-lnL=4424.0723; AIC=8862.1445; freqA = 0.2337; freqC=0.2276; freqG=0.2917; freqT=0.247; R(a)=1; R(b)=2.2828; R(c)=1; R(d)=1; R(e)=7.2373; R(f)=1; Pinva = 0.6811; Shape = 0.7399). Posterior probability values exceeding 50% are given on appropriate clades.
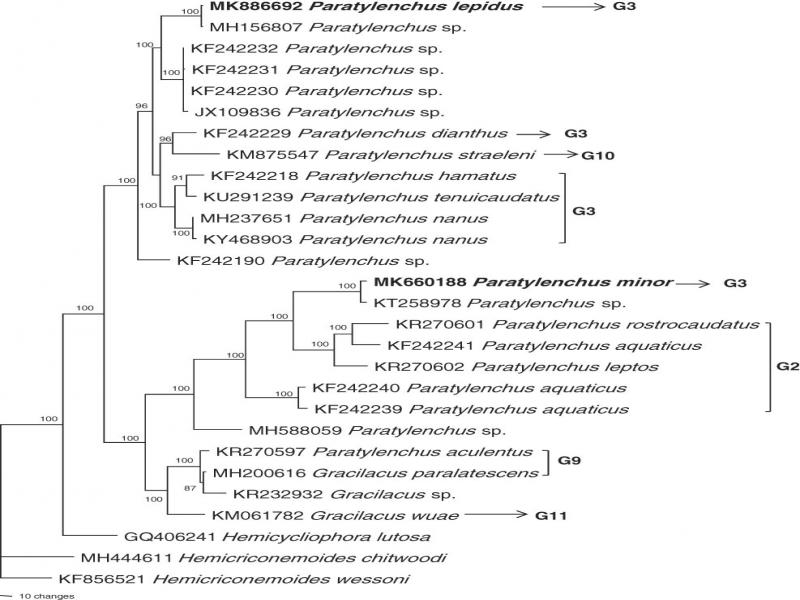
Figure 6:
Bayesian 10001st tree inferred from 28S under GTR+G model (-lnL=5406.0205; AIC=10830.041; freqA=0.2094; freqC=0.2149; freqG=0.3191; freqT=0.2565; R(a)=0.5351; R(b)=2.123; R(c)=0.9422; R(d)=0.4173; R(e)=4.3792; R(f)=1; Pinva = 0; Shape = 0.3021). Posterior probability values exceeding 50% are given on appropriate clades.
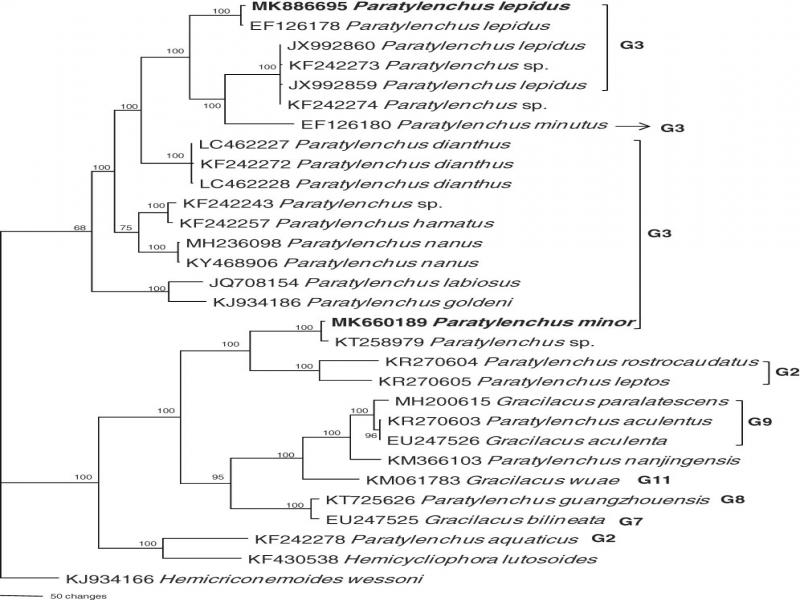
Figure 7:
Bayesian 10001st tree inferred from ITS under GTR+I+G model (-lnL=9973.9414; AIC=19967.8828; freqA=0.2117; freqC=0.2617; freqG=0.2691; freqT=0.2574; R(a)=1.3546; R(b)=2.6646; R(c)=1.6199; R(d)=0.7276; R(e)=3.229; R(f)=1; Pinva=0.3363; Shape=1.6939). Posterior probability values exceeding 50% are given on appropriate clades.