The impact of invasive plants on soil ecosystems in the last decades has attracted world-wide attention. Exotic plant invasions often have dramatic impacts on the resident vegetation by modifying its composition and structure (Levine et al., 2003). Invasive plants have been reported to alter abiotic properties (Rahmonov et al., 2014; Suseela et al. 2016; Stefanowicz et al., 2017), nutrient availability, organic carbon content (Bardon et al., 2014), soil microbiota (Scharfy et al., 2010; Coats and Rumpho, 2014), and soil mesofauna (Quist et al., 2014; Sterzyńska et al., 2017), with special references to variability and composition of arthropods (Moroń et al., 2009; Lenda et al., 2013; Baranová et al., 2014).
The clonal Japanese knotweed, Fallopia japonica (Houtt.) Ronse Decr., is considered to be one of the 100 worst invasive alien species in the world (Lowe et al., 2000). It was introduced into North America and Europe in the nineteenth century as an ornamental plant (Bailey and Conolly, 2000) and cattle fodder (Beerling et al., 1994). F. japonica produces a large amount of biomass and form monospecific stands that can have a major impact on ecosystem functions (Mincheva et al., 2014) and on soil biodiversity (Beerling et al., 1994; Muller, 2004). Most of the previous studies on F. japonica have focused on methods for their control and eradication (Kabat et al., 2006), effects on natural plants (Aguilera et al., 2010), changes in soil chemical properties (Dassonville et al., 2007), allelopathic effects in experimental conditions (Dommanget et al., 2014), or impact on invertebrate species richness (Beerling and Dawah, 1993; Gerber et al., 2008), but the responses of soil microbial or nematode communities on invasion by Fallopia spp. are largely understudied. Dassonville et al. (2010) found that Fallopia spp. decreased potential denitrification enzyme activity by reducing soil moisture, denitrifying bacteria density in the soil and potential ammonia and nitrite oxidizing bacteria enzyme activities. Fallopia spp. have also been shown to produce antimicrobial and antifungal substances (Kim et al., 2005; Kumaga et al., 2005) that could affect the soil bacterial community.
Soil nematodes are an important group of soil biota, constituting an essential trophic link between primary decomposers, such as soil microflora, and larger animals and are recognized as useful bioindicators of soil conditions (Ritz et al., 2009) due to their abundance, diversity, and trophic structure (Bongers, 1990; Yeates et al., 2009). Root tissues and soil microorganisms such as bacteria and fungi represent a primary energy sources for nematode communities, and the quantitative variation of these resources may affect the structural and trophic diversity of nematode communities (Biederman and Boutton, 2009; Ciobanu et al., 2015). Different ecosystems have specific compositions of soil microbial and nematode communities. Estimating the status of and related changes in the structures of microbes and soil nematode communities after the establishment of the invasive plant F. japonica must thus include the assessment of different habitats (Renčo and Baležentiené, 2011). For this case study, we chose three habitats (forest, grassland, and wetland) and adjacent territories invaded by F. japonica in a valley in Central Europe (Slovakia) to confirm or reverse the effect of F. japonica on selected food web components.
To our knowledge, this is the first study observing the impact of F. japonica on the soil microbial and nematode community structure. Our objectives were to (i) determine the impact of F. japonica on soil pH and moisture, soil microbial respiration, soil microbial biomass carbon content, enzymatic activities and (ii) compare the abundance, diversity, trophic structure of nematode communities and selected ecological indices in three different habitats in F. japonica, the invaded and the uninvaded plots. The hypothesis tested was that soil physical properties, microbial, and nematode communities change when the ecosystem is disrupted by the invasion.
Material and methods
Study area
The experiment was conducted in a valley near the village of Opátka in South Eastern Slovakia, Central Europe. This region has a temperate climate, with an annual average of 40 summer days per year and a warm, moderately dry sub-region with a mild winter. The average daily temperature in January ranges from 1.5 to 4.0°C, the average daily temperature in July ranges from 16.0 to 18.5°C, while the average annual temperature ranges from 5.0 to 7.0°C. The mean annual precipitation is 650 to 700 mm. The soils are characterized as Fluvisols, and the vegetation zone is characterized as Carpathian oak-hornbeam forest. The landscape is patchy, with deeply undulating uplands (Miklós, 2002). The first F. japonica specimens appeared in the village of Opátka around 1992 (personal communication with forester of the cadastre). It was later probably transferred to the entire valley (7 km) below the village, invaded the banks of the creek and then spread to adjacent habitats thus creating large monocultures.
For studying the impact of F. japonica on soil physical properties, microbial, and soil nematode communities, we selected three habitats in the valley, namely, forest, grassland, and wetland and corresponding areas adjacent to them invaded by F. japonica.
Forest (F) (48°47.63′N, 21°03.43′E; 455 m a.s.l.): covered by a natural, undisturbed, 100 years old deciduous Querco-Fagetea forest, mainly consisting of Quercus robur, Q. cerris, Carpinus betulus, Acer campestre, and many shrub species such as mostly Viburnum sp. and Prunus spinosa.
Forest edge invaded by F. japonica (FF): a nearly monospecific stand of F. japonica covering an area of 500 m2, with an estimated time of invasion of 15 years.
Grassland (G) (48°48.14′N, 21°03.40′E; 392 m a.s.l.): covered with indigenous multispecies vegetation dominated by Dactylis glomerata, Lolium perenne, Trifolium pratense, and Achillea millefolium; irregularly mown.
Grassland edge invaded by F. japonica (GF): an adjacent of F. japonica covering an area of 250 m2, with an estimated time of invasion of 15 years.
Wetland (W) (48°48.34′N, 21°03.35′E; 386 m a.s.l.): covered by Petasites hybridus, Caltha palustris, Galium aparine, Equisetum sp., Ranunculus sp., and Urtica sp.; the soil is regularly flooded mostly in the spring, and the vegetation is mown once a year in the autumn.
Wetland edge invaded by F. japonica (WF): an adjacent area of 200 m2, with an estimated time of invasion of 10 years, the soil is regularly flooded mostly in the spring.
We selected a 25 m × 25 m area of the three different habitats (F, G, and W) which was not yet colonized by F. japonica. The distance between F, G, and W along the valley was approximately 1,500 m. A pair of the invaded and the uninvaded areas which did not differ in elevation, inclination, exposition, or management were chosen and the distance between the invaded and the uninvaded areas was 50 m. In each invaded area, we installed five randomly chosen 1 × 1 m plots (approx. 10 m apart) which had similar cover of F. japonica. Similar, five 1 × 1 m plots with random distribution were installed in corresponding uninvaded F, G, and W areas. This resulted in 30 plots (five plots × two invasion state [invaded and uninvaded] × three habitats [F, G, and W]). The uninvaded areas were assumed to represent the situation prior to the invasion of F. japonica.
Sampling procedure
The soils were sampled using a garden trowel to depths of 0 to 20 cm in May 2016. A quadrat sampling method was used. Five soil subsamples were collected from each quadrat (1 m2), one from each corner and one from the center. The subsamples from each quadrat were then bulked to obtain five representative soil samples (1 kg) for each area. The soil samples were transferred to the laboratory in plastic bags. The bags were stored at 5°C until processing (storage time of soil samples were no longer than one week). Each sample was gently homogenized manually before processing
Soil physical properties
Soil pH was determined for air-dried soil samples in a 1:3 solution of soil: 0.01 M CaCl2 using a pH meter inoLab pH 720-WTW GmbH, Weilheim, Germany. Soil moisture content was measured gravimetrically after the soil had been dried to a constant weight in an oven at 105°C for 24 hr. All determinations were performed in triplicate.
Soil microbial properties
Soil microbial respiration (SMR) was measured by the amount of CO2 released from 100 g of field-moist soil and absorbed by NaOH (μg C-CO2/g soil) in hermetically sealed bottles (Alef and Nannipieri, 1995) at 25°C for 24 hr. Microbial biomass carbon (MBC) content was determined using the method of Islam and Weil (1998), as oven-dried equivalent (ODE) of field-moist soil adjusted to 80% water-filled porosity was irradiated twice by microwave (MW) energy at 400 J g-1 ODE soil to kill the microorganisms. The time settings and MW oven power depended on the total amount of soil in the MW oven. After cooling, soil samples were extracted with 0.5 M K2SO4. Carbon content (Cirradiated) in the extract was quantified by the oxidation with K2Cr2O7 dissolved in H2SO4 and titrimetrically by (NH4)2Fe(SO4)2. The same procedure was done with a non-irradiated sample (Cnon-irradiated). The microbial biomass carbon was then determined as MBC = (Cirradiated-Cnon-irradiated)/KME, whereby extraction efficiency factor KME = 0.213. The activities of acid and alkaline phosphatase were determined by the modified method of Grejtovský (1991) using p-nitrophenyl phosphate as a substrate with incubation at 37°C for 24 hr. Urease activity was determined using urea as a substrate with incubation at 37°C for 3 hr as described by Chazijev (1976), and invertase activity was determined using sucrose as a substrate with incubation at 37°C for 24 hr as described by Schinner and Vonmersi (1990). The control measurements for enzymatic activity did not use the substrate. The activity of all enzymes was measured spectrophotometrically by create a reference curve.
Nematode extraction and identification
Nematodes were isolated from 100 g of the mixed fresh soil samples by a combination of Cobb sieving and decanting (Cobb, 1918) and a modified Baermann techniques (Van Bezooijen, 2006). Nematodes were extracted from aqueous soil suspensions using a set of two cotton-propylene filters. Subsamples were removed after extraction for 48 hr at room temperature. The aqueous suspensions containing nematodes were examined under a stereomicroscope, excessive water was removed, and the nematodes were fixed in hot fixative 99:1 solution of 4% formaldehyde: pure glycerol and evaluated on permanent glycerine slides (Southey, 1986). All isolated nematodes were microscopically examined at 100, 200, 400, 600, and 1,000 × magnification, identified from permanent glycerine slides mostly to species level (juveniles were identified to genus level) using an Eclipse 90i Nikon, Japan light microscope, with original species descriptions, and several taxonomic keys: Brzeski (1998), Loof (1999), Siddiqi (2000), Andrássy (2005, 2007, 2009), and Geraert (2008, 2010).
Cysts of Heterodera juveniles were extracted by floatation (Sabová and Valocká, 1980) from 100 g of soil for species identification based on morphological markers and morphometric data for both cysts and juveniles.
Nematode community analysis and ecological and functional indices
Nematode species were assigned to trophic groups: bacterivores, fungivores, omnivores, predators, plant parasites, root-fungal feeders, and insect parasites, according to Yeates et al. (1993) and Wasilewska (1997).
The total number of species, total nematode abundance, mean number of nematodes per trophic group, and the Shannon and Weaver species diversity index (H’spp.) (Shannon and Weaver, 1949) were determined. Basic ecological indices were used to assess the status of the soil habitats using nematode communities. The maturity index (MI) for free-living taxa and the plant parasite index (PPI) for plant-parasitic taxa (Bongers, 1990), the enrichment (EI), structural (SI), channel (CI) (Ferris et al., 2001), and basal (BI) indices (Berkelmans et al., 2003) were calculated using the online program ‘NINJA: An automated calculation system for nematode-based biological monitoring’ (Sieriebriennikov et al., 2014; http://spark.rstudio.com/bsierieb/ninja).
Statistical analysis
The differences in nematode characteristics (total nematode abundance, abundance of nematodes per trophic group, and species diversity) and basic ecological characteristics (MI, PPI, EI, SI, CI, and BI) were analyzed with two-way ANOVA with ‘ecosystems’ (F, G, and W), ‘invasion status’ (invaded, uninvaded), and their interactions as factors. To meet the assumptions of these parametric tests, Box-Cox transformation was applied with the maximum likelihood approach and Golden Search iterative procedure on. If there was an interaction between ‘ecosystem’ and ‘invasion status’ (total nematode abundance and mean number of bacterivores), post hoc Fisher LSD test was applied separately for each ecosystem to determine the effect of ‘invasion status’. Otherwise, main factor ANOVA with two factors (without interaction) was applied. Consequently, in the case of confirmed significance of ‘ecosystem’, post hoc Fisher LSD test was used.
As untransformed soil physical and microbial properties (pH, SMR, MBC content, and enzymatic activities) were not normally distributed (Shapiro–Wilk test) and transformation did not improve normality, nonparametric statistics were applied. Differences among six combinations of ‘ecosystem’ and ‘invasion status’ were tested separately with Kruskal–Wallis ANOVA, followed by a post hoc multiple comparisons.
The above mentioned statistical analysis were performed using Statistica Cz, version 12.0 (Statsoft, Inc., 2013) and significance of all tests was determined at p<0.05, 0.01, and 0.001.
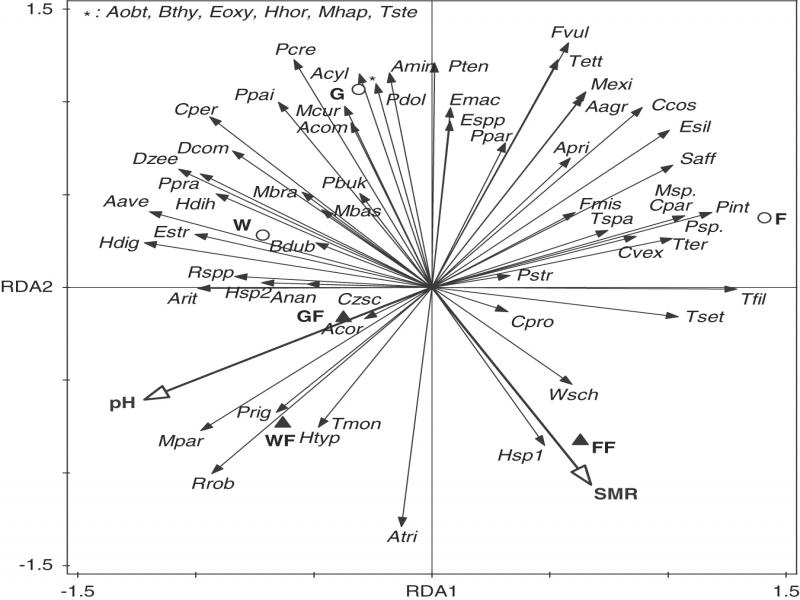
Relationships between plots, nematodes, and selected environmental characteristics (soil pH and soil microbial respiration as constrained variables) were analyzed by ordination techniques. Redundancy analysis (RDA) was performed using Canoco 5 (Ter Braak and Šmilauer, 2012), because response data were compositional and had a gradient of 1.7 standard deviations. The significance of the axis was tested by a Monte Carlo permutation test.
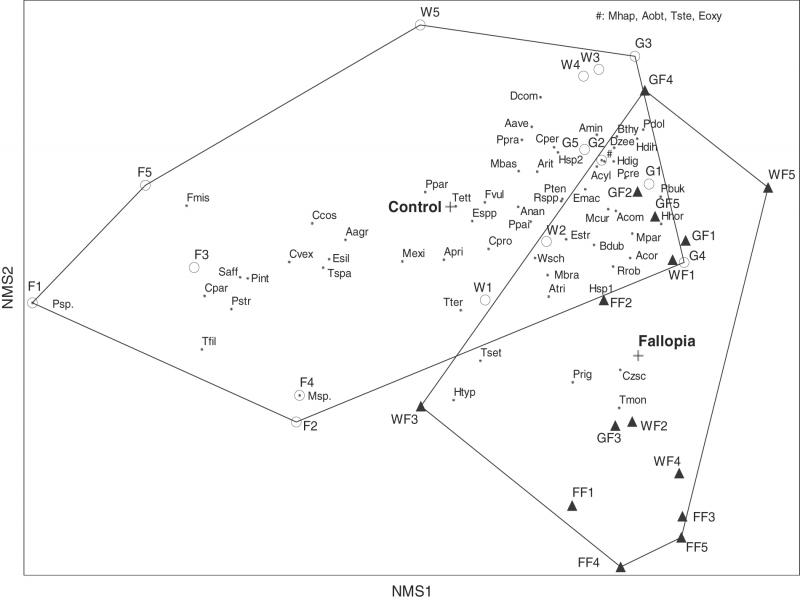
Non-metric multidimensional scaling (NMS) ordination was used to examine any changes in the structure of nematode community for the invaded and the uninvaded habitats. A three-dimensional solution was executed by Autopilot, with the slow and thorough mode and Sørensen (Bray-Curtis) distance (recommended for community data). PC-ORD (McCune and Grace, 2002; McCune and Mefford, 2011) was used for the NMS analysis.
Results
Soil physical properties
The soil physical properties, soil moisture, and pH differed substantially (Kruskal–Wallis statistics with p < 0.001) among the investigated plots (Table 1). The soil moisture content varied from 9.1% in F to 12.4% in W and from 11.7% in GF to 21.5% in WF. Multiple post hoc comparisons confirmed significantly (p < 0.05) higher soil moisture only in the invaded FF than the adjacent uninvaded F. The pH varied from 5.2 in F to 6.8 in W and from 6.4 in FF to 7.2 in WF, but no significant differences were observed between the invaded and the uninvaded plots.
Table 1.
Means and standard errors (SD) of the soil physical properties, microbial respiration, microbial biomass carbon, and enzymes in different ecosystems: forest F; forest with F. japonica FF; grassland G; grassland with F. japonica GF; wetland W; wetland with F. japonica WF.
| F | FF | G | GF | W | WF | ||||||||||||||||
|---|---|---|---|---|---|---|---|---|---|---|---|---|---|---|---|---|---|---|---|---|---|
| Soil Indices | H | Mean | SD | Mean | SD | Mean | SD | Mean | SD | Mean | SD | Mean | SD | ||||||||
| Soil moisture (%) | 21.93*** | 9.1 | 0.04 | c | 14.0 | 0.55 | ab | 9.5 | 0.35 | ac | 11.7 | 0.06 | abc | 12.4 | 0.94 | abc | 21.5 | 0.98 | b | ||
| Soil pH (CaCl2) | 22.30*** | 5.2 | 0.06 | a | 6.4 | 0.06 | ab | 6.1 | 0.06 | ac | 6.8 | 0.06 | ab | 6.8 | 0.05 | bc | 7.2 | 0.06 | b | ||
| Soil microbial respiration | 21.86*** | 139.6 | 7.37 | abc | 185.1 | 8.14 | bc | 58.0 | 14.67 | a | 123.5 | 7.28 | abc | 90.4 | 15.30 | ad | 147.8 | 14.84 | bcd | ||
| Microbial biomass carbon | 17.18** | 344.0 | 33.52 | ab | 370.6 | 11.99 | a | 289.9 | 10.93 | b | 297.5 | 12.6 | b | 309.5 | 8.59 | ab | 351.0 | 16.15 | ab | ||
| Urease | 35.15***,1 | 1.5 | 0.03 | a | 1.3 | 0.02 | ab | 1.2 | 0.11 | ab | 1.4 | 0.08 | a | 0.9 | 0.26 | b | 0.6 | 0.04 | b | ||
| Acid phosphatase | 21.79*** | 60.0 | 1.43 | a | 53.1 | 2.78 | ab | 58.2 | 0.75 | ac | 57.5 | 1.00 | ab | 34.1 | 4.24 | bc | 24.1 | 1.54 | b | ||
| Alkaline phosphatase | 21.37*** | 26.1 | 0.65 | b | 38.3 | 1.18 | ab | 31.7 | 4.57 | ab | 44.2 | 1.31 | a | 34.4 | 2.23 | ab | 26.2 | 0.73 | b | ||
| Invertase | 27.80***,2 | 39.9 | 1.13 | c | 33.9 | 2.91 | ac | 21.2 | 0.99 | b | 25.5 | 0.77 | ab | 31.1 | 1.20 | ab | 28.2 | 0.28 | ab | ||
| F | FF | G | GF | W | WF | ||||||||||||||||
|---|---|---|---|---|---|---|---|---|---|---|---|---|---|---|---|---|---|---|---|---|---|
| Nematode species/trophic groups | Abbr. | c-p | Mean | SD | Mean | SD | Mean | SD | Mean | SD | Mean | SD | Mean | SD | |||||||
| Bacterivores | |||||||||||||||||||||
| Acrobeles cylindricus (Ivanova, 1968) | Acyl | 2 | – | – | – | – | 3.6 | 5.7 | – | – | 0.2 | 0.4 | – | – | |||||||
| Acrobeloides nanus (de Man, 1880) | Anan | 2 | 5.4 | 5.0 | 3.0 | 1.9 | 2.6 | 3.4 | 11.2 | 9.5 | 18.4 | 9.4 | 5.0 | 5.5 | |||||||
| Alaimus primitivus (de Man, 1880) | Apri | 4 | 9.6 | 2.9 | 2.2 | 1.1 | 2.2 | 3.2 | 4.0 | 3.1 | 7.0 | 5.0 | 0.6 | 0.9 | |||||||
| Cephalobus persegnis (Bastian, 1865) | Cper | 2 | 0.8 | 1.8 | – | – | 9.6 | 8.6 | 1.8 | 1.8 | 14.6 | 14.4 | 3.2 | 4.0 | |||||||
| Cervidellus vexilliger (de Man, 1880) | Cvex | 2 | 3.6 | 4.3 | – | – | – | – | 1.4 | 2.1 | – | – | – | – | |||||||
| Eucephalobus oxyuroides (de Man, 1876) | Eoxy | 2 | – | – | – | – | 0.8 | 1.8 | – | – | – | – | – | – | |||||||
| Eucephalobus striatus (Bastian, 1865) | Estr | 2 | – | – | 1.0 | 1.4 | 6.4 | 4.8 | 0.4 | 0.9 | 6.8 | 5.2 | 6.2 | 7.1 | |||||||
| Chiloplacus propinquus (de Man, 1921) | Cpro | 2 | 0.6 | 1.3 | 0.4 | 0.5 | 0.2 | 0.4 | 1.0 | 0.7 | 0.4 | 0.9 | 0.2 | 0.4 | |||||||
| Mesorhabditis sp. juv. | Msp. | 1 | 0.4 | 0.9 | – | – | – | – | – | – | – | – | – | – | |||||||
| Panagrolaimus rigidus (A. Schneider, 1866) | Prig | 1 | – | – | – | – | – | – | – | – | 0.2 | 0.4 | 0.8 | 1.3 | |||||||
| Plectus parietinus (Bastian, 1865) | Ppar | 2 | 5.0 | 6.2 | 0.4 | 0.9 | 1.4 | 2.1 | 0.2 | 0.4 | 4.8 | 3.6 | 1.0 | 1.2 | |||||||
| Plectus parvus (Bastian, 1865) | Ppai | 2 | 3.8 | 3.4 | 1.6 | 2.5 | 5.4 | 3.9 | 3.0 | 2.2 | 7.8 | 6.1 | 4.0 | 3.3 | |||||||
| Plectus tenuis (Bastian, 1865) | Pten | 2 | 0.2 | 0.4 | – | – | 1.2 | 2.7 | – | – | – | – | – | – | |||||||
| Prismatolaimus dolichurus (de Man, 1880) | Pdol | 3 | – | – | – | – | 2.8 | 3.9 | – | – | – | – | – | – | |||||||
| Prismatolaimus intermedius (Bütschli, 1873) | Pint | 3 | 58.8 | 59.0 | 7.8 | 11.7 | 4.2 | 3.3 | 6.2 | 4.1 | 3.6 | 2.3 | 1.0 | 1.2 | |||||||
| Punctodora sp. juv. | Psp. | 3 | 0.6 | 1.3 | – | – | – | – | – | – | – | – | – | – | |||||||
| Rhabditis spp. juv. | Rspp | 1 | 27.8 | 18.0 | 39.4 | 17.3 | 37.4 | 24.5 | 77.6 | 33.0 | 146.6 | 104.5 | 38.8 | 26.4 | |||||||
| Teratocephalus terrestris (Bütschli, 1873) | Tter | 3 | 2.6 | 2.1 | 2.6 | 3.6 | 1.8 | 2.7 | 1.4 | 2.6 | – | – | – | – | |||||||
| Wilsonema schuurmansstekhoveni (de Coninck, 1931) | Wsch | 2 | 2.6 | 4.2 | 2.2 | 2.3 | 0.8 | 1.3 | 4.4 | 4.3 | 0.6 | 0.9 | 1.2 | 2.2 | |||||||
| Fungivores | |||||||||||||||||||||
| Aphelenchoides composticola (Franklin, 1957) | Acom | 2 | 0.2 | 0.4 | 0.6 | 0.9 | 2.2 | 3.2 | 1.4 | 2.1 | 0.6 | 0.5 | – | – | |||||||
| Aphelenchoides minimus (Meyl, 1953) | Amin | 2 | 0.2 | 0.4 | – | – | 3.6 | 3.8 | 0.4 | 0.5 | – | – | – | – | |||||||
| Aphelenchoides ritzemabosi (Schwartz, 1911) | Arit | 2 | – | – | – | – | 0.6 | 1.3 | 0.2 | 0.4 | 3.4 | 4.6 | 2.4 | 1.9 | |||||||
| Aphelenchus avenae (Bastian, 1865) | Aave | 2 | – | – | 0.6 | 0.9 | 6.2 | 3.9 | 6.0 | 6.4 | 19 | 29.1 | 4.0 | 3.8 | |||||||
| Doryllium zeelandicum (de Man, 1876) | Dzee | 4 | – | – | 0.2 | 0.4 | 4.4 | 6.2 | 5.2 | 9.5 | 7.6 | 11.2 | 1.2 | 1.8 | |||||||
| Tylencholaimus stecki (Steiner, 1914) | Tste | 4 | – | – | – | – | 4.0 | 8.4 | – | – | – | – | – | – | |||||||
| Omnivores | |||||||||||||||||||||
| Aporcelaimellus obtusicaudatus (Bastian, 1865) | Aobt | 5 | – | – | – | – | 0.4 | 0.9 | – | – | – | – | – | – | |||||||
| Axonchium coronatum (de Man, 1906) | Acor | 5 | – | – | – | – | – | – | 0.4 | 0.5 | – | – | – | – | |||||||
| Diphtherophora communis (de Man, 1880) | Dcom | 3 | – | – | – | – | 8.2 | 8.8 | – | – | 26.2 | 21.9 | 2.2 | 2.9 | |||||||
| Enchodelus macrodorus (de Man, 1880) | Emac | 4 | 1.4 | 1.9 | 0.6 | 1.3 | 13.6 | 6.8 | – | – | – | – | 1.0 | 1.4 | |||||||
| Eudorylaimus silvaticus (Brzeski, 1960) | Espp | 4 | 10.8 | 6.0 | 1.4 | 1.7 | 7.4 | 2.7 | 1.2 | 1.1 | 9.0 | 7.0 | 6.0 | 4.7 | |||||||
| Eudorylaimus spp. juv. | Esil | 4 | 7.6 | 4.3 | 1.0 | 1.7 | 3.6 | 6.1 | – | – | – | – | – | – | |||||||
| Mesodorylaimus bastiani (Bütschli, 1873) | Mbas | 5 | 0.8 | 1.8 | 0.4 | 0.9 | 0.6 | 0.9 | 0.6 | 1.3 | 9.4 | 3.5 | 0.4 | 0.5 | |||||||
| Microdorylaimus parvus (de Man, 1880) | Mpar | 4 | – | – | 2.6 | 2.6 | 0.8 | 1.3 | 11.8 | 18.2 | 6.4 | 5.9 | 6.8 | 6.0 | |||||||
| Predators | |||||||||||||||||||||
| Anatonchus tridentatus (de Man, 1876) | Atri | 4 | 0.6 | 0.9 | 1.0 | 1.7 | – | – | 0.8 | 1.1 | 1.0 | 1.2 | 1.2 | 1.8 | |||||||
| Coomansus parvus (de Man, 1880) | Cpar | 4 | 5.2 | 3.7 | – | – | – | – | – | – | – | – | – | – | |||||||
| Coomansus zschokkei (Menzel, 1913) | Czsc | 4 | – | – | – | – | – | – | 1.2 | 2.2 | – | – | – | – | |||||||
| Mylonchulus brachyuris (Bütschli, 1873) | Mbra | 4 | 1.2 | 1.8 | 2.6 | 4.0 | 3.0 | 2.7 | 2.2 | 1.5 | 3.6 | 4.4 | 1.2 | 1.8 | |||||||
| Tripyla filicaudata (de Man, 1880) | Tfil | 3 | 5.4 | 11.0 | 2.0 | 4.5 | 0.2 | 0.4 | – | – | – | – | – | – | |||||||
| Tripyla setifera (Bütschli, 1873) | Tset | 3 | 11.2 | 11.0 | 7.4 | 7.8 | 1.0 | 1.0 | 7.4 | 11.6 | – | – | – | – | |||||||
| Trischistoma monohystera (de Man, 1880) | Tmon | 3 | – | – | – | – | – | – | – | – | – | – | 2.6 | 4.7 | |||||||
| Thonus ettersbergensis (de Man, 1885) | Tett | 4 | 2.0 | 2.4 | – | – | 3.0 | 3.0 | – | – | – | – | – | – | |||||||
| Plant parasites | |||||||||||||||||||||
| Bitylenchus dubius (Bütschli, 1873) | Bdub | 3 | – | – | 12.8 | 24.8 | 10.2 | 4.4 | 13.2 | 15.0 | 17.2 | 14.8 | – | – | |||||||
| Helicotylenchus digonicus (Perry, 1959) | Hdig | 3 | 0.8 | 1.3 | 11.0 | 13.2 | 80.8 | 51.2 | 62.2 | 61.1 | 69.8 | 25.9 | 31.0 | 25.3 | |||||||
| Helicotylenchus dihystera (Cobb, 1893) | Hdih | 3 | – | – | – | – | 9.2 | 5.8 | 16.0 | 28.6 | 2.2 | 2.9 | 2.6 | 3.6 | |||||||
| Hemicycliophora typica (de Man, 1921) | Htyp | 3 | – | – | – | – | – | – | – | – | – | – | 6.0 | 11.2 | |||||||
| Heterodera hordecalis (Andersson, 1975) | Hhor | 3 | – | – | – | – | 1.8 | 2.5 | – | – | – | – | – | – | |||||||
| Heterodera sp. 1 juv. | Hsp1 | 3 | – | – | 0.8 | 1.8 | – | – | – | – | – | – | – | – | |||||||
| Heterodera sp. 2 juv. | Hsp2 | 3 | – | – | – | – | – | – | – | – | 1.6 | 0.4 | |||||||||
| Meloidogyne hapla (Chitwood, 1949) | Mhap | 3 | – | – | – | – | 1.0 | – | – | – | – | – | – | ||||||||
| Mesocriconema curvatum (Raski, 1952) | Mcur | 3 | 0.2 | 0.4 | – | – | 2.4 | 0.9 | – | – | 0.2 | 0.4 | 0.6 | 0.5 | |||||||
| Paratylenchus bukowinensis (Micoletzky, 1922) | Pbuk | 2 | – | – | 2.0 | 2.3 | 24.6 | 22.9 | 30.6 | 44.7 | – | – | – | – | |||||||
| Paratylenchus straeleni (de Coninck, 1931) | Pstr | 2 | 153.0 | 160.0 | 0.2 | 0.4 | 0.2 | 0.4 | 6.4 | 6.4 | 28.0 | 20.2 | 20.8 | 33.4 | |||||||
| Pratylenchoides crenicauda (Winslow, 1958) | Pcre | 2 | – | – | – | – | 5.0 | 6.4 | 0.4 | 0.5 | 1.6 | 2.6 | – | – | |||||||
| Pratylenchus pratensis (de Man, 1880) | Ppra | 3 | – | – | 0.6 | 0.9 | 8.4 | 3.8 | 0.6 | 0.9 | 15.6 | 24.6 | 3.4 | 4.7 | |||||||
| Rotylenchus robustus (de Man, 1876) | Rrob | 3 | – | – | 4.0 | 2.1 | 1.4 | 3.1 | 6.8 | 7.0 | 3.2 | 4.1 | 8.4 | 6.4 | |||||||
| Trichodorus sparsus (Szczygiel, 1968) | Tspa | 4 | 33.0 | 19.0 | 2.2 | 4.9 | – | – | – | – | 14.4 | 14.0 | – | – | |||||||
| Root-fungal feeders | |||||||||||||||||||||
| Aglenchus agricola (de Man, 1884) | Aagr | 2 | 25.6 | 45.0 | – | – | 8.4 | 7.2 | 5.0 | 5.5 | 0.6 | 1.3 | 0.6 | 1.3 | |||||||
| Boleodorus thylactus (Thorne, 1941) | Bthy | 2 | – | – | – | – | 19.2 | 15.6 | – | – | – | – | – | – | |||||||
| Coslenchus costatus (de Man, 1921) | Ccos | 2 | 5.0 | 11.0 | – | – | 1.8 | 2.7 | – | – | – | – | – | – | |||||||
| Filenchus misellus (Andrassy, 1958) | Fmis | 2 | 70.2 | 79.0 | – | – | – | – | – | – | 14.2 | 28.0 | 1.4 | 1.9 | |||||||
| Filenchus vulgaris(Brzeski, 1963) | Fvul | 2 | 23.0 | 29.0 | 7.2 | 2.9 | 20.8 | 9.1 | 11.2 | 12.1 | 10.0 | 14.2 | 6.4 | 12.7 | |||||||
| Malenchus exiguus (Massey, 1969) | Mexi | 2 | 7.6 | 7.1 | – | – | 5.4 | 2.7 | 0.6 | 1.3 | – | – | 0.6 | 1.3 | |||||||
| Insect parasites | |||||||||||||||||||||
| Steinernema affine (Bovien, 1937) | Saff | 1 | 3.0 | 3.0 | – | – | 0.4 | 0.9 | 0.2 | 0.4 | – | – | – | – | |||||||
| Total number of species | 36 | 31 | 49 | 37 | 35 | 34 | |||||||||||||||
| Total number of genera | 30 | 27 | 39 | 32 | 31 | 31 | |||||||||||||||
| Ecosystem | Invasion | ||||||||||||||||||||
|---|---|---|---|---|---|---|---|---|---|---|---|---|---|---|---|---|---|---|---|---|---|
| Ecosystem | Invasion | Ecosystem×Invasion | Forest | Grassland | Wetland | Uninvaded | Invaded | ||||||||||||||
| Indices | F(1,26) | p | F(2,26) | p | p | Mean | SD | Mean | SD | Mean | SD | Mean | SD | Mean | SD | ||||||
| Abundanced | 0.87 | ns | 25.86 | *** | 5.08 | * | 305.80 | 247.48 | 324.40 | 117.03 | 324.50 | 229.34 | 436.60 | 199.02 | 199.87 | 111.92 | |||||
| Species diversity index | 3.94 | * | 3.95 | ns | 2.09 | 0.42 | a | 2.52 | 0.34 | b | 2.33 | 0.31 | ab | 2.43 | 0.43 | 2.19 | 0.31 | ||||
| Bacterivoresd | 0.32 | ns | 5.78 | * | 4.98 | * | 92.70 | 59.04 | 96.80 | 45.01 | 136.50 | 115.95 | 138.87 | 95.54 | 78.47 | 44.05 | |||||
| Fungivores | 16.58 | *** | 0.80 | ns | 0.90 | 0.88 | a | 17.10 | 12.01 | b | 19.10 | 27.19 | b | 17.33 | 24.05 | 7.40 | 8.93 | ||||
| Omnivores | 4.34 | * | 22.87 | *** | 14.30 | 12.27 | a | 25.80 | 21.46 | ab | 33.70 | 27.36 | b | 37.07 | 23.29 | A | 12.13 | 11.58 | B | ||
| Predators | 2.64 | ns | 0.27 | ns | 18.30 | 12.54 | 7.90 | 9.26 | 4.80 | 3.94 | 10.80 | 11.10 | 9.87 | 10.68 | |||||||
| Plant parasites | 1.30 | ns | 11.06 | ** | 110.30 | 129.87 | 140.60 | 82.53 | 113.50 | 57.80 | 161.93 | 88.30 | A | 81.00 | 80.37 | B | |||||
| Root-fungal feeders | 4.25 | * | 9.65 | ** | 69.30 | 107.53 | a | 36.20 | 26.56 | a | 16.90 | 31.04 | b | 70.60 | 86.71 | A | 11.00 | 9.38 | B | ||
| Maturity Index | 0.90 | ns | 7.05 | * | 2.22 | 0.37 | 2.20 | 0.32 | 2.05 | 0.34 | 2.31 | 0.32 | A | 2.01 | 0.30 | B | |||||
| Plant-Parasitic Index | 2.00 | ns | 0.15 | ns | 2.57 | 0.32 | 2.58 | 0.20 | 2.77 | 0.19 | 2.62 | 0.28 | 2.66 | 0.23 | |||||||
| Channel Index | 1.18 | ns | 5.32 | * | 22.16 | 29.72 | 12.44 | 8.81 | 8.36 | 9.38 | 21.35 | 24.04 | A | 7.29 | 7.91 | B | |||||
| Basal Index | 0.65 | ns | 2.67 | ns | 10.39 | 8.76 | 11.06 | 5.36 | 11.22 | 5.38 | 12.92 | 7.23 | 8.86 | 5.06 | |||||||
| Enrichment Index | 0.09 | ns | 6.45 | * | 80.54 | 16.57 | 80.95 | 11.08 | 83.01 | 7.97 | 76.10 | 13.48 | A | 86.88 | 7.42 | B | |||||
| Structure Index | 1.27 | ns | 0.00 | ns | 78.73 | 15.51 | 76.59 | 11.14 | 72.35 | 12.72 | 76.58 | 10.65 | 75.20 | 15.45 | |||||||