Soybean cyst nematode (SCN), Heterodera glycines Ichinohe, is widely distributed throughout most soybean producing regions in the world (Riggs, 2004). This nematode has become a major yield-limiting factor in soybean production and causes an estimated annual yield loss of about $1 billion in the USA (Koenning and Wrather, 2010). Crop rotation, cultural practices, resistant cultivars, and nematicides are employed to reduce soybean yield suppression caused by SCN. Particularly, rotation of SCN-susceptible soybean with non-host and SCN-resistant cultivars is considered the best method to manage SCN (Niblack and Chen, 2004; Niblack, 2005).
The beneficial effects of rotation of corn and soybean have been studied extensively, and in general, rotation increases the yields of both corn and soybean crops (Crookston et al., 1991). However, mechanisms of crop rotation are not fully understood. Suppression of pests and pathogens, including plant-parasitic nematodes, is probably one of the beneficial effects of rotation on soybean and corn yields (Grabau and Chen, 2016a, 2016b). Benefits of rotation crops that are non-hosts to SCN are well known. An early study showed that crop rotation reduces SCN population density and improves the soybean yield in an SCN-infested field, and greater yields are obtained with longer rotation with non-hosts (Sasser and Uzzell, 1991). However, corn is less effective than leguminous non-hosts (Miller et al., 2006; Warnke et al., 2006), and a single year of corn rotation may be insufficient for SCN management (Chen et al., 2001b).
Since the late 1980s, conservation tillage is used increasingly in the USA to limit soil erosion, preserve soil moisture during drought, improve water quality, increase organic matter, and reduce fuel costs (Fawcett and Towery, 2003; Noel and Wax, 2003). However, beneficial effects of using conservation tillage in managing plant-parasitic nematodes are inconsistent (McSorley, 1998). Several studies focus on the effects of tillage on SCN in the USA. In the southern USA, no-till generally reduces SCN population densities (Tyler et al., 1983, 1987; Edwards et al., 1988; Lawrence et al., 1990; Hershman and Bachi, 1995; Koenning et al., 1995; Donald et al., 2009). Inconsistent effects of tillage on SCN are reported from the north central USA. Reduction of SCN population densities by no-tillage is reported from field experiments in western Kentucky (Hershman and Bachi, 1995) and Indiana (Westphal et al., 2009). These individual experiments agree with a survey of the north central USA (Workneh et al., 1999). However, there is no effect or minimum effect of tillage on SCN population in Minnesota, even though the soybean yields are greater in fields of conventional tillage practice (Chen et al., 2001c; Chen, 2007b). In contrast, greater SCN reproduction is reported in no-tillage soils as compared with conventional tillage in Illinois (Noel and Wax, 2003) and Minnesota (Noel and Wax, 2003; Grabau et al., 2017). These differences may be due to different cropping systems, soil types, environmental conditions, and their interaction with the nematode.
Generally, agricultural soil has low levels of buffering against plant diseases. However, there are some soils which greatly suppress a specific pathogen and, most importantly, the suppressiveness can be transferred by small portions of soil (Westphal, 2005). Specific suppressive soil has been favored by scientists because of its potential role in biological control. Usually, specific suppressive soil is first noticed when a pathogen declines with long-term monoculture of a susceptible crop (Schroth and Hancock, 1982; Westphal, 2005). Soils suppressive to SCN are reported in a number of locations in the USA and other regions in the world (Carris et al., 1989; Liu and Wu, 1993; Kim and Riggs, 1994; Chen et al., 1996; Sun and Liu, 2000; Chen, 2007a; Bao et al., 2011). Although dozens of nematode-suppressive soils have been discovered, the relation between crop sequence and soil suppressiveness has not been fully investigated, not to mention the interaction between microbes and cultural practices. Investigating soil suppressiveness under different cultural practices and biocide treatments in the field and validating the suppression in a greenhouse study is the first essential step to reveal the mechanism of soil suppression. Subsequently, validation in a research field with demonstrated specific suppressiveness to SCN serves as an ideal model to study mechanisms of suppressiveness (Bao et al., 2011; Hu et al., 2017). This study is the first to test effects of agricultural cultural practices and biocide on soil suppressiveness under both greenhouse and field conditions, which provides invaluable information for biological control.
Biocide treatments using fumigants, such as methyl bromide and formaldehyde, or fungicides, such as captafol, successfully reduce or eliminate the soil suppressiveness in fields (Williams, 1969; Kerry et al., 1980; Crump and Kerry, 1987). While captafol is a general fungicide, methyl bromide and formaldehyde are broad-spectrum biocides which can kill bacteria, fungi, and other organisms in the soil. The overall aim of this study was to distinguish the roles of tillage, crop sequence, and biocide in SCN soil suppression. Specific objectives were twofold: (i) quantify the effects of tillage, crop sequence, and biocide on SCN population density and soybean yield in the nematode-suppressive fields; and (ii) validate field treatment effects on soil suppressiveness at two field locations and in a controlled greenhouse environment. The justification for using the three biocide treatments was to target microbial communities, and determine if fungi, bacterial, or both were involved in the suppression of nematode populations. The treatment effects on microbial communities were studied with cultural methods as well as amplicon-based metagenomic analysis; and the data are presented in separate publications (Hu et al., 2017).
Materials and Methods
Field sites
This research was conducted at two field sites in Waseca County in Southern Minnesota for four years. Site 1 was located at the University of Minnesota Southern Research and Outreach Center (44°04′21″ N 93°31′21″ W) in Waseca, Minnesota, which had been planted to soybean continuously for 37 years and no-tillage had been practiced for the past 11 years before the experiment was established in 2009. Site 2 was in a commercial field (43°52′38″ N 93°43′14″ W) in Minnesota Lake, Minnesota, which had been in soybean monoculture for more than 20 years by 2005 when the field was planted to corn for four years prior to this experiment. The soil at Site 1 was a Nicollet clay loam (fine loamy, mixed, mesic Aquic Hapludoll), and the soil at Site 2 was Webster clay loam (fine loamy, mixed, mesic Endoaquoll). The soils in both fields were demonstrated to be suppressive to SCN (Chen, 2007a; Bao et al., 2011).
Experiment design
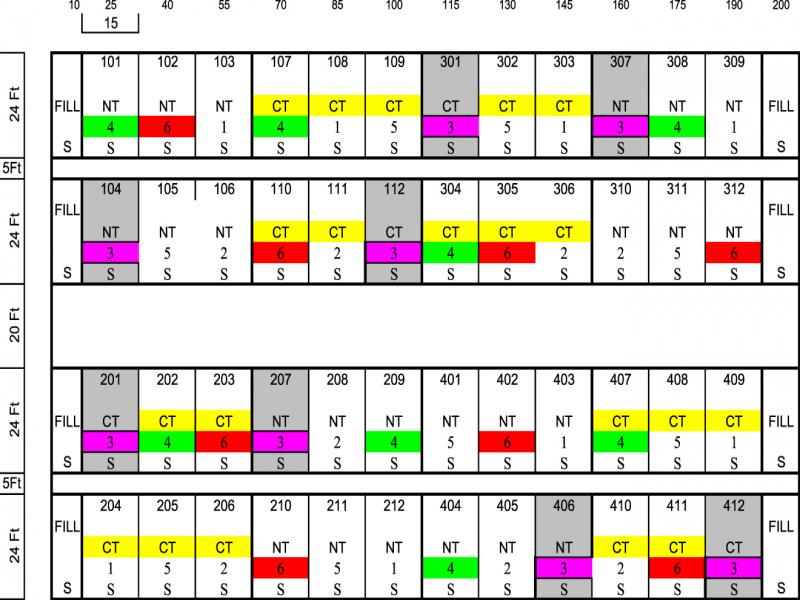
The experiment was a split-plot design with no-tillage and conventional tillage as main plots, and the crop sequence-biocide treatments as subplots with four replicates (Fig. A1). The crop sequence-biocide treatments were carried out from 2009 to 2012 (Table A1): (i) corn (C)/soybean (S) (susceptible to SCN) annual rotation (C-S-C-S) without biocide, (ii) rotation of corn/SCN-resistant soybean (R)/corn/SCN-susceptible soybean (C-R-C-S) without biocide, (iii) monoculture of SCN-susceptible soybean (S-S-S-S) without biocide, (iv) S-S-S-S with bactericide streptomycin treatment, (v) S-S-S-S with captan (N-trichloromethylthio-4-cyclohexene-1, 2-dicarboximide) fungicide treatment, and (vi) S-S-S-S with the general biocide formaldehyde. At Site 2, the formaldehyde treatment was omitted considering its high toxicity and proximity of the site to a residential house. The main plot was 16.2 m long and 13.71 wide, each subplot was 7.6 m long and 4.57 m wide which included six rows of crops (Fig. A1). All treatments were repeated annually from 2009 to 2012 at both sites.
Plot establishment and maintenance
For the formaldehyde treatment, 6.8 liter of 38% formaldehyde (Formalin) in 220 liters water was applied by irrigation in the four central rows (3000 L formalin per ha) 3 wk before planting. Appropriate safety instructions were followed when applying formalin. For the streptomycin and captan treatments, 18 grams of streptomycin sulfate (Sigma S 5601) (7.75 kg a.i./ha) and 27 grams a.i. of captan (80% wettable powder) (11.6 kg a.i./ha) each in 220 liters of water were applied by a pump from a tank into the surface of four central rows 1 wk before planting and every 2 wk after planting for two months (five times per year).
The conventional tillage treatment was fall chisel plowing after harvesting, and field cultivation followed by a finishing implement prior to planting. Fertilizer application was based on soil fertility test recommendations of the University of Minnesota Soil Test Laboratory. Fertilizer nitrogen in the form of urea with Agrotain nitrogen stabilizer was applied to corn plots only at the rate of 180 kg/ha in 2009, and 225 kg/ha in 2011. No other fertilizers were applied in soybean and corn during the 4yr. Corn and soybean were planted between late May and early June, and harvested between early October and mid-November depending on the soil and weather conditions each year. The SCN-resistant soybean cultivar was Latham EX547 RR N (PI 88788 source of resistance), SCN-susceptible soybean cultivar was Pioneer brand 92B13, and corn cultivar was DeKalb 46–61. All of the soybean and corn cultivars were resistant to glyphosate (2-phosphonomethylamino acetic acid), and glyphosate was used for both pre-emergence and post-emergence weed control. No insecticide or additional fungicide was used.
Nematode population and soybean yield measurements
A soil sample consisting of 20 soil cores (2-cm diameter, 20 cm deep) was collected from each subplot in a systematic pattern across the two central rows at planting to assess initial (Pi), midseason (Pm) approximately 2 months after planting), and final population (Pf) at harvest. The soil was passed through a 5-mm aperture sieve and mixed thoroughly. The soil samples were stored in a cool room (4 °C) before being processed. Cysts were extracted from a subsample of 100 cm3 of soil with a semiautomatic elutriator (Byrd et al., 1976) and separated from soil particles and debris with centrifugation in a 63% (w/v) sucrose solution (Chen and Liu, 2005). Eggs were released from the cysts mechanically (Faghihi and Ferris, 2000) and collected in a 50-mL tube. The number of eggs was counted in a 0.5 to 2.0 mL aliquot, depending on the egg population density, and the total number of eggs in 100 cm3 of soil was derived. Soybean yields were measured from a 4.57-m length of the two central rows with a small plot combine. The soybean yield was standardized at 13% moisture.
Greenhouse assay for nematode suppressiveness
To validate soil suppressiveness of each field treatment, soil samples from each plot were collected at midseason each year from 2009 to 2012 for a greenhouse assay. However, the results of 2011 were not reported because of insufficient SCN infection of soybean in the greenhouse. Approximately 4.5 kg soil was taken from 10 locations in each plot systematically to depth of 15 to 20 cm with a shovel. Each of the soil samples was passed through 5-mm aperture sieve, mixed thoroughly, and divided into three subsamples. Each subsample received one of three treatments: (i) 100% autoclaved field soil, (ii) 10% autoclaved field soil + 90% untreated field soil, and (iii) 100% field soil. The soil was autoclaved for 1 hr at 121°C.
An isolate of SCN HG Type 2.5.7 cultured on SCN-susceptible soybean in pots with autoclaved soil in the greenhouse was used as inoculum. The eggs of this population were extracted from the soil utilizing a similar method as described above, and then hatched in 4 mM ZnCl2 hatching solution (Chen et al., 2000a, 2000b). J2 that hatched within the second and fifth day were collected and rinsed thoroughly as inoculum.
Each subsample of soil was placed in a 15-cm-diameter pot. Seven soybean ‘Freeborn’ (PI 88788 source of resistance) seeds, that had been treated with 0.5% NaOCl for 3 min, were sown in each pot. Freeborn, which was susceptible to the population of HG 2.5.7 with a female index of 65% but resistant to the SCN populations (HG type 0) from the field plots, was used to minimize the effect of initial populations in the untreated soil. Pots were arranged in completely randomized blocks and maintained in the growth room with an average temperature of 28°C (range 20–30°C). After 1 wk, the plants were thinned to provide four plants, and 5,000 SCN J2 were added in six holes, 3 cm deep, around the soybean plants in each pot. The soil was supplied with a P-N-K fertilizer (0.08 g P2O5 + 0.0.08 g N + 0.04 g K2O/pot) after 4 wk of planting to minimize the effects of autoclaving on soil fertility.
Plant heights and total dry shoot weights per pot were measured at the termination of the experiments (60 d after inoculation). After cutting soybean shoots at the soil surface, the soil ball was broken and thoroughly mixed. Nematode egg population densities were determined with the procedures described previously (Chen and Liu, 2005).
Data analysis
The general linear model (GLM) procedure in Statistical Analysis System (SAS) Version 9.2 (SAS Institute, Cary, NC) was used to perform the split-plot analysis of variance (ANOVA). Dependent variables were evaluated for normality and transformed as necessary before performing the ANOVA. Significant differences were reported at P < 0.05 unless otherwise stated. In the field experiments, egg population density was transformed by x 0.2 to x 0.5 and yield data were not transformed. In contrast, egg population density was transformed by log(x), and shoot dry weight data were not transformed in the greenhouse experiment.
Results
Nematode population density
Main effect of tillage
The overall mean SCN egg population density at planting in 2009 was 4,326 eggs/100 cm3 soil at Site 1 and only 102 eggs/100 cm3 soil at Site 2. No effect of tillage on the egg population density was observed in most of the 12 sampling occasions over the 4 yr at both sites, except that no-tillage reduced midseason egg population density at both sites in 2010, but increased midseason egg population density at Site 1 in 2012 as compared with conventional tillage (Table 1).
Table 1
Tillage, crop rotation, and biocide treatment effects on Heterodera glycines population density (eggs/100 cm3 soil) at nematode suppressive soil at two field sites in Minnesota.
| Year | 2009 | 2010 | 2011 | 2012 | |||||||||
|---|---|---|---|---|---|---|---|---|---|---|---|---|---|
| Treatment | Pi | Pm | Pf | Pi | Pm | Pf | Pi | Pm | Pf | Pi | Pm | Pf | |
| Site 1 | |||||||||||||
| Tillage: | |||||||||||||
| No-tillage | 4,258 a | 4,442 a | 7,033 a | 4,853 a | 2,400 b | 5,664 a | 4,442 a | 2,507 a | 6,319 a | 4,621 a | 3,022 a | 11,666 a | |
| Conventional tillage | 4,393 a | 4,241 a | 8,547 a | 5,135 a | 3,378 a | 5,981 a | 4,622 a | 2,116 a | 6,457 a | 3,409 b | 2,510 a | 8,613 a | |
| Crop-Biocide: | |||||||||||||
| C-S-C-S, | no biocide | 3,881 a | 3,200 c | 2,250 b | 1,766 b | 1,102 d | 4,238 c | 2,263 c | 1,275 b | 1,175 d | 677 d | 1,114 c | 11,803 b |
| C-R-C-S | no biocide | 4,519 a | 3,350 c | 2,756 b | 1,480 b | 848 d | 1,394 d | 1,075 d | 678 c | 438 e | 345 d | 477 d | 6,975 c |
| S-S-S-S | streptomycin | 5,338 a | 5,452 a | 11,675 a | 6,609 a | 2,581 c | 4,938 bc | 3,556 b | 1,791 b | 6,488 c | 4,413 bc | 2,628 b | 6,209 c |
| S-S-S-S | captan | 4,013 a | 5,409 a | 10,444 a | 6,775 a | 4,131 b | 6,381 b | 4,334 b | 2,406 b | 9,181 b | 6,206 ab | 3,847 b | 9,781 bc |
| S-S-S-S | no biocide | 4,641 a | 4,847 ab | 9,794 a | 5,947 a | 2,828 c | 5,331 bc | 3,406 bc | 1,597 b | 6,506 c | 3,969 c | 2,666 b | 8,169 c |
| S-S-S-S | formaldehyde | 3,566 a | 3,794 bc | 9,825 a | 7,391 a | 5,856 a | 12,656 a | 12,563 a | 6,125 a | 14,541 a | 8,481 a | 5,866 a | 17,897 a |
| Overall means | 4,326 | 4,342 | 7,790 | 4,994 | 2,889 | 5,823 | 4,532 | 2,312 | 6,388 | 4,015 | 2,766 | 10,140 | |
| ANOVA (F-statistics): | |||||||||||||
| Tillage | 0.09 | 0.01 | 3.82 | 0.19 | 25.46* | 0.34 | 1.04 | 0.07 | 0.53 | 18.2* | 0 | 1.14 | |
| Crop-Biocide | 1.98 | 5.65*** | 23.08**** | 33.56**** | 32.2**** | 32.83**** | 38.2**** | 16.09**** | 75.89**** | 39.18**** | 33.03**** | 10.88**** | |
| Tillage × Crop-Biocide | 0.32 | 1.84 | 2.38 | 1.28 | 1.67 | 3.76** | 1.8 | 1.79 | 1.72 | 1.01 | 4.16** | 1.23 | |
| Site 2 | |||||||||||||
| Tillage: | |||||||||||||
| No-tillage | 139 a | 553 a | 1,146 a | 899 a | 519 b | 2,586 a | 2,892 a | 2,747 a | 6,708 a | 3,635 a | 2,368 a | 7,646 a | |
| Conventional tillage | 65 a | 539 a | 1,732 a | 803 a | 955 a | 2,893 a | 2,702 a | 2,467a | 6,205 a | 2,993 a | 2,634 a | 7,590 a | |
| Crop-Biocide: | |||||||||||||
| C-S-C-S | no biocide | 136 a | 106 b | 214 c | 64 b | 139 b | 1,381 b | 1,025 b | 1,363 b | 1,594 c | 806 c | 1,141 c | 8,231 a |
| C-R-C-S | no biocide | 123 a | 158 b | 91 c | 374 b | 72 b | 153 c | 163 c | 100 c | 125 d | 144 d | 197 d | 3,631 b |
| S-S-S-S | streptomycin | 92 a | 1,053 a | 1,586 b | 802 a | 1,064 a | 4,506 a | 3,919 a | 4,322 a | 10,369 ab | 3,988 b | 3,188 b | 7,991 a |
| S-S-S-S | captan | 98 a | 809 a | 2,430 ab | 1,439 a | 1,203 a | 4,113 a | 5,150 a | 4,856 a | 12,563 a | 7,581 a | 5,859 a | 11,325 a |
| S-S-S-S | no biocide | 61 a | 602 a | 2,873 a | 1,579 a | 1,208 a | 3,544 a | 2,781 a | 3,347 a | 7,631 b | 4,050 b | 2,119 b | 6,913 a |
| Overall means | 102 | 546 | 1,439 | 851 | 737 | 2,740 | 2,797 | 2,607 | 6,457 | 3,314 | 2,501 | 7,618 | |
| ANOVA (F-statistics): | |||||||||||||
| Tillage | 3.9 | 0.41 | 2.07 | 1.64 | 10.56* | 0.96 | 1.21 | 0.89 | 3.85 | 0.25 | 2.87 | 0.02 | |
| Biocide-crop | 7.18*** | 22.01**** | 7.77*** | 22.45**** | 34.09**** | 20.98**** | 29.94**** | 54.87**** | 37.73**** | 28.89**** | 6.09** | ||
| Tillage × Crop-Biocide | 0.09 | 0.26 | 1.08 | 0.15 | 4.67** | 1.17 | 1.24 | 0.69 | 0.36 | 1.25 | 0.43 | 0.57 | |
| Treatments | Pf2010, Site 1 | Pm2012, Site 1 | Pm2010, Site 2 | ||||||||||
|---|---|---|---|---|---|---|---|---|---|---|---|---|---|
| Crop | Biocide | No-tillage | Conventional tillage | No-tillage | Conventional tillage | No-tillage | Conventional tillage | ||||||
| C-S-C-S | No biocide | 5,175 | ab A | 3,300 | c A | 959 | c A | 1,269 | cd A | 141 | b A | 138 | c A |
| C-R-C-S | No biocide | 1,238 | d A | 1,550 | d A | 219 | d B | 734 | d A | 131 | b A | 13 | c B |
| S-S-S-S | Streptomycin | 3,300 | c B | 6,575 | b A | 2,744 | b A | 2,513 | b A | 322 | a B | 1,806 | bc A |
| S-S-S-S | Captan | 5,538 | b A | 7,225 | b A | 5,438 | a A | 2,256 | bc B | 1,047 | a A | 1,359 | a A |
| S-S-S-S | No biocide | 4,275 | bc A | 6,388 | b A | 2,988 | b A | 2,344 | bc A | 956 | a A | 1,459 | ab A |
| S-S-S-S | Formaldehyde | 14,463 | a A | 10,850 | a A | 5,788 | a A | 5,944 | a A | ||||