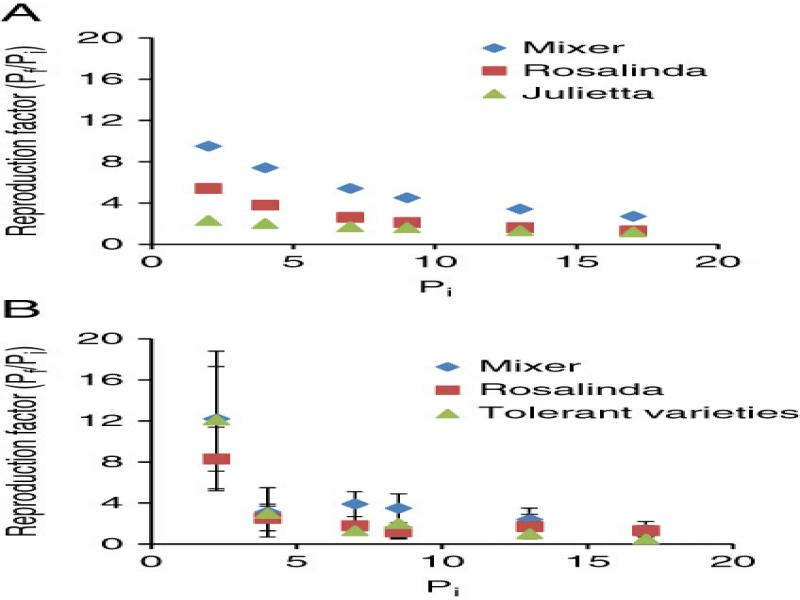
The incidence of SBN has increased in Swedish sugar beets production in recent years, partially due to warmer summers, increased acreages of winter oil seed rape (WOSR) and the transition to a three-year crop rotation (Andersson, 1999). Cultivation of sugar beet in Sweden follows the environmental management system MBO (Environmental Management for Beet Production), guidelines including recommendations on cropping intensity of sugar beets in the crop rotation. The MBO system principle is rather similar to the ISO 9001system, and it is compulsory for all sugar beet growers (Olsson and Nordstrom, 2002). According to the MBO system, the frequency of sugar beets crops in the crop rotation is limited to once every three years or once every four years if WOSR is included in the crop rotation. Chemical control of nematodes is not allowed, instead, an integrated pest management (IPM) strategy based on cultivation of tolerant sugar beets varieties, crop rotation, and to some extent cultivation of nematode resistant intercrops is adopted by the growers. In fact, this strategy is largely in agreement with the EU-directive 2009/128/EC (http://eur-lex.europa.eu/legal-content/EN/TXT/PDF/?uri=CELEX:02009L0128-20091125&from=EN), which obligates the implementation of IPM in the EU-member states. In this directive, crop rotation is indicated as one of the important control measures to suppress pests, weeds, and soil-borne pathogens. Information on susceptibility of different sugar beets varieties and the ability of resistant intercrops to reduce SBN population is provided by annual testing in commercial field trials conducted by the Nordic Beet Research (Olsson, 2011). However, assembling the information into a practical tool for planning sustainable crop rotations to avoid risk of infestation by SBN can be a difficult task for both sugar beet growers and crop advisors.
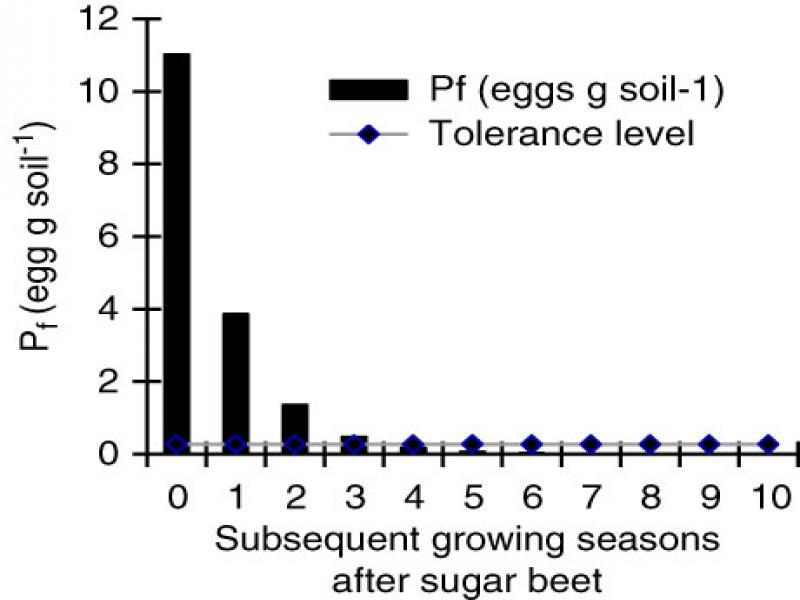
Decision support systems (DSS) are tools that help the user makes a decision based on relevant information and accurate analysis, easily accessible to the user (browser-based), have generally low operation costs and are easy to update. DSS became popular and widely used in crop rotation planning (Dogliotti et al., 2003), choice of pesticide methods to control weeds (Newe et al., 2003), and risk assessment of plant diseases (Raatjes et al., 2004). Such systems were also developed as a tool for managing certain plant parasitic nematodes. dev “NemaDecide” a DSS was developed by Been et al. (2006), for managing the potato cyst nematodes (Globodera rostochiensis and G. pallida). This system enables the growers to estimate risks of yield loss, follow the population development of the nematodes and gives recommendation for chemical control. Another DSS for managing parasitic nematodes is “Nemaplot” (http://www.nemaplot.de/Applet/plotnema_eng.html), and the model used simulates the whole life cycle of sugar beet nematode (H. schachtii), taking in consideration the number of generations in a growing season (Schmidt et al., 1993). Furthermore, crop rotations are planned by integrating cultivation of non-host crops and intercrops with sugar beets to keep the SBN population below tolerance limit. However, “Nemaplot” does not give a possibility to choose between different sugar beet varieties. A key issue in planning crop rotation is estimating the time it takes for a SBN population to reach the tolerance level when non-hosts are grown after the sugar beet crop. “Nemaplex” is a DSS based on the models of Burt and Ferris (1996) to manage plant parasitic nematodes (http://nemaplex.ucdavis.edu/Uppermnus/MangmntUtilities.htm). The SeqOpt application in “Nemaplex” estimates the optimum rotation length under non-host conditions. However, as in “Nemaplot,” the SeqOpt does not offer the choice of a specific sugar beets variety. The aim of this study was to develop a user-friendly DSS for planning sustainable and economically feasible crop rotations for sugar beets in Sweden. “SBN-Watch” was developed in close collaboration with the Sugar Beets Growers Association and crop advisors in Sweden. In general, sugar beet varieties are grouped into four categories: (i) “Standard” varieties, susceptible to SBN; (ii) “Tolerant” varieties, which produce high yield despite the occurrence of SBN; (iii) “Semi-tolerant” varieties, which maintain normal yield in soils with low SBN densities; and (iv) resistant varieties (Reuther et al., 2017). Based on differences in multiplication factors of four sugar beets varieties, one “Standard,” one “Tolerant” and two “Semi-tolerant,” the decline rates under non-host crops, the SBN population dynamics and corresponding sugar yields were estimated by SBN-Watch using published models (Seinhorst, 1965; Seinhorst, 1967; Burt and Ferris, 1996).
Materials and methods
Database construction
The database consisted of two units, (i) a sugar beets unit with a list of “Standard,” “Semi-tolerant” and “Tolerant” varieties, and (ii) an intercrop unit. The varietal unit included values of parameters for calculating sugar yield and SBN population dynamics. These values were obtained from Swedish and Danish commercial field trials (Olsson, 2011). The intercrop unit included Rf values of resistant class 1 and 2 of mustard and oil seed radish cultivars (Olsson, 2009).
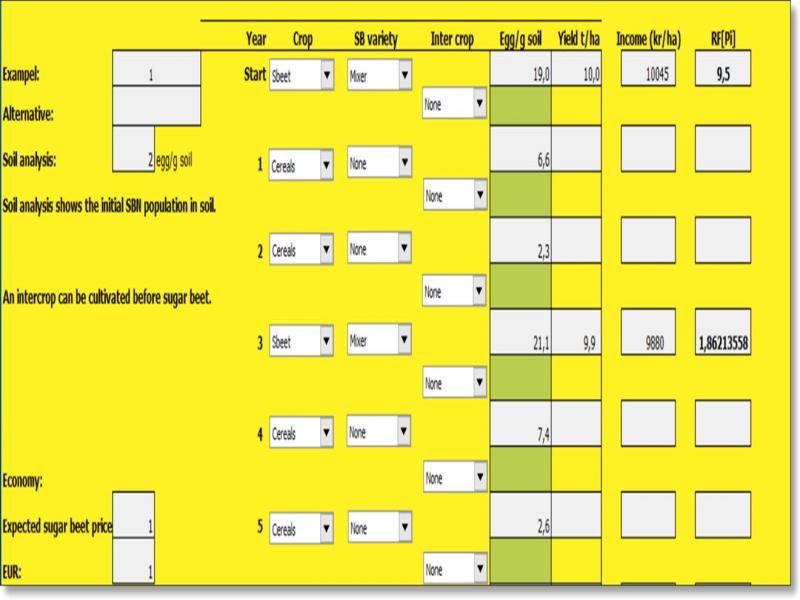
Data input
To start using the SBN-Watch, certain data are required to be entered by the user. The most important input is the average initial population density in the soil Pi (eggs g−1 soil). Field soil has to be sampled according to, guidelines from the Nematode Laboratory (NL) laboratory, which provides services for growers for analyzing plant parasitic nematodes in soil. Other data inputs are financial information regarding the expected sugar beets price (€ tonne−1) and exchange rate (€ to SEK). Using a drop-down list, sugar beet varieties and crop sequence can be selected. Additionally, another option concerning tolerance (T) can be made by the user through entering a specific (T) value for the selected sugar beet variety.
Modeling population dynamics of SBN
Changes in the population of SBN in the soil under presence of the host (sugar beet) or non-host crop plants have been described by different equations in the literature. A modified equation by Burt and Ferris (1996) was used to describe SBN population dynamics when a non-host crop was selected to be cultivated in the crop rotation:
where s = proportion of the population survived (s = 0.35); Pi (eggs g−1 soil) = initial population of SBN at sowing expressed as number of eggs g−1 soil; and m = number of years the non-crop was grown in succession. If WOSR was selected to be cultivated in the rotation, a multiplication factor of 1.5 was used instead (Olsson and Olsson, 2006).When a sugar beets variety was selected for cultivation, the final population Pf was calculated by the equation of Seinhorst (1967):
where a = Reproduction factor at very low Pi values; s = proportion of the population survived (s = 0.35); q = constant < 1.The reproduction factor (Rf) of a sugar beet variety was then calculated as Rf = Pf/Pi. To estimate the number of years required for (Pi) to reach (T) for specific sugar beets variety, the equation of Burt and Ferris (1996), Equation (1), was used modification:
where Tv = tolerance limit for specific sugar beets variety was used instead of population P; Rfv = reproduction factor (Rf = Pf/Pi) of a given sugar beets variety; s = survived proportion of SBN = 0.35.Estimating sugar yield
To estimate yield loss of sugar beets due to infestation by SBN, the equation of Seinhorst (1965), which relates sugar beet yield to SBN population density at sowing was used:
where Y = relative yield; m = minimum yield at the highest SBN population; Z = constant; Pi = initial SBN population at sowing (eggs g−1 soil); and T = tolerance limit. When Y × Z(Pi−T) is < m × Y the value of m × Y is used to express yield. When Y × Z(Pi−T) > m × Y the yield is estimated by the equation Y × Z(Pi−T).Demonstration of the influence of crop rotation on SBN population dynamics and sugar beet yield by SBN-Watch
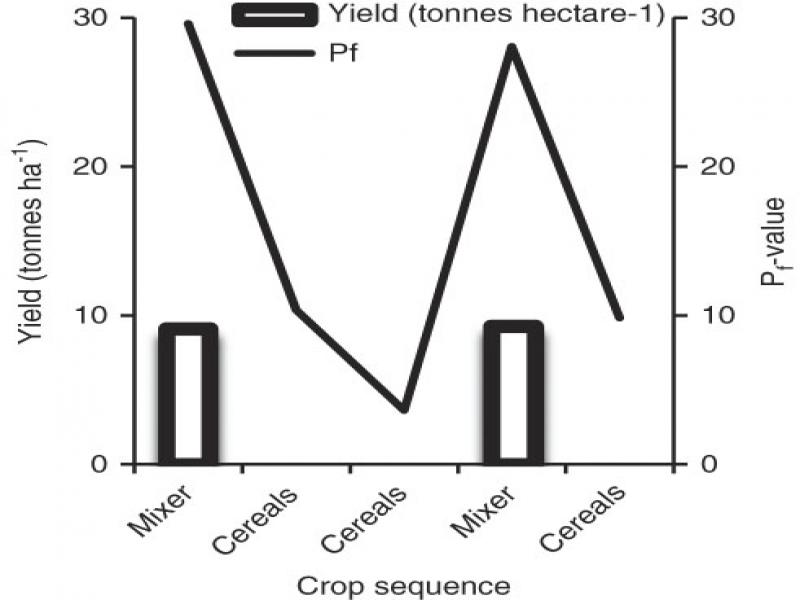
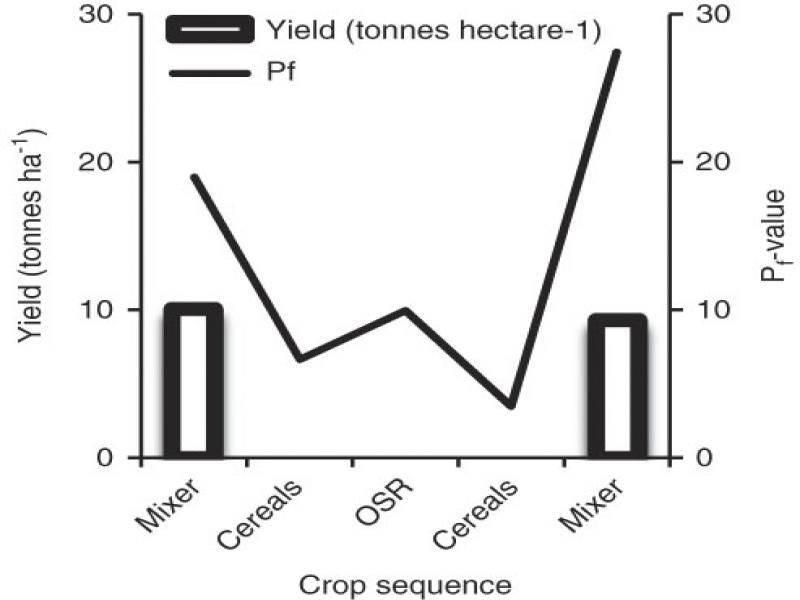
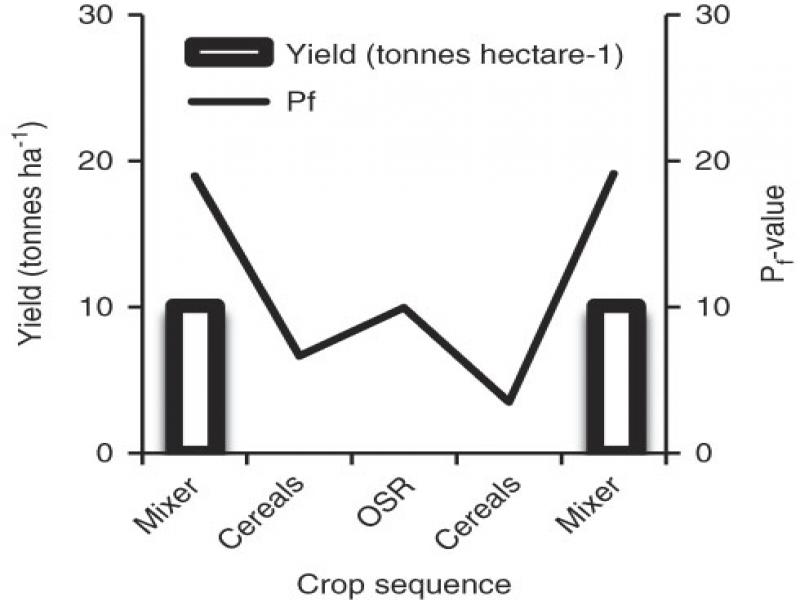
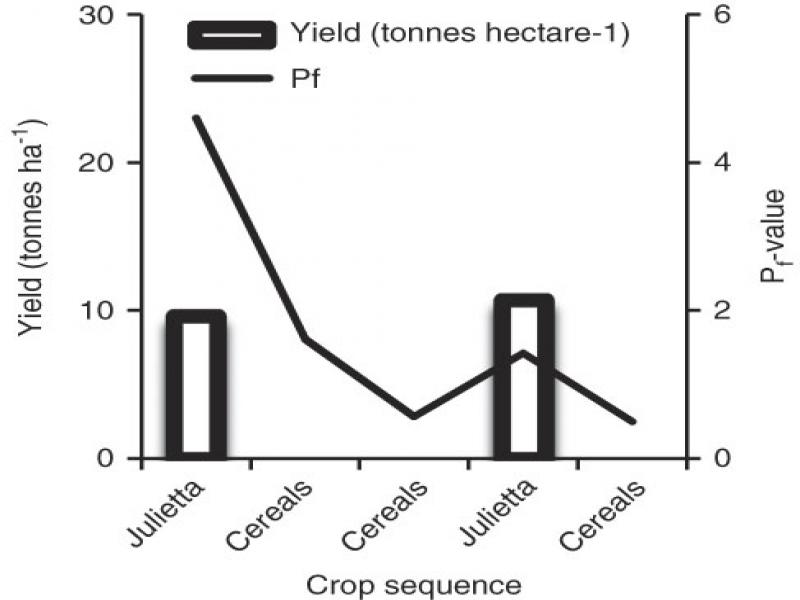
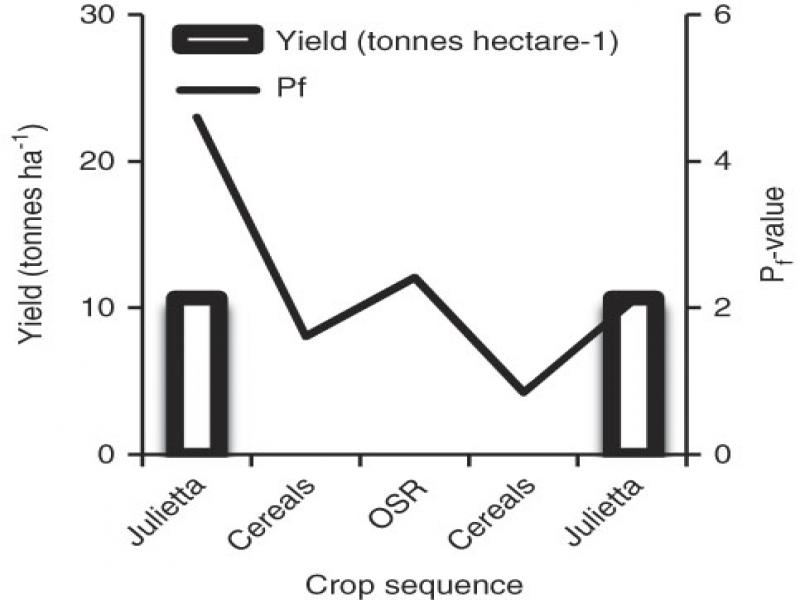
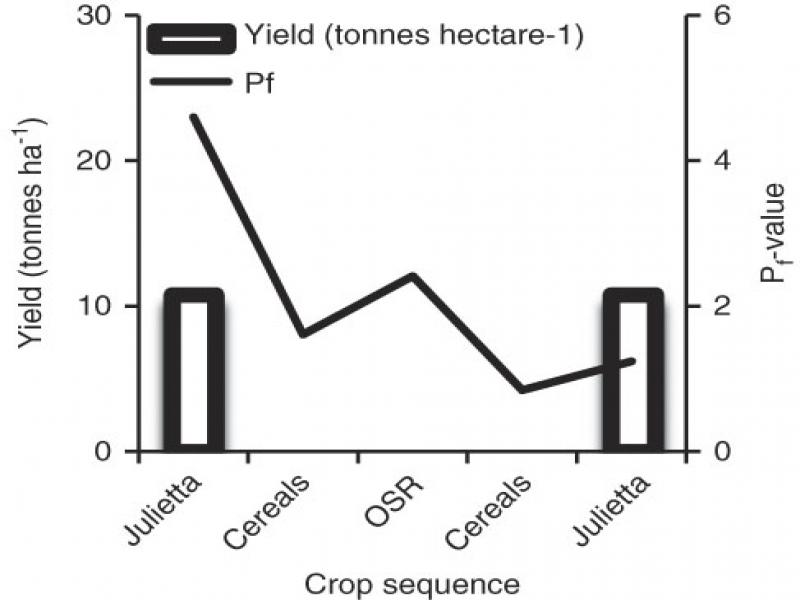
Different crop rotation scenarios were chosen to illustrate the influence of sugar beet varieties, non-host crops, WOSR and intercrops on the SBN population and sugar yield as shown in Table 2. Pi value of 2 eggs g−1 soil was assumed in the initial year of sugar beet cropping.
Table 1.
Crop rotations planned by SBN-Watch.
| Rotation | Cro | > p sequence | ||||
|---|---|---|---|---|---|---|
| 1 | Mixer1 | Cereals | Cereals | Mixer | ||
| 2 | Mixer | Cereals | WOSR | Cereals | Mixer | |
| 3 | Mixer | Cereals | WOSR | Cereals | Oil radish | Mixer |
| 4 | Julietta2 | Cereals | cereals | Julietta | ||
| 5 | Julietta | Cereals | WOSR | Cereals | Julietta | |
| 6 | Julietta | Cereals | WOSR | Cereals | Oil radish | Julietta |
| pH | P–AL1 | K–AL2 | Clay | OM3 | Sand | |
|---|---|---|---|---|---|---|
| mg 100 g jord−1 | % | |||||
| 7,1 | 12 | 6,4 | 1 | 8 | 73 | |
| Varietal category | Pi (eggs g−1 soil) | |||||
|---|---|---|---|---|---|---|
| Year | Standard | Semi-tolerant | Tolerant | |||
| 2013 | Mixer1 | Rosalinda2 | Alexina3 | 7 | 13 | 17 |
| 2014 | Mixer | Rosalinda | Elora | 2 | 4 | 9 |