Pine wilt disease (PWD), one of the most serious forest problems worldwide, originated in North American countries (Dwinell, 1997) spreading to many others during the 20th century. In the U.S.A and Canada, PWD is not considered as a primary pathogen of native pines (Leal et al., 2013), whereas in invasion areas, such as Japan, Korea, China, and Portugal, it exerts serious damage to forest ecosystems (Yun et al., 2012).
In Japan, PWD was first recorded at Nagasaki prefecture, northwestern part of Kyushu, in 1905. During the last century, this disease has been responsible for the yearly loss of 700,000 m3 of pinewood (Mamiya and Shoji, 2009). In China, PWD was first observed in Nanjing in 1982, but it rapidly expanded (Yang, 1995; Zhang and Luo, 2003; Wu, 2004), and over one million hectares of pine forests have died due to PWD (Zhao, 2008). In South Korea, PWD was first identified in the Gumjung Mountain Region of Busan in 1988 (Yi et al., 1989), but it widely spread to 57 cities and prefectures until 2010 (Jung et al., 2010a). In Europe, PWD was first reported in Portugal in 1999 (Mota et al., 1999). During the next decade, nearly 510,000 ha of Portuguese pine forests were destroyed due to PWD (Valadas et al., 2012). By 2008, the disease spread across the country (Rodrigues, 2008) and, more recently, the PWD was detected in Madeira Island, 1000 km southwest of mainland Portugal (Fonseca et al., 2012). PWD has also been detected in Spain (Abelleira et al., 2011; Robertson et al., 2011), and, throughout the world, 44 Pinus species have been infected by PWD under natural conditions (Shi et al., 2013).
The pinewood nematode (PWN), Bursaphelenchus xylophilus, Nickle, 1970 (Steiner and Buhrer, 1934) (Nematoda: Aphelenchoididae), which is a kind of plant parasite, is the causal agent of PWD (Kiyohara and Tokushige, 1971). This nematode can survive in healthy and in dead trees. In healthy host trees, the PWN causes cell destruction leading to host death in a few months (Cardoso et al., 2012). Although it has been listed as a quarantine pest in more than 40 countries (Mota et al., 1999; Schrader and Unger, 2003), the lack of an effective method to inhibit its expansion is still a serious problem worldwide. Because the PWN is present in the logs, lumber, and wooden packaging material used in commercial transportation (Hu et al., 2013), it is difficult to inhibit PWN expansion, except for the transportation performed by its vectors, the beetles within the genus Monochamus. Understanding its transmission routes and dispersal mechanisms could be effective for controlling the propagation of the PWN, especially to uninfected regions (Jung et al., 2010b).
Molecular markers showing sufficient genetic polymorphism are thought to help in understanding the epidemiology of PWD (Jung et al., 2010b), and many studies have focused on PWN population analysis. Cheng et al. (2008) studied the genetic variation during the invasive process of PWN in China and successfully inferred its possible spread routes using amplified fragment length polymorphism (AFLP). Iwahori et al. (1998) used an internal transcribed spacer (ITS)-Restriction Fragment Length Polymorphism (RFLP) map to identify the relationship among Japanese, Chinese, Canadian, and US PWN isolates. Random amplified polymorphic DNA (RAPD)-PCR and ITS-RFLP have been used to examine PWN populations in mainland Portugal (Vieira et al., 2007) and in Madeira Island (Fonseca et al., 2012), respectively. Zhou et al. (2007) reported that microsatellite markers might be useful for studying PWD, and they used such markers to evaluate the genetic structure of PWN populations among and within pine forests. The polymorphism of Japanese PWN isolates from 29 populations sub-cultured in the laboratory and collected from natural pine stands was analyzed based on variations at the heat-shock protein 70 locus (Takemoto and Futai, 2007). All these DNA-based techniques provide an attractive solution for examining PWN populations, despite their limitations: the resolution level of RAPD and RFLP markers is low; few of these markers can be applied to a single PWN individual due to its extremely small body size; and determination of intraspecific variability is difficult because sample sizes are too small (Valadas et al., 2013).
Mitochondrial DNA (mtDNA) is an excellent marker for the study of phylogenetic relationships due to its high copy number in a cell (Valadas et al., 2013). In recent years, mitochondrial genes have been used as markers for intraspecific variation studies in nematodes (Madani et al., 2010). They were employed to investigate genetic relationships among Peruvian and Canadian populations of Globodera pallida (Picard et al., 2007; Plantard et al., 2008; Madani et al., 2010), and the mitochondrial gene cytochrome b (cytb) successfully confirmed the origin of new populations of this species (Plantard et al., 2008). These results suggested that mitochondrial genes might be useful for studying intraspecific variability in the genus Bursaphelenchus. Furthermore, Sultana et al. (2013) reported the whole genome sequence of PWN, thereby providing valid information for studying PWN populations’ variability based on mitochondrial genome sequencing and analysis of its polymorphisms. In addition to reporting the complete mitochondrial genome of PWN, Sultana et al. (2013) also compared the entire mitochondrial genomes of Bursaphelenchus xylophilus and Bursaphelenchus mucronatus (Mamiya and Enda, 1979), and developed a molecular tool to identify these two species. Similarly, Pereira et al. (2013) clarified the intraspecific phylogeny of Bursaphelenchus xylophilus isolates from different world regions and of Bursaphelenchus mucronatus isolates using three mitochondrial genes: cytochrome c oxidase subunit I (cox1), NADH dehydrogenase subunit 5 (nad5), and small subunit ribosomal RNA (rrnS). A previous study also reported the phylogenetic relationships among Bursaphelenchus species inferred from mtDNA and nuclear ribosomal sequence data (Ye et al., 2007).
All the above-mentioned studies suggest that mitochondrial genome information might be a new and efficient tool for examining population genetic variability in PWN. However, PWN mitochondrial genome diversity is not well understood, and using this information to evaluate PWN population diversity has not advanced to date. Thus, in the present study, the partial mitochondrial genome was sequenced for individual PWNs, and the sequence polymorphism and genetic population structure in PWN were investigated in detail.
Materials and methods
Nematode collection and preparation
The nematode samples used in this study were collected from 12 different forests in Kyushu, Japan where PWD was reported from 2012 to 2014 (Fig. 1). Pine chips were obtained from five points in the trunk, using a drill with a diameter of 16 mm. Nematodes were extracted from the chips using the Baermann funnel method (Iwahori and Futai, 1993), cultured on Botrytis cinerea Pers. (1794) grown on barley culture medium, and incubated at 25°C for 10 d to 20 d. After successful rearing, nematodes were removed from the culture medium, and stored in 5-ml tubes containing distilled water, at 4°C until use. Mitochondrial DNA (mtDNA) sequencing was performed for each individual nematode. The number of nematode individuals in each population for which mtDNA sequences were successfully obtained and used in further analysis are listed in Table 1. The number of trees in each population that became the source of the sequenced nematodes are also listed.
Table 1
Summary information for populations in Kyushu.
| Population | Code | Na | No. of treesb | Location | Prefecture | |||||||||||||||||||||||||||
|---|---|---|---|---|---|---|---|---|---|---|---|---|---|---|---|---|---|---|---|---|---|---|---|---|---|---|---|---|---|---|---|---|
| Matsuura | Ma | 23 | 16 | 33.3°N, 129.7°E | Nagasaki | |||||||||||||||||||||||||||
| Karatsu | Ka | 27 | 10 | 33.5°N, 129.9°E | Saga | |||||||||||||||||||||||||||
| Itoshima | It | 25 | 25 | 33.6°N, 130.2°E | Fukuoka | |||||||||||||||||||||||||||
| Yukuhashi | Yu | 14 | 14 | 33.7°N, 131.0°E | Fukuoka | |||||||||||||||||||||||||||
| Chikujo | Ch | 12 | 12 | 33.7°N, 131.1°E | Fukuoka | |||||||||||||||||||||||||||
| Amakusa | Am | 28 | 10 | 32.6°N, 130.4°E | Kumamoto | |||||||||||||||||||||||||||
| Shintomi | Sh | 24 | 20 | 32.1°N, 131.5°E | Miyazaki | |||||||||||||||||||||||||||
| Miyazaki | Mi | 26 | 20 | 31.9°N, 131.4°E | Miyazaki | |||||||||||||||||||||||||||
| North Nichinan | Ni-N | 28 | 4 | 31.6°N, 131.4°E | Miyazaki | |||||||||||||||||||||||||||
| South Nichinan | Ni-S | 27 | 20 | 31.6°N, 131.4°E | Miyazaki | |||||||||||||||||||||||||||
| Sendai | Se | 25 | 20 | 31.8°N, 130.2°E | Kagoshima | |||||||||||||||||||||||||||
| Ibusuki | Ib | 26 | 20 | 31.2°N, 130.6°E | Kagoshima | |||||||||||||||||||||||||||

| Substitution | ||||||||||||||||||||||||||||||||
|---|---|---|---|---|---|---|---|---|---|---|---|---|---|---|---|---|---|---|---|---|---|---|---|---|---|---|---|---|---|---|---|---|
| Sequence polymorphism | Nucleotide | Amino acid residue | ||||||||||||||||||||||||||||||
| Gene/region | Lengtha (bp) | No. Indels | Indels/bpb | No. SNPs | SNPs/bpb | No. Tsc | No. Tvc | Tsc/Tvc ratio | No. Synsd | No. Non-synsd | Synd/Non-synd ratio | |||||||||||||||||||||
| Protein-coding gene | cox1 | 1,156 | 39 | 1/30 | 35 | 4 | 8.8 | 34 | 5 | 6.8 | ||||||||||||||||||||||
| cox2 | 690 | 7 | 1/99 | 7 | 0 | – | 6 | 1 | 6.0 | |||||||||||||||||||||||
| nad3 | 342 | 6 | 1/57 | 5 | 1 | 5.0 | 4 | 2 | 2.0 | |||||||||||||||||||||||
| nad5 | 1,569 | 40 | 1/39 | 30 | 10 | 3.0 | 30 | 9 | 3.3 | |||||||||||||||||||||||
| nad6 | 435 | 13 | 1/33 | 11 | 2 | 5.5 | 11 | 2 | 5.5 | |||||||||||||||||||||||
| nad4L | 234 | 5 | 1/47 | 4 | 1 | 4.0 | 5 | 0 | – | |||||||||||||||||||||||
| nad1 | 873 | 22 | 1/40 | 17 | 5 | 3.4 | 21 | 1 | 21.0 | |||||||||||||||||||||||
| atp6 | 417 | 7 | 1/60 | 5 | 2 | 2.5 | 7 | 0 | – | |||||||||||||||||||||||
| subtotal | 5,716 | 139 | 1/41 | 114 | 25 | 4.6 | 118 | 20 | 5.9 | |||||||||||||||||||||||
| tRNA | trnC | 54 | 1 | 1/54 | 0 | 1 | – | |||||||||||||||||||||||||
| trnM | 54 | 1 | 1/54 | 0 | 1 | – | ||||||||||||||||||||||||||
| trnD | 55 | |||||||||||||||||||||||||||||||
| trnG | 54 | |||||||||||||||||||||||||||||||
| trnH | 55 | |||||||||||||||||||||||||||||||
| trnA | 55 | |||||||||||||||||||||||||||||||
| trnP | 57 | |||||||||||||||||||||||||||||||
| trnV | 57 | |||||||||||||||||||||||||||||||
| trnW | 55 | |||||||||||||||||||||||||||||||
| trnE | 55 | |||||||||||||||||||||||||||||||
| trnS | 55 | 1 | 1/55 | 0 | 1 | – | ||||||||||||||||||||||||||
| trnY | 63 | 1 | 1/63 | |||||||||||||||||||||||||||||
| subtotal | 669 | 1 | 1/669 | 3 | 1/223 | 0 | 3 | – | ||||||||||||||||||||||||
| rRNA | rrnL | 937 | 7 | 1/134 | 4 | 3 | 1.3 | |||||||||||||||||||||||||
| rrnS | 697 | 6 | 1/116 | 3 | 3 | 1.0 | ||||||||||||||||||||||||||
| subtotal | 1,634 | 13 | 1/126 | 7 | 6 | 1.2 | ||||||||||||||||||||||||||
| Non-coding region | cox1-trnC | 15 | 1 | 1/15 | 2 | 1/7.5 | 0 | 2 | – | |||||||||||||||||||||||
| trnC-trnM | 7 | |||||||||||||||||||||||||||||||
| trnM-trnD | 20 | |||||||||||||||||||||||||||||||
| trnD-trnG | 3 | 1 | 1/3 | 1 | 0 | – | ||||||||||||||||||||||||||
| nad3-nad5 | 1 | |||||||||||||||||||||||||||||||
| rrnS-trnS | 4 | |||||||||||||||||||||||||||||||
| subtotal | 50 | 1 | 1/50 | 3 | 1/17 | 1 | 2 | 0.5 | ||||||||||||||||||||||||
| Total | 8,060e | 2 | 1/4030 | 158 | 1/51 | 122 | 36 | 3.4 | 118 | 20 | 5.9 | |||||||||||||||||||||
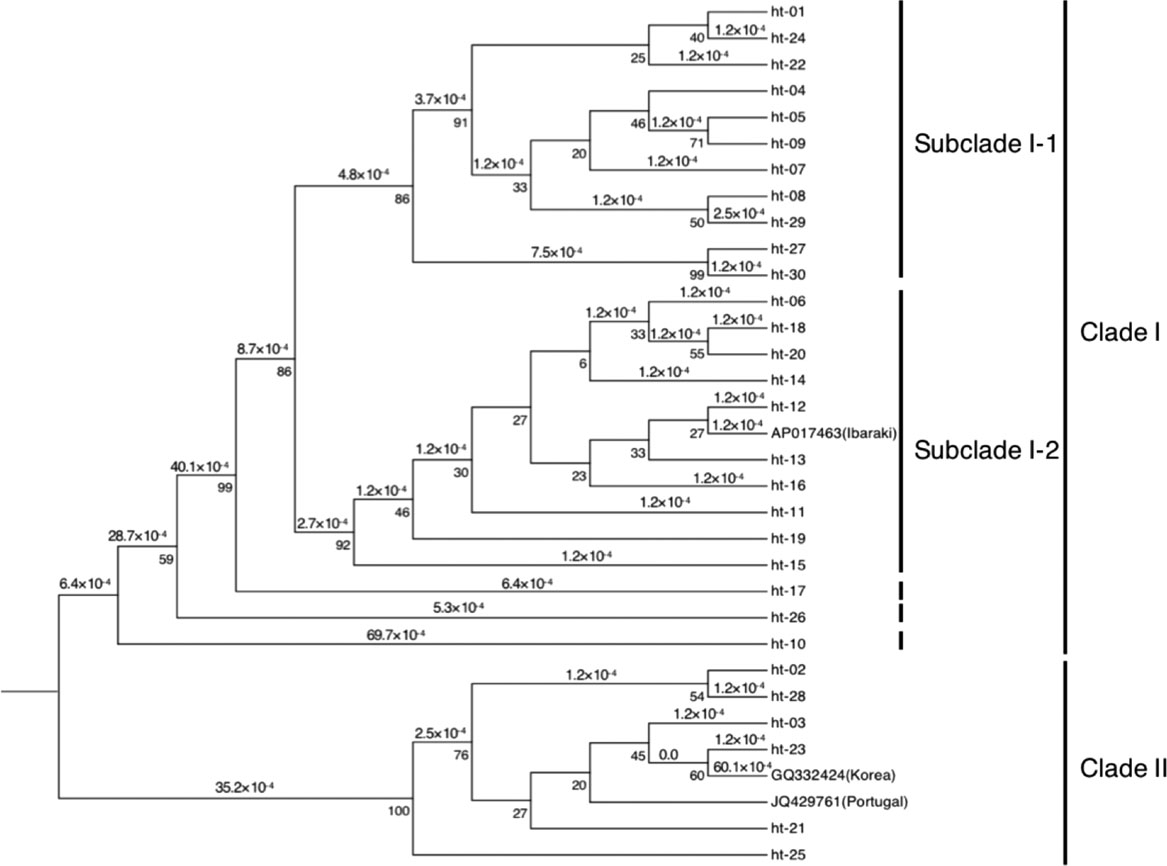
| Haplotype | ||||||||||||||||||||||||||||||||
|---|---|---|---|---|---|---|---|---|---|---|---|---|---|---|---|---|---|---|---|---|---|---|---|---|---|---|---|---|---|---|---|---|
| Population | 01 | 02 | 03 | 04 | 05 | 06 | 07 | 08 | 09 | 10 | 11 | 12 | 13 | 14 | 15 | 16 | 17 | 18 | 19 | 20 | 21 | 22 | 23 | 24 | 25 | 26 | 27 | 28 | 29 | 30 | Nha | Hdb |
| Matsuura | 16 | 3 | 1 | 3 | 4 | 0.50 | ||||||||||||||||||||||||||
| Karatsu | 8 | 3 | 1 | 8 | 2 | 1 | 1 | 3 | 8 | 0.82 | ||||||||||||||||||||||
| Itoshima | 1 | 1 | 20 | 3 | 4 | 0.36 | ||||||||||||||||||||||||||
| Yukuhashi | 6 | 7 | 1 | 3 | 0.60 | |||||||||||||||||||||||||||
| Chikujo | 3 | 1 | 8 | 3 | 0.53 | |||||||||||||||||||||||||||
| Amakusa | 7 | 4 | 2 | 1 | 1 | 1 | 1 | 9 | 2 | 9 | 0.83 | |||||||||||||||||||||
| Shintomi | 8 | 1 | 14 | 1 | 4 | 0.57 | ||||||||||||||||||||||||||
| Miyazaki | 5 | 21 | 2 | 0.32 | ||||||||||||||||||||||||||||
| Nichinan-N | 4 | 21 | 3 | 3 | 0.42 | |||||||||||||||||||||||||||
| Nichinan-S | 10 | 15 | 1 | 1 | 4 | 0.57 | ||||||||||||||||||||||||||
| Sendai | 21 | 2 | 1 | 1 | 4 | 0.30 | ||||||||||||||||||||||||||
| Ibusuki | 9 | 1 | 1 | 4 | 7 | 2 | 1 | 1 | 8 | 0.80 | ||||||||||||||||||||||
| Total | 43 | 12 | 10 | 7 | 1 | 8 | 2 | 1 | 1 | 13 | 1 | 1 | 42 | 8 | 2 | 1 | 1 | 1 | 1 | 10 | 98 | 5 | 1 | 2 | 1 | 1 | 7 | 2 | 1 | 1 | 0.83 | |
| Frequency (%) | 15.1 | 4.2 | 3.5 | 2.5 | 0.4 | 2.8 | 0.7 | 0.4 | 0.4 | 4.6 | 0.4 | 0.4 | 14.7 | 2.8 | 0.7 | 0.4 | 0.4 | 0.4 | 0.4 | 3.5 | 34.4 | 1.8 | 0.4 | 0.7 | 0.4 | 0.4 | 2.5 | 0.7 | 0.4 | 0.4 | ||
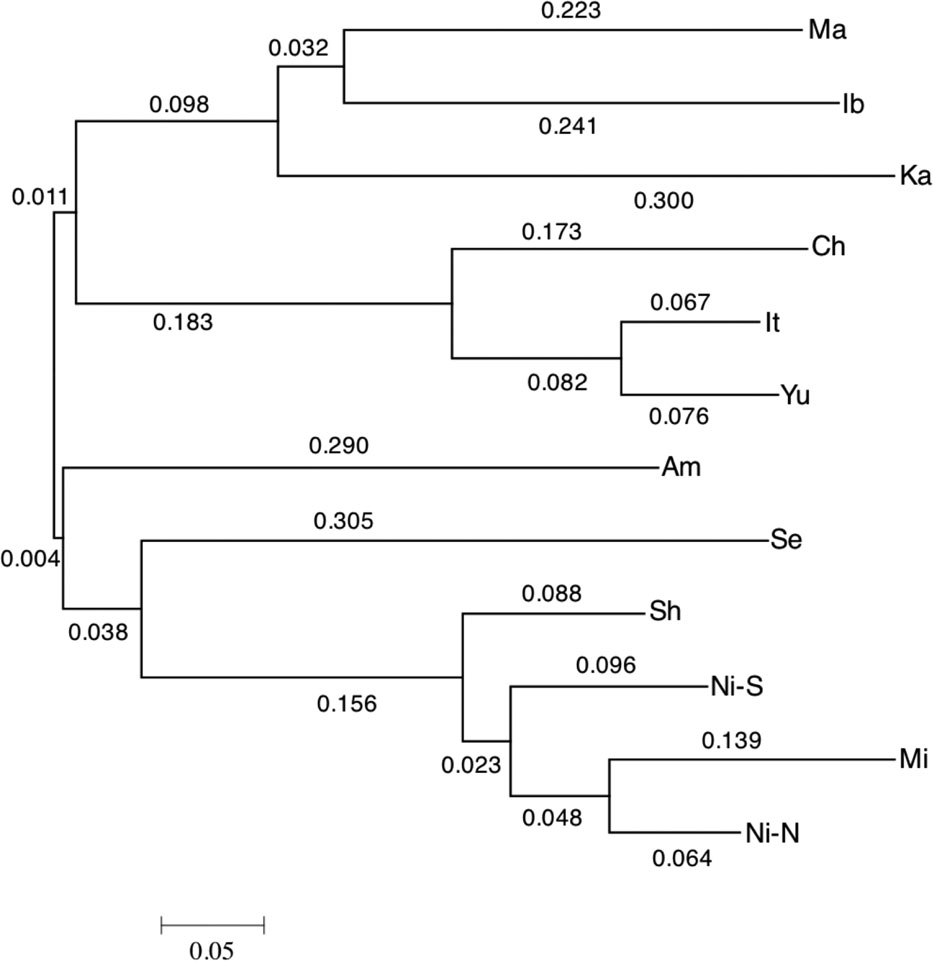
| Population | Ma | Ka | It | Yu | Ch | Am | Sh | Mi | Ni-N | Ni-S | Se |
|---|---|---|---|---|---|---|---|---|---|---|---|
| Matsuura (Ma) | |||||||||||
| Karatsu (Ka) | 0.570 | ||||||||||
| Itoshima (It) | 0.693 | 0.665 | |||||||||
| Yukuhashi (Yu) | 0.703 | 0.738 | 0.144 | ||||||||
| Chikujo (Ch) | 0.703 | 0.714 | 0.367 | 0.288 | |||||||
| Amakusa (Am) | 0.773 | 0.671 | 0.549 | 0.598 | 0.706 | ||||||
| Shintomi (Sh) | 0.560 | 0.771 | 0.693 | 0.703 | 0.703 | 0.465 | |||||
| Miyazaki (Mi) | 0.570 | 0.916 | 0.752 | 0.714 | 0.714 | 0.752 | 0.347 | ||||
| North Nichinan (Ni-N) | 0.549 | 0.809 | 0.703 | 0.693 | 0.693 | 0.673 | 0.144 | 0.203 | |||
| South Nichinan (Ni-S) | 0.560 | 0.752 | 0.693 | 0.703 | 0.703 | 0.652 | 0.223 | 0.347 | 0.144 | ||
| Sendai (Se) | 0.693 | 0.752 | 0.693 | 0.703 | 0.703 | 0.662 | 0.560 | 0.570 | 0.703 | 0.560 | |
| Ibusuki (Ib) | 0.464 | 0.560 | 0.752 | 0.809 | 0.809 | 0.678 | 0.665 | 0.811 | 0.714 | 0.665 | 0.665 |