
Table 1
Monthly total rainfall (mm) at Chinhoyi of Technology farm in Zimbabwe in 2014/15 and 2015/16 cropping seasons.
| Month | 2014/15 (Rainfall in mm) | 2015/16 (Rainfall in mm) |
|---|---|---|
| September | 0 | 0 |
| October | 3.1 | 20.9 |
| November | 22 | 90.9 |
| December | 302.8 | 184.9 |
| January | 339.2 | 53.8 |
| February | 104.9 | 61.8 |
| March | 34.3 | 173.4 |
| April | 38 | 94 |
| May | 0 | 0 |
| June | 0 | 0 |
| July | 0 | 0 |
| August | 0 | 0 |
| Total | 844.3 | 679.7 |
Table 2
Summary of treatments used in the study at Chinhoyi University farm, Zimbabwe, in 2014/15 and 2015/16 cropping seasons.
| Factor | Level of factor | Explanation |
|---|---|---|
| Tillage | Basin planting | Each basin (15 × 15 × 15 cm) was done using hoes. The basins were about 10 cm below the rest of the land after planting |
| Rip line seeding | Marked using a tractor-mounted ripper to a depth of about 15 cm | |
| Conventional tillage | Disc plowed as primary tillage followed by secondary tillage using a disc harrow | |
| Fertilizer regime | Control (no fertilizer) | No fertilizer |
| Micro dosing (low fertilizer) | 100 g of manure per plant position + 80 kg ha−1 compound D fertilizer (8 N: 14 P2O5: 7 K2O) + 80 kg ha−1 ammonium nitrate (34.5% N) (total rate: 35.2 kg ha−1 N: 12.2 kg ha−1 P2O5: 6.6 kg ha−1K2O) | |
| Medium fertilizer rate | 100 kg ha−1 compound D fertilizer (8 N: 14 P2O5: 7 K2O) + 100 kg ha−1 ammonium nitrate (34.5% N) (total rate: 41.5 kg ha-1 N: 14 kg ha−1P2O5: 7 kg ha−1K2O) | |
| High fertilizer rate | 200 kg ha−1 compound D fertilizer (8 N: 14 P2O5: 7 K2O) + 200 kg ha−1 ammonium nitrate (34.5% N) (total rate: 83 kg ha−1 N: 28 kg ha−1 P2O5: 14 kg ha−1 K2O) |
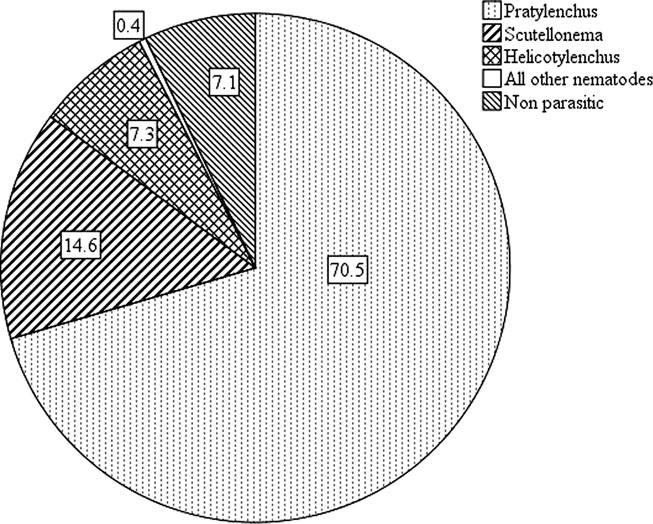
Figure 1.
Percentage composition of total soil and root borne nematodes from soils and roots collected in tillage and fertilizer split plot experiment at Chinhoyi University of Technology farm, Zimbabwe, combined for all time points and treatments in the 2014/15 and 2015/16 seasons.
Table 3
Tillage and fertilizer effects on population density of nematodes recovered from 100 cm3 of soil and 10 g of maize root tissue at Chinhoyi University farm, Zimbabwe, in 2014/15 and 2015/16 cropping seasons.
| Tillage treatments | Fertilizer treatments | ||||||||
|---|---|---|---|---|---|---|---|---|---|
| Basin | Rip | Conv | SED | NF | LF | MF | HF | SED | |
| 2014/15 season | |||||||||
| Soil | |||||||||
| Helicotylenchus sp. | 55b | 30b | 22a | 12.20 | 27 | 42 | 27 | 45 | 14.09 |
| Pratylenchus sp. | 22 | 35 | 40 | 13.59 | 37 | 41 | 28 | 23 | 15.69 |
| Rotylenchulus sp. | 1 | 0 | 0 | 0.32 | 1 | 0 | 0 | 0 | 0.37 |
| Scutellonema sp. | 112b | 78b | 37a | 17.90 | 81 | 78 | 75 | 68 | 20.67 |
| Non- parasitic | 44 | 39 | 38 | 4.583 | 41 | 35 | 40 | 46 | 5.292 |
| Total nematodes | 233b | 182a | 137a | 24.97 | 186 | 197 | 171 | 182 | 28.84 |
| Root | |||||||||
| Pratylenchus sp. | 255 | 302 | 494 | 122.90 | 334 | 428 | 411 | 229 | 141.90 |
| 2015/20 season | |||||||||
| Soil | |||||||||
| Helicotylenchus sp. | 27 | 37 | 19 | 15.73 | 21 | 31 | 36 | 22 | 18.17 |
| Pratylenchus sp. | 19 | 23 | 25 | 6.47 | 23 | 17 | 31 | 19 | 7.47 |
| Rotylenchulus sp. | 3 | 4 | 4 | 3.71 | 4 | 6 | 3 | 1 | 4.28 |
| Scutellonema sp. | 74b | 52b | 21a | 14.58 | 37 | 54 | 54 | 49 | 16.83 |
| Tylenchus | 1 | 0 | 0 | 0.47 | 1 | 0 | 1 | 1 | 0.55 |
| Non- parasitic | 23b | 10a | 21b | 4.91 | 14 | 12 | 23 | 22 | 5.67 |
| Total nematodes | 148b | 126ab | 88a | 29.04 | 1001 | 120 | 147 | 115 | 33.53 |
| Root | |||||||||
| Pratylenchus sp. | 889 | 354 | 917 | 284.40 | 643 | 779 | 638 | 820 | 328.40 |
[i] Means with the same letter within the same row for the same factor (tillage or fertilizer) are not significantly different at P ⩽ 0.05 (mean ± standard error of difference (SED) between means); rip line seeding (rip lines); basin planting (basins); conventional tillage (conv) ); no fertilizer (NF); low fertilizer (LF); medium fertilizer (MF); high fertilizer (HF). Mean separation is only shown if treatment effect was significant based on analysis of variance (P ⩽ 0.05). Means are estimated average values for each cropping season.
Table 4
Tillage and fertilizer effects on population density of different nematode feeding site groups recovered from 100 cm3 of soil and 10 g of maize roots at Chinhoyi University farm, Zimbabwe, in 2014/15 and 2015/16 cropping seasons.
| Tillage treatments | Fertilizer treatments | ||||||||
|---|---|---|---|---|---|---|---|---|---|
| Basin | Rip | Conv | SED | NF | LF | MF | HF | SED | |
| 2014/15 season | |||||||||
| Soil | |||||||||
| Sedentary endoparasites | 1 | 0 | 0 | 0.31 | 1 | 0 | 0 | 0 | 0.36 |
| Migratory endoparasites | 22 | 35 | 40 | 13.59 | 37 | 41 | 28 | 23 | 15.69 |
| Semi-endoparasites | 167b | 108b | 59a | 25.42 | 108 | 121 | 103 | 114 | 29.35 |
| Ectoparasites | 0 | 0 | 0 | 0.18 | 0 | 0 | 0 | 0 | 0.21 |
| Root | |||||||||
| Migratory endoparasites | 255 | 302 | 494 | 122.90 | 334 | 428 | 411 | 229 | 141.90 |
| Semi-endoparasites | 1 | 0 | 1 | 1.04 | 12 | 0 | 0 | 0 | 1.20 |
| 2015/16 season | |||||||||
| Soil | |||||||||
| Algal feeders | 1 | 0 | 0 | 0.47 | 1 | 0 | 1 | 1 | 0.55 |
| Sedentary endoparasites | 3 | 4 | 4 | 3.71 | 4 | 6 | 3 | 1 | 4.28 |
| Migratory endoparasites | 19 | 23 | 25 | 6.47 | 23 | 17 | 31 | 19 | 7.471 |
| Semi-endoparasites | 105b | 92b | 43a | 24.58 | 63 | 91 | 93 | 73 | 28.38 |
| Root | |||||||||
| Migratory endoparasites | 889 | 354 | 917 | 284.40 | 643 | 779 | 638 | 820 | 328 |
[i] Means with the same letter within the same row for the same factor (tillage or fertilizer) are not significantly different at P ⩽ 0.05 (mean ± standard error of difference (SED) between means); rip line seeding (rip lines); basin planting (basins); conventional tillage (conv); no fertilizer (NF); low fertilizer (LF); medium fertilizer (MF); high fertilizer (HF). Mean separation is only shown if treatment effect was significant based on analysis of variance (P ⩽ 0.05). Means are estimated average values for each cropping season.
Table 5
Mean plant-parasitic diversity across different tillage and fertilizer treatments at Chinhoyi University farm, Zimbabwe, in 2014/15 and 2015/16 cropping seasons.
| Basin | Rip | Conv | SED | NF | LF | MF | HF | SED | |
|---|---|---|---|---|---|---|---|---|---|
| 2014/15 season | |||||||||
| Evenness index | 0.62 | 0.65 | 0.60 | 0.03 | 0.62 | 0.63 | 0.64 | 0.61 | 0.03 |
| Richness index | 5.08b | 4.64a | 4.97ab | 0.13 | 4.74 | 5.04 | 4.82 | 5.00 | 0.15 |
| Shannon index | 1.12 | 1.07 | 1.06 | 0.05 | 1.04 | 1.12 | 1.10 | 1.08 | 0.06 |
| 2015/16 season | |||||||||
| Evenness index | 0.66 | 0.66 | 0.71 | 0.02 | 0.67 | 0.66 | 0.68 | 0.68 | 0.03 |
| Richness index | 5.33 | 5.21 | 5.17 | 0.19 | 5.17 | 5.11 | 5.28 | 5.39 | 0.22 |
| Shannon index | 1.23 | 1.21 | 1.29 | 0 | 1.2 | 1.2 | 1.3 | 1.3 | 0 |
[i] Means with the same letter within the same row for the same factor (tillage or fertilizer) are not significantly different at P ⩽ 0.05 (mean ± standard error of difference (SED) between means); rip line seeding (rip lines); basin planting (basins); conventional tillage (conv) ); no fertilizer (NF); low fertilizer (LF); medium fertilizer (MF); high fertilizer (HF). Mean separation is only shown if treatment effect was significant based on analysis of variance (P ⩽ 0.05). Means are estimated average values for each cropping season.
Table 6
Mean maize grain yield in kg ha−1 as affected by tillage and fertilizer treatments at Chinhoyi University farm, Zimbabwe, in 2014/15 and 2015/16 cropping seasons.
| Tillage treatments | Fertilizer treatments | ||||||||
|---|---|---|---|---|---|---|---|---|---|
| Cropping season | Basins | Rip | Conv | SED | NF | LF | MF | HF | SED |
| 2014/15 | 6,846b | 6,449b | 3,697a | 1,041.84 | 5,022 | 6,200 | 5,459 | 5,975 | 709.90 |
| 2015/16 | 9,672c | 7,463b | 4,580a | 635.33 | 5,945 | 7,755 | 7,842 | 7,412 | 1,048.66 |
[i] Means with the same letter within the same row for the same factor (tillage or fertilizer) are not significantly different at P ⩽ 0.05 (mean ± standard error of difference (SED) between means); rip line seeding (rip lines); basin planting (basins); conventional tillage (conv) ); no fertilizer (NF); low fertilizer (LF); medium fertilizer (MF); high fertilizer (HF). Mean separation is only shown if treatment effect was significant based on analysis of variance (P ⩽ 0.05). Means are estimated average values for each cropping season. Nematode counts were used as a covariate.
Table 7
Correlation (Pearson r) between maize grain yield and plant-parasitic nematode population in the soil and on roots (log (x + 2.5)−transformed) before planting and 120 d after crop emergence at Chinhoyi University farm, Zimbabwe, in 2014/15 and 2015/16 cropping seasons.
| Sampling time point | Pratylenchus | Scutellonema | Helicotylenchus | Total nematode |
|---|---|---|---|---|
| 2014/15 cropping season | ||||
| Pre-planting | −0.19 | 0.23 | 0.51** | 0.37* |
| 120 DAE | 0.04 | 0.19 | 0.03 | 0.27 |
| 2015/16 cropping season | ||||
| Pre-planting | −0.14 | 0.24 | 0.19 | 0.26 |
| 120 DAE | −0.03 | 0.06 | −0.11 | −0.03 |
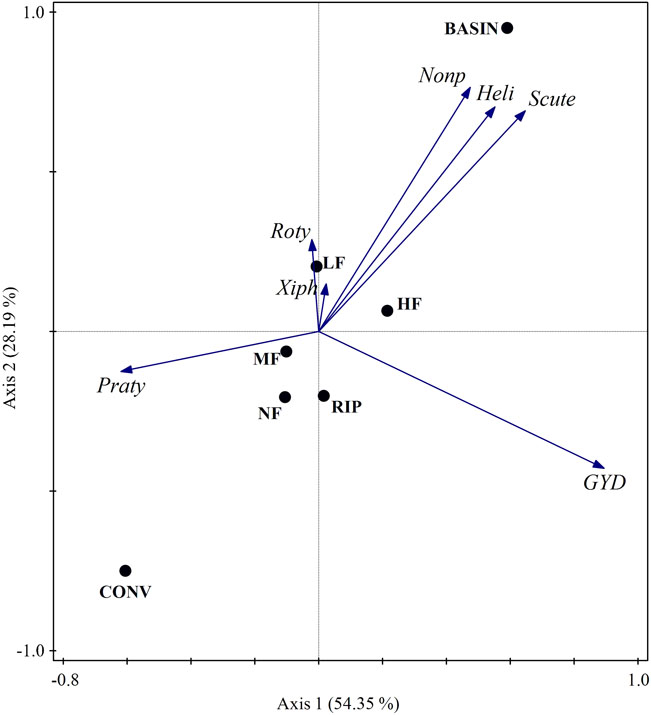
Figure 2.
Biplot representing the principal component analysis (PCA) performed on nematodes assemblages (Heli (Helicotylenchus), Nonp (non-plant-parasitic nematodes), Scute (Scutellonema), Roty (Rotylenchulus), Xiph (Xiphinema), Tyle (Tylenchus), Trich (Trychodorus), Melo (Meloidogyne), and Praty (Pratylenchus)) and maize grain yield (GYD) collected from 36 plots that were subjected to three tillage systems (basin NT (BASIN), rip line NT (RIP), and conventional tillage (CONV)) and four fertilizer regimes (no-fertilizer (NF), micro dosing (LF), medium fertilizer (MF), and high fertilizer (HF)) at Chinhoyi University farm, Zimbabwe, in 2014/15 cropping season. Treatments are depicted using arrows while nematodes are depicted with dots.
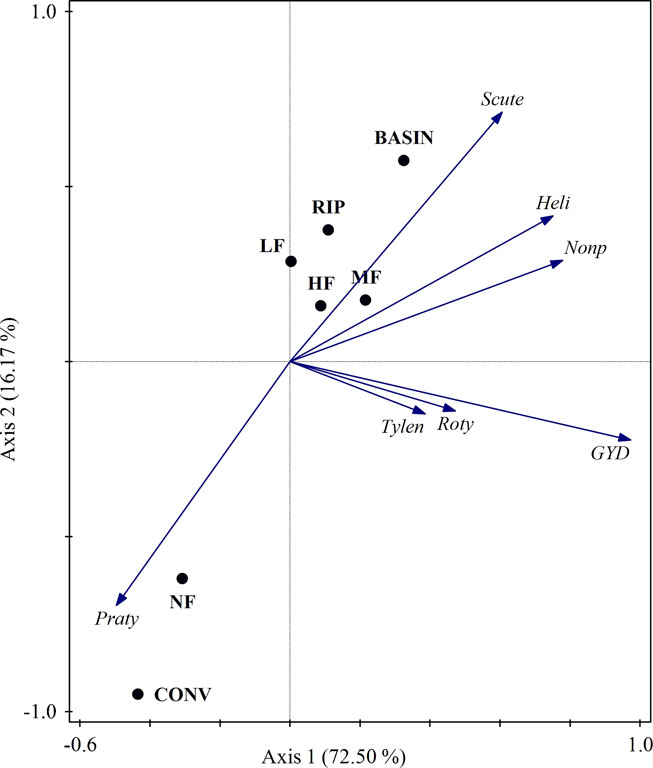
Figure 3
. Biplot representing the principal component analysis (PCA) performed on nematodes assemblages (Heli (Helicotylenchus), Nonp (non-plant-parasitic nematodes), Scute (Scutellonema), Roty (Rotylenchulus), Tylen (Tylenchus), and Praty (Pratylenchus)) and maize grain yield (GYD) collected from 36 plots that were subjected to three tillage systems (basin NT (BASIN), rip line NT (RIP), and conventional tillage (CONV)) and four fertilizer regimes (no-fertilizer (NF), micro dosing (LF), medium fertilizer (MF), and high fertilizer (HF)) at Chinhoyi University farm, Zimbabwe, averaged across all sampling points in 2015/16 cropping season. Treatments are depicted using arrows while nematodes are depicted with dots.