
Table 1
Germplasm lines of Citrullus amarus (CA) and watermelon cultivars (Citrullus lanatus; CL) used in this study.
| Watermelon germplasm line/cultivar | Parental PI of germplasm line | Citrullus spp. |
|---|---|---|
| W2001 | PI 482303 | CA |
| W1832 | PI 189225 | CA |
| W1849 | PI 482324 | CA |
| W1254 | PI 244017 | CA |
| W1446 | PI 244018 | CA |
| W1813 | PI 482319 | CA |
| W1482 | PI 482259 | CA |
| Charleston Gray | CL | |
| Crimson Sweet | CL |
Table 2
List of metabolites identified in Citrullus amarus or Citrullus lanatus by using 1D 1H and 2D 1H–13C-NMR spectroscopy. All chemical shifts for H–C pairs in each metabolite are given with bold chemical shifts corresponding to the peaks labeled in the 1D 1H noesy and 2D 1H–13C HSQC spectra shown in figure x. Un-bold chemical shift estimations are given for H–C pairs that were not identified in the spectra due to overlap with other peaks or noise.
| No. | Metabolite | 1H chemical shifts (ppm) (functional group or specific H, multiplicity of peak) | 13C chemical shifts (ppm) (functional group or specific C) |
|---|---|---|---|
| 1 | 4-Aminobutyrate | 1.92 (2CH2); 2.30 (1CH2); 3.02 (3CH2) | 26.6 (2CH2); 37.2 ( 1CH2);42.0 (3CH2) |
| 2 | 2-Oxoglutarate | 2.50 (1CH2, t); 3.02 (2CH2, t) | 33 (1CH2); 39 (2CH2) |
| 3 | Acetate | 1.92 (CH3, s) | 26 (CH3) |
| 4 | Alanine | 1.48 (Hβ,d); 3.8 (Hα,q) | 19.0 (Cβ); 53 (Cα) |
| 5 | Arginine | 3.25 (Hδ,t); 1.66, 1.74 (Hγ,m); 1.92 (Hβ,m); 3.8 (Hα,t) | 43 (Cδ); 27 (Cγ); 30 (Cβ); 57 (Cα) |
| 6 | Asparagine | 2.87, 2.96 (Hβ,dd); 4.0 (Hα,q) | 37.5 (Cβ); 54 (Cα) |
| 7 | Aspartate | 2.70, 2.82 (Hβ,dd); 3.90 (Hα,q) | 39.4 (Cβ); 55.1 (Cα) |
| 8 | Betaine | 3.27 (CH3, s); 3.91 (CH2, s) | 56 (CH3); 69 (CH2) |
| 9 | Choline | 3.21 (CH3, s); 3.52 (1CH2, m); 4.07 (2CH2, m) | 56.8 (CH3); 70.3 (1CH2); 58.5 (2CH2) |
| 10 | Ethanolamine | 3.15 (1CH2, t); 3.8 (2CH2, t) | 44.1 (1CH2, t); 60 (2CH2, t); |
| 11 | Formate | 8.46 (CH, s) | 174 (CH) |
| 12 | Fructose | 3.57, 3.72 (1CH2, dd); 3.70, 4.03 (6CH2, dd); 3.80 (3CH, d); 3.8,4.00 (5CH, d); 3.90, 4.12 (4CH, t) | 65.3 (1CH2); 66.2 (6CH2); 70.5 (3CH); 70 (5CH); 72.5 (4CH) |
| 13 | Glucose | 3.25 (2βCH, dd), 3.41 (4CH, dd); 3.47 (5βCH, m); 3.50 (3βCH, t); 3.54 (2αCH, dd); 3.72 (3αCH, t); 3.73 (6βCH2, dd), 3.84 (5αCH, m); 3.90 (6αCH2, dd); 4.65 (1αCH, d); 5.24 (1βCH,d) | 77.0 (2βCH); 72.5 (4CH); 78.8 (5βCH); 78.7 (3βCH); 74.3 (2αCH); 75.7 (3αCH); 63.7 (6CH); 74.4 (5αCH); 98.8 (1αCH); 94.9 (1βCH) |
| 14 | Glutamate | 2.07, 2.14 (Hβ,m); 2.36 (Hγ,m); 3.76 (Hα,t) | 29.8 (Cβ); 36.4 (Cγ); 57.4 (Cα) |
| 15 | Glutamine | 2.16 (Hβ,m); 2.5 (Hγ,m); 3.78 (Hα,t) | 29.1 (Cβ); 34 (Cγ); 57.2 (Cα) |
| 16 | Guanidoacetate | 3.79 (CH2, s) | 46.3 (CH2, s) |
| 17 | Histamine | 3.0 (2CH2, t);3.3 (1CH2, t); 7.10 (2CH, s); 7.86(1CH,s) | 26 (2CH2, t); 41(1CH2, t); 120 (2CH, s); 140 (1CH,s) |
| 18 | Histidine | 3.2, 3.2 (Hβ,dd); 4.0 (Hα,t); 7.10 (Hδ,s); 7.84 (Hε,s) | 31 (Cβ); 58 (Cα); 120 (Cδ); 139 (Cε) |
| 19 | Isoleucine | 0.94 (Hδ,t), 1.02 (Hγ,d); 1.2, 1.5 (Hγ,m); 2.0 (Hβ,m); 3.7 (Hα,d) | 14.0 (Cδ); 17, 6 (Cγ); 39 (Cβ); 62 (Cα) |
| 20 | Lactate | 1.33 (CH3, d); 4.1 (CH, q) | 22.3 (CH3); 71 (CH) |
| 21 | Leucine | 0.96, 0.97 (Hδ,d); 1.7 (Hγ,m); 1.7 (Hβ,m); 3.7 (Hα,m) | 23.8, 24.8 (Cδ); 27 (Cγ); 43 (Cβ); 56 (Cα) |
| 22 | Lysine | 1.4 (Hγ,m); 1.73 (Hδ,m); 1.92 (Hβ,m);3.03 (Hε,t); 3.7 (Hα,t) | 24 (Cγ); 29.3 (Cδ); 32.7 (Cβ); 42.0 (Cε); 57 (Cα) |
| 23 | Malate | 2.37, 2.67 (CH2, dd); 4.30 (CH, dd) | 45.5 (CH2); 73.3 (CH) |
| 24 | Malonate | 3.15 (CH2, s) | 50 (CH2) |
| Methanol (contaminant) | 3.36 (CH3, s) | 51 (CH3, s) | |
| 25 | Oxalacetate | 2.41 (CH2, s) | 28.4 (CH2) |
| 26 | Phenylalanine | 3.12, 3.29 (Hβ,dq); 3.9 (Hα,q); 7.34 (Hδ,d); 7.39 (Hζ ,t); 7.43 (Hε,t) | 42 (Cβ); 60 (Cα); 132 (Cδ); 131 (Hζ,t); 132 (Hε,t); |
| 27 | Pyroglutamate | 2.04, 2.51 (Hβ,m); 2.41 (Hγ,t); 4.18 (Hα,q) | 28.2 (Cβ);32.5(Cγ); 61.2 (Cα) |
| 28 | Raffinosea | 5.44 (1′CH, d); 5.00 (1″CH, d)00 | 95.0 (1′CH); 101.00 (1″CH) |
| 29 | Sarcosine | 2.76 (CH3 , s); 3.6 (CH2, s) | 35 (CH3); 53 (CH2, s) |
| 30 | Succinate | 2.40 (CH2, s) | 37.1 (CH2) |
| 31 | Sucrose | 3.49 (3CH, t); 3.6 (2CH, dd); 3.69 (1′CH2, s); 3.77 (4CH, t); 3.85 (5CH, m); 3.83 (6,6′CH2, m); 3.90 (5′CH, m); 4.06 (4′CH, t); 4.23 (3′CH, d); 5.42 (1CH, d) | 72.2 (3CH); 74 (2CH); 64.3 (1′CH2); 75.6 (4CH); 75.3 (5CH); 65.4 (6,6′CH2); 84.2 (5′CH); 76.9 (4′CH); 79.4 (3′CH); 94.9 (1CH) |
| 32 | Tartrate | 4.35 (CH, s) | 77 (CH) |
| 33 | Threonine | 1.33 (Hγ,d); 4.3 (Hβ,m); 3.6 (Hα,d) | 22.3 (Cγ); 69 (Cβ); 63 (Cα) |
| 34 | Trimethylamine functional groupb | 3.22 (CH3, s); 3.225 (CH3, s); 3.23 (CH3, s) | 56.9 (CH3) |
| 35 | Tyrosine | 3.07, 3.18 (Hβ,dq); 3.9 (Hα,q); 6.91 (Hε,d); 7.20 (Hδ,d) | 42 (Cβ); 60 (Cα);120 (Cε); 134 (Cδ) |
| 36 | Valine | 1.00, 1.05 (Hγ,d); 2.3 (Hβ,m); 3.6 (Hα,d) | 19.6, 20.8 (Cγ); 32 (Cβ); 63 (Cα) |
[i] aThe full list of chemical shifts for the trisaccharide raffinose is not listed here; however, the assignment was based on the values of the two characteristic anomeric carbons of the two 6-membered rings; bThe chemical shifts listed are for the trimethylamine group of metabolites such as o-acetylcholine, o-phosphocholine, carnitine, sn-glycero-3-phosphocholine, etc.
Table 3
Consensus of metabolites that have significantly higher concentrations in the Citrullus amarus PIs compared with the Citrullus lanatus cultivars.
| CA PI versus cultivars |
|---|
| 4-Aminobutyrate |
| Alanine |
| Arginine |
| Asparagine |
| Ethanolamine |
| Formate |
| Fructose |
| Glutamate |
| Glutamine |
| Isoleucine |
| Succinate/oxalacetate |
| Unk 6.14 |
| Unk 7.64 |
| Unk 7.68 |
| Valine |
Table 4
Statistical analysis and significance levels of metabolic change in Citrullus amarus PIs as compared with Citrullus lanatus Crimson Sweet (CSW) and Charleston Gray (CG).
| Statistical Parameter | 1254 vs. CSW | 1446 vs. CSW | 1482 vs. CSW | 1813 vs. CSW | 1832 vs. CSW | 1849 vs. CSW | 2001 vs. CSW |
| D M | 4.43 | 4.17 | 4.57 | 3.76 | 7.35 | 14.94 | 2.43 |
| F-true | 26.48 | 23.49 | 28.24 | 19.09 | 72.91 | 301.50 | 7.95 |
| F-critical | 4.96 | 4.96 | 4.96 | 4.96 | 4.96 | 4.96 | 4.96 |
| Significance status | Yes | Yes | Yes | Yes | Yes | Yes | Yes |
| Statistical Parameter | 1254 vs. CG | 1446 vs. CG | 1482 vs. CG | 1813 vs. CG | 1832 vs. CG | 1849 vs. CG | 2001 vs. CG |
| D M | 6.19 | 3.41 | 4.12 | 5.51 | 7.14 | 4.90 | 5.27 |
| F-true | 51.74 | 15.73 | 22.93 | 41.02 | 68.76 | 32.37 | 37.48 |
| F-critical | 4.96 | 4.96 | 4.96 | 4.96 | 4.96 | 4.96 | 4.96 |
| Significance status | Yes | Yes | Yes | Yes | Yes | Yes | Yes |
Table 5
Significantly different metabolites in each of the Citrullus amarus PIs when compared with Citrullus lanatus Charleston Gray (CG), respectively Crimson Sweet (CSW).
| 1832 | 1254 | 1849 | 1813 | 1446 | 1482 | 2001 | |
|---|---|---|---|---|---|---|---|
| Metabolites with higher concentrations in resistant linesa | Crimson Sweet (CSW), Fold Change or Charleston Grey (CG), Fold Change | ||||||
| 2-oxoglutarate + 4-aminobutyrate | – | – | – | – | – | CSW 6.27 | – |
| 4-aminobutyrate | – | – | CSW 5.42 | – | – | – | CSW 6.23 CG 1.66 |
| Alanine | CSW 3.14 | – | CSW 4.53 CG 4.56 | – | CSW 2.11 | CSW 4.02 CG 1.53 | CSW 4.43 CG 1.78 |
| Arginine | CSW 3.4 CG 2.50 | – | – | – | – | – | – |
| Asparagine | CSW 47.72 CG 21.47 | – | – | – | – | – | – |
| Betaine | CSW 5.87 | – | – | – | – | – | – |
| Choline | CSW 2.86 CG 1.76 | – | CSW 2.40 CG 1.50 | – | CSW 1.63 | – | CSW 2.32 CG 1.41 |
| Ethanolamine | CSW 5.77 CG 1.86 | – | CSW 4.11 | – | – | – | CSW 3.77 |
| Formate | – | – | – | – | CSW 2.51 CG 3.07 | – | – |
| Fructose | – | CSW 2.83 CG 1.97 | CSW 2.38 CG 1.85 | – | CSW 2.36 | CSW 3.83 CG 2.33 | CSW 2.79 CG 1.71 |
| Glucose | CSW 4.28 | CSW 2.19 | CSW 2.10 | – | CSW 1.87 | CSW 2.82 CG 1.37 | CSW 3.81 CG 1.26 |
| Glutamate | CG 2.29 | – | CSW 15.60 | – | – | – | CSW 26.02 |
| Glutamine | CSW 5.17 CG 3.09 | – | CSW 6.77 CG 5.40 | – | CSW 3.81 CG 2.32 | CSW 3.81 CG 2.22 | CSW 3.14 CG 2.18 |
| Isoleucine | CG 2.59 | – | CSW 7.18 | – | – | – | CSW 8.73 CG 2.55 |
| Lysine | – | – | – | – | – | – | CG 14.09 |
| Malate | – | CSW 20.6 CG 1.75 | CSW 2.47 | CSW 3.58 | CSW 21.94 CG 1.97 | CSW 9.79 CG 1.61 | – |
| Malonate + ethanolamine | – | – | – | – | – | CSW 2.29 | – |
| Multipleb | CSW 2.27 | – | CSW 2.16 | – | – | – | CSW 2.37 |
| Raffinose | – | – | – | – | – | – | CSW 2.60 CG 2.22 |
| Succinate | – | CSW 1.94 | – | – | CSW 3.23 CG 2.04 | – | – |
| Succinate/Oxalacetate | – | – | CSW 1.92 | – | – | CSW 1.89 | – |
| Sucrose | – | – | – | – | – | CG 2.96 | CSW 4.04 CG 3.67 |
| Sucrose/Choline | – | – | – | – | – | CSW 2.95 | – |
| Tartaric acid | – | – | – | – | – | CSW 2.20 | – |
| Trimethylamine functional group | CG 2.72 | – | CG 1.30 | CSW 1.86 | CG 1.71 | ||
| UNK at 1.22 | – | – | CSW 1.88 | – | – | – | – |
| UNK at 6.41 | CG 5.07 | – | CSW 7.34 CG 7.49 | CSW 5.94 CG 6.12 | – | CSW 5.05 CG 4.92 | CSW 4.94 CG 5.05 |
| UNK at 7.64 | CSW 4.28 CG 5.40 | – | CSW 7.08 CG 8.24 | CG 4.82 | – | CSW 4.20 CG 5.00 | CSW 4.32 CG 5.52 |
| UNK at 7.68 | CG 3.61 | – | CSW 2.08 CG 3.49 | CSW 4.89 CG 4.12 | CSW 1.91 | CG 2.21 | CG 3.02 |
| Valine | CSW 9.94 CG 3.58 | – | CSW 9.47 | – | – | CSW 5.33 CG 3.07 | CSW 10.22 CG 2.59 |
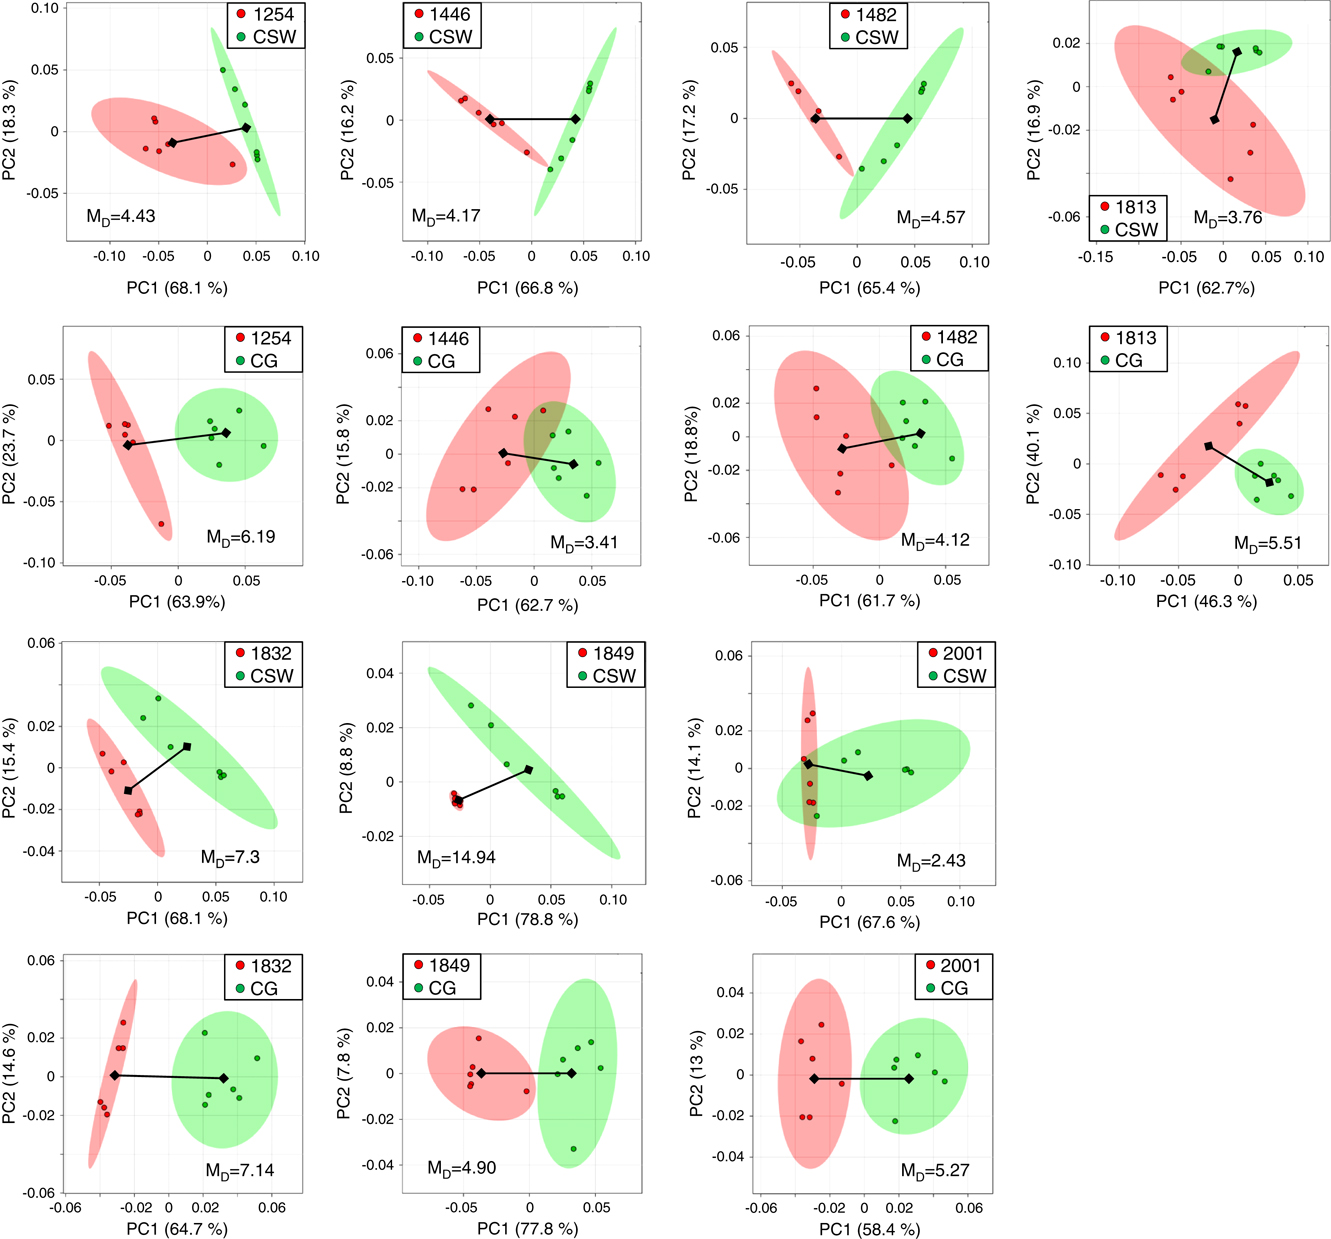
Fig. 1
Pair-wise comparison between Citrullus amarus PIs and Citrullus lanatus Charleston Gray (CG), respectively Crimson Sweet (CSW). PC1 vs. PC2 score plots are shown for each pairwise comparison with a total explained variance of >70% for each. The ovals represent 95% confidence intervals, and the Mahalanobis distances (M D) are listed for each.
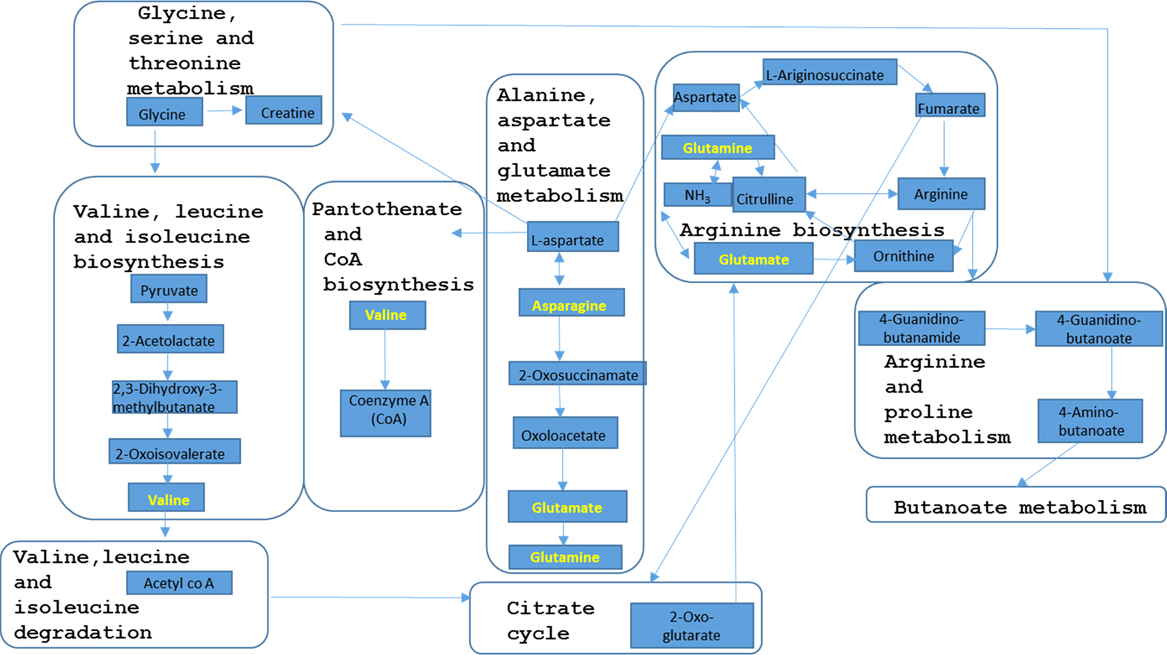
Fig. 2
Pathway analysis using significantly different metabolites involved 9 metabolic pathways (shown inside rounded boxes). Yellow highlighted metabolites correspond to those listed in Table 3.
Supplemental Fig. 1
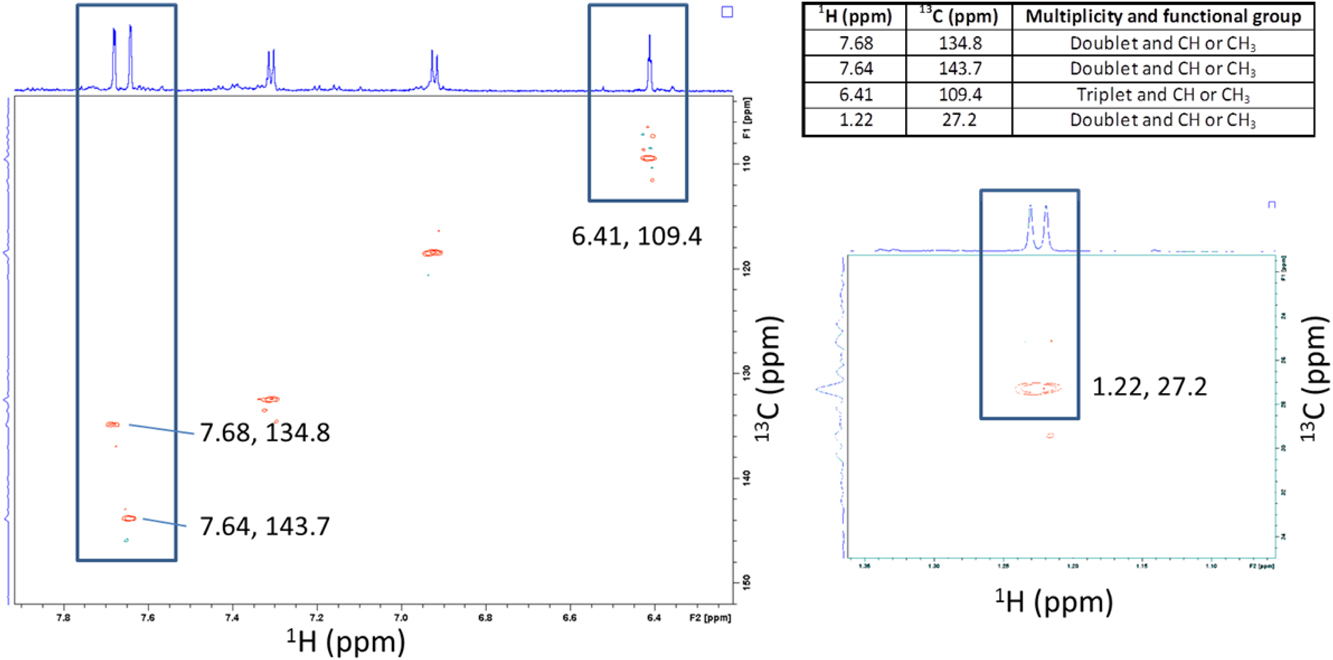
Unknown peak assignments using one dimensional 1H and two dimensional 1H–13C HSQC NMR. The 1H spectrum is shown in blue and is at the top of the 1H–13C HSQC shown with red contour points. Each contour point of the HSQC represents a hydrogen directly bounded to a carbon. This specific HSQC experiment shows red contour points for CH or CH3 correlations and green contour points for CH2 correlations.