
Table 1
Soybean cultivar planted at each soybean field, crop history, and selected soil chemical and physical properties of each field where plant-parasitic nematodes from roots and rhizosphere soil samples were collected during the 2011/12 and 2012/13 growing seasons.
| Soil chemical properties | Soil physical properties | ||||||||||||
| Sampling season | Locality | Ecosystem and cultivar | Crop history | pH (H2O) | Ca | Mg | K | Na | P | % Sand | % Silt | % Clay | % total C |
| 2011/12 and 2012/13 | Bothaville | Glyphosate-tolerant soybean (PAN1664R) | Maize/Sunflower | 6.48 | 381 | 107 | 205 | 0.5 | 204 | 94.7 | 0.7 | 4.6 | 0.21 |
| 2012/13 | Glyphosate-tolerant soybean (PAN1664R) | Maize/Sunflower | 6.48 | 437 | 81 | 170 | 0.5 | 170 | 94.5 | 0.7 | 4.8 | 0.10 | |
| 2011/12 and 2012/13 | Conventional soybean (Egret) | Maize/Sunflower | 6.89 | 581 | 81 | 246 | 1 | 166 | 92.6 | 0.7 | 6.7 | 0.23 | |
| 2012/13 | Conventional soybean (Egret) | Maize/Sunflower | 6.43 | 374 | 96 | 203 | 0.5 | 203 | 94.6 | 0.7 | 4.7 | 0.22 | |
| 2011/12 and 2012/13 | Natural vegetation (grass) | 6.77 | 446 | 78 | 194 | 0.5 | 169 | 94.5 | 0.7 | 4.7 | 0.21 | ||
| 2011/12 and 2012/13 | Natural vegetation (grass) | 6.06 | 574 | 165 | 400 | 5 | 252 | 89.6 | 3.4 | 7 | 1.5 | ||
| 2011/12 and 2012/13 | Brits | Glyphosate-tolerant soybean (PAN1583R) | Maize/Sunflower | 7.28 | 1,434 | 304 | 497 | 2 | 500 | 79.9 | 5.5 | 14.6 | 1.36 |
| 2011/12 and 2012/13 | Conventional soybean (Egret) | Soybean/Wheat | 7.49 | 1,699 | 346 | 291 | 58.5 | 399. | 81.4 | 7.6 | 11 | 0.76 | |
| 2011/12 and 2012/13 | Natural vegetation (grass) | 7.11 | 2,840 | 559 | 417 | 91.5 | 509 | 58.3 | 12.4 | 29.2 | 1.51 | ||
| 2011/12 and 2012/13 | Natural vegetation (grass) | 7.6 | 3,206 | 636 | 342 | 98 | 53 | 74.1 | 9.1 | 16.8 | 3.95 | ||
| 2012/13 | Edenville | Glyphosate-tolerant soybean (PAN1664R) | Soybean | 6.15 | 1,486 | 401 | 419 | 60.5 | 40 | 59.3 | 19.1 | 21.6 | 0.20 |
| 2012/13 | Conventional soybean (Superboon) | Soybean | 4.97 | 512 | 213 | 292 | 9.5 | 118 | 70.7 | 9.3 | 20 | 0.49 | |
| 2012/13 | Natural vegetation (grass) | 5.92 | 396 | 67 | 268 | 3 | 93 | 85.9 | 3.4 | 10.7 | 3.89 | ||
| 2012/13 | Natural vegetation (grass) | 5.64 | 222 | 52 | 271 | 1.5 | 86 | 86.6 | 3.2 | 10.1 | 0.34 | ||
| 2011/12 and 2012/13 | Marble Hall | Glyphosate-tolerant soybean (PAN1454R) | Maize/Soybean | 6.09 | 666 | 228 | 390 | 20 | 402 | 84.9 | 6.7 | 8.4 | 0.56 |
| 2012/13 | Glyphosate-tolerant soybean (LS6164R) | Maize/Soybean | 6.64 | 541 | 149 | 146 | 23 | 118 | 91 | 3.7 | 5.1 | 0.84 | |
| 2012/13 | Glyphosate-tolerant soybean (LS6164R) | Maize/Soybean | 6.07 | 826 | 212 | 291 | 176 | 336 | 88.7 | 3.7 | 7.6 | 0.40 | |
| 2011/12 and 2012/13 | Conventional soybean (Egret) | Soybean | 7.05 | 1,001 | 402 | 390 | 34.5 | 67 | 78.6 | 8.7 | 12.7 | 0.58 | |
| 2012/13 | Conventional soybean (MC555) | Soybean | 6.62 | 1,012 | 244 | 509 | 14.5 | 156 | 91.2 | 3.7 | 5.1 | 1.76 | |
| 2011/12 and 2012/13 | Natural vegetation (grass) | 6.83 | 968 | 238 | 346 | 35.5 | 151 | 69.2 | 9.3 | 21.5 | 1.8 | ||
| 2011/12 and 2012/13 | Natural vegetation (grass) | 6.52 | 455 | 104 | 192 | 24.5 | 164 | 86.1 | 1.4 | 12.6 | 0.54 | ||
| 2011/12 and 2012/13 | Natural vegetation (grass) | 5.93 | 810 | 121 | 375 | 25 | 419 | 83.7 | 3.8 | 12.5 | 2.54 | ||
| 2012/13 | Viljoens-kroon | Glyphosate-soybean tolerant (PAN1583R) | Maize/Soybean | 6.82 | 381 | 96 | 330 | 5 | 295 | 94.1 | 1.2 | 4.7 | 0.2 |
| 2012/13 | Natural vegetation (grass) | 6.14 | 433 | 195 | 370 | 9.5 | 227 | 84.4 | 5.9 | 9.7 | 1.14 | ||
| 2011/12 and 2012/13 | Winterton | Glyphosate-tolerant soybean (PAN6164R) | Soybean | 5.67 | 1,782 | 400.5 | 381 | 20.5 | 85 | 81.2 | 10.4 | 8.5 | 2.49 |
| 2012/13 | Conventional soybean (Mukwa) | Maize/ Soybean | 6.33 | 1,565 | 198 | 182 | 2 | 390 | 78.8 | 12.9 | 8.4 | 1.3 | |
| 2011/12 and 2012/13 | Conventional soybean (Mukwa) | Maize/Soybean | 5.92 | 1,827 | 139 | 551 | 5.5 | 532 | 44.8 | 38.4 | 16.7 | 2.77 | |
| 2011/12 and 2012/13 | Natural vegetation (grass) | 6.85 | 751 | 120 | 86 | 0.5 | 335 | 61.4 | 23.3 | 15.3 | 1.62 | ||
| 2011/12 and 2012/13 | Natural vegetation (grass) | 5.65 | 887 | 208 | 295 | 4.5 | 358 | 45.9 | 31.4 | 22.8 | 2.59 | ||
Table 2
Average temperature and rainfall figures for the 28 sites where a nematode survey was conducted during the 2011/12 and 2012/13 growing seasons.
| Temperature (°C) | ||||
|---|---|---|---|---|
| Locality and province | Growing season | Min. | Max. | Rainfall (mm) |
| Bothaville (Free State) | 2011/12 | 13 | 26 | 272 |
| 2012/13 | 14 | 30 | 255 | |
| Brits (North West) | 2011/12 | 16 | 33 | 414 |
| 2012/13 | 16 | 32 | 365 | |
| Edenville (Free State) | 2012/13 | 16 | 32 | 303 |
| Marble Hall (Mpumalanga) | 2011/12 | 18 | 31 | 402 |
| 2012/13 | 18 | 35 | 353 | |
| Viljoenskroon (Free State) | 2012/13 | 14 | 31 | 373 |
| Winterton (Kwa-Zulu Natal) | 2011/12 | 14 | 30 | 409 |
| 2012/13 | 14 | 30 | 417 | |
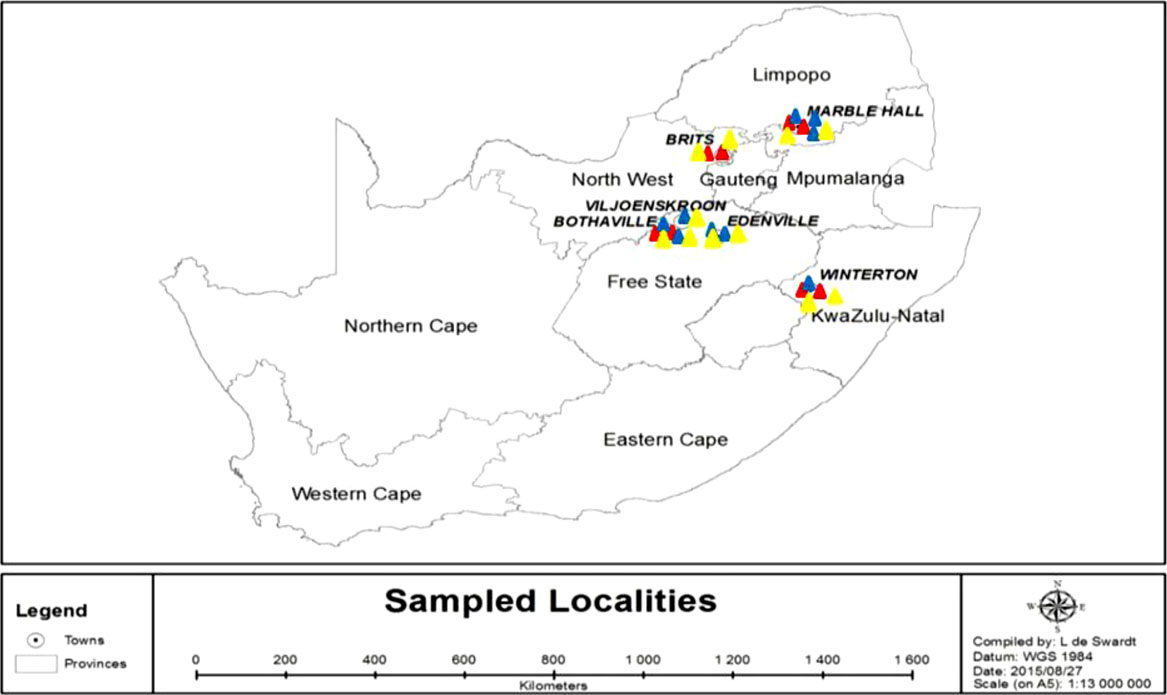
Fig. 1
Location of the six localities where terrestrial, non-parasitic nematodes were sampled from soybean fields (2011/12: red triangles and 2012/13: blue triangles) and adjacent natural vegetation (yellow triangles) during two consecutive growing seasons (Map compiled by: Ms L. de Swart, NWU).
Table 3
Crop history, agricultural practices, fertilisers applied, glyphosate application dates, and dosage rate, nematode sampling dates, rainfall, and minimum and maximum temperatures recorded of the experimental plot during the 2013/14 and 2014/15 growing seasons.
| Crop history: growing season, crop and herbicides applied | Growing season, crop and cultivar cultivated | Agricultural practice implemented | Inorganic fertiliser applied and dosage | Glyphosate application dates and dosage rates | Nematode sampling dates | Rainfall (mm) | Minimum temperature (°C) | Maximum temperature (°C) |
|---|---|---|---|---|---|---|---|---|
| 2011/12, sunflower, no herbicide used (hand-hoeing of weeds) | 2013/14 (1st year), soybean (cv. LS 6164 R) | Reap and plough before planting | None | 10 January 2014 and 03 February 2014 @ 2 L/ha | 1st = 30/01/2014; 2nd = 14/02/2014; 3rd = 22/04/2014 | 603 | 7.9 | 30.5 |
| 2012/13, maize, Gramoxone® (active substance bipyridyl 200 g/L as dichloride salt 276 g/L) dosage rate 3 L/ha | 2014/15 (2nd year), maize (cv. DKC 80–30 RR) | Reap and plough before planting | 2:3:2 (26) at planting @ 300 kg/ha Ureum @ 50 kg/ha 4 weeks after planting | 17 December 2014 and 13 January 2015 @ 2 L/ha | 1st = 08/01/2015; 2nd = 27/01/2015; 3rd = 11/03/2015 | 510 | 10.0 | 30.2 |
Table 4
Non-parasitic nematodes associated with soybean and natural vegetation at 28 sites in the soybean production areas of South Africa during the 2011/12 and 2012/13 growing seasons (√ indicates the presence of a genus; – indicates the absence of a genus).
| Genus | Functional guilda, followed by c–p valueb | Glyphosate-tolerant soybean | Conventional soybean | Natural vegetation |
|---|---|---|---|---|
| Mesorhabditis (Osche, 1952; Dougherty, 1953) | Ba1 | √ | √ | √ |
| Panagrolaimus (Fuchs, 1930) | Ba1 | √ | √ | √ |
| Rhabditis (Dujardin, 1845) | Ba1 | √ | √ | √ |
| Acrobeles (Linstow, 1877) | Ba2 | √ | √ | √ |
| Acrobeloides (Cobb, 1924; Thorne, 1937) | Ba2 | √ | √ | √ |
| Cephalobus (Steiner, 1929) | Ba2 | √ | √ | √ |
| Chiloplacus (Thorne, 1937) | Ba2 | √ | √ | √ |
| Eucephalobus (Steiner, 1936) | Ba2 | √ | √ | √ |
| Monhystera (Bastian, 1865) | Ba2 | √ | √ | √ |
| Plectus (Bastian, 1865) | Ba2 | √ | √ | √ |
| Seleborca (Andrassy, 1985) | Ba2 | √ | √ | √ |
| Wilsonema (Cobb, 1913) | Ba2 | √ | √ | √ |
| Zeldia (Thorne, 1937) | Ba2 | √ | √ | √ |
| Teratocephalus (de Man, 1876) | Ba4 | √ | √ | √ |
| Alaimus (de Man, 1880) | Ba4 | √ | √ | √ |
| Aphelenchoides (Fischer, 1894) | Fu2 | √ | √ | √ |
| Aphelenchus (Bastian, 1865; Cobb, 1927) | Fu2 | √ | √ | √ |
| Ditylenchus (Filipjev, 1936) | Fu2 | √ | √ | √ |
| Psilenchus (de Man, 1921) | Fu2 | √ | √ | √ |
| Tylenchus (Bastian, 1865) | Fu2 | √ | √ | √ |
| Coslenchus (Siddiqi, 1978) | Fu3 | √ | √ | √ |
| Leptonchus (Cobb, 1920) | Fu4 | √ | √ | √ |
| Tylencholaimellus (Cobb, 1915; de Man, 1921) | Fu4 | √ | √ | √ |
| Tylencholaimus (de Man, 1880) | Fu4 | √ | √ | √ |
| Dorylaimus (Thorne, 1939) | Om4 | √ | √ | √ |
| Eudorylaimus (Andrassy, 1959) | Om4 | √ | √ | √ |
| Thornenema (Andrassy, 1959) | Om4 | √ | √ | √ |
| Mononchus (Chitwood and Allen, 1959) | Pr4 | √ | √ | √ |
| Paraxonchium (Krall, 1958) | Pr4 | √ | √ | √ |
| Aporcelaimellus (Heyns, 1965) | Pr5 | √ | √ | √ |
| Discolaimium (Thorne, 1939) | Pr5 | √ | √ | √ |
| Discolaimoides (Heyns, 1963) | Pr5 | √ | √ | √ |
[i] aFunctional guilds (Ferris et al., 2001); bColonizer-persister (c–p) values (Bongers, 1990).
Table 5
Prominence values (PV), mean population density (MPD) and frequency of occurrence (FO%) of non-parasitic nematode genera identified from 200 g soil samples from glyphosate-tolerant and conventional soybean fields, as well as natural vegetation from 28 sites in the soybean production area of South Africa during the 2011/12 and 2012/13 growing seasons.
| Genus | PV | FO% | MPD | Genus | PV | FO % | MPD | Genus | PV | FO% | MPD |
|---|---|---|---|---|---|---|---|---|---|---|---|
| Glyphosate-tolerant soybean | Conventional soybean | Natural vegetation | |||||||||
| 2011/12 season | |||||||||||
| Aphelenchus | 3,646 | 100 | 3,646 | Panagrolaimus | 2,723 | 75 | 3,144 | Acrobeles | 3,885 | 100 | 3,885 |
| Acrobeles | 2,131 | 50 | 3,014 | Acrobeloides | 1,963 | 50 | 2,804 | Aphelenchus | 3,741 | 75 | 4,320 |
| Acrobeloides | 982 | 50 | 1,403 | Aphelenchus | 1,683 | 50 | 2,380 | Acrobeloides | 2,758 | 75 | 3,185 |
| Eucephalobus | 668 | 25 | 1,335 | Aphelencohides | 840 | 25 | 1,680 | Panagrolaimus | 1,310 | 50 | 1,853 |
| Aphelenchoides | 572 | 25 | 1,144 | Acrobeles | 444 | 50 | 634 | Eucephalobus | 907 | 50 | 1,281 |
| Psilenchus | 452 | 25 | 905 | Plectus | 338 | 25 | 675 | Rhabditis | 648 | 50 | 915 |
| Panagrolaimus | 253 | 25 | 505 | Cephalobus | 216 | 25 | 431 | Cephalobus | 570 | 25 | 1,139 |
| Rhabditis | 197 | 25 | 393 | Eucephalobus | 171 | 25 | 342 | Tylenchus | 534 | 75 | 615 |
| Mesorhabditis | 168 | 25 | 335 | Monhystera | 158 | 25 | 315 | Psilechus | 184 | 50 | 262 |
| Tylenchus | 17 | 25 | 34 | Mesorhabditis | 130 | 25 | 259 | Zeldia | 71 | 25 | 142 |
| Discolaimoides | 3 | 25 | 5 | Tylenchus | 40 | 25 | 80 | Dorylaimus | 5 | 25 | 9 |
| Thornenema | 3 | 25 | 5 | Psilenchus | 20 | 25 | 40 | Aporcellaimellus | 4 | 25 | 8 |
| Paraxonchium | 2 | 25 | 4 | Dorylaimus | 4 | 25 | 7 | Discolamium | 3 | 25 | 5 |
| – | – | – | – | Discolaimoides | 3 | 25 | 5 | Discolaimoides | 2 | 25 | 3 |
| – | – | – | – | Paraxonchium | 2 | 25 | 3 | – | – | – | – |
| – | – | – | – | Thornenema | 2 | 25 | 3 | – | – | – | – |
| 2012/13 season | |||||||||||
| Aphelenchus | 2,275 | 100 | 2,275 | Aphelenchus | 1,448 | 100 | 1,448 | Aphelenchus | 2,590 | 100 | 2,590 |
| Acrobeles | 1,230 | 89 | 1,304 | Eucephalobus | 988 | 44 | 1,490 | Eucephalobus | 2,425 | 83 | 2,662 |
| Eucephalobus | 941 | 78 | 1,065 | Acrobeloides | 821 | 67 | 1,003 | Panagrolaimus | 1,615 | 100 | 1,615 |
| Acrobeloides | 827 | 67 | 1,010 | Panagrolaimus | 553 | 33 | 962 | Cephalobus | 1,414 | 67 | 1,728 |
| Rhabditis | 824 | 67 | 1,007 | Acrobeles | 365 | 33 | 635 | Acrobeloides | 1,156 | 83 | 1,269 |
| Aphelenchoides | 781 | 56 | 1,043 | Aphelenchoides | 334 | 22 | 711 | Acrobeles | 849 | 56 | 1,134 |
| Panagrolaimus | 576 | 56 | 770 | Seleborca | 286 | 22 | 610 | Aphelenhoides | 817 | 67 | 998 |
| Zeldia | 298 | 33 | 519 | Cephalobus | 587 | 56 | 784 | Ditylenchus | 323 | 33 | 562 |
| Cephalobus | 148 | 22 | 315 | Plectus | 241 | 22 | 513 | Plectus | 183 | 33 | 319 |
| Chiloplacus | 63 | 11 | 190 | Ditylenchus | 212 | 22 | 451 | Mesorhabditis | 151 | 17 | 365 |
| Ditylenchus | 53 | 11 | 161 | Mesorhabditis | 206 | 33 | 439 | Seleborca | 77 | 17 | 186 |
| Mesorhabditis | 42 | 11 | 126 | Plectus | 201 | 22 | 429 | Rhabditis | 68 | 17 | 165 |
| Plectus | 34 | 11 | 108 | Zeldia | 98 | 11 | 295 | Zeldia | 66 | 17 | 159 |
| Tylencholaimus | 7 | 11 | 22 | Chiloplacus | 78 | 11 | 235 | Wilsonema | 65 | 17 | 157 |
| Discolaimium | 3 | 22 | 7 | Dorylaimus | 8 | 55 | 11 | Chilopacus | 63 | 17 | 154 |
| Aporcelaimellus | 3 | 22 | 6 | Leptonchus | 4 | 11 | 11 | Teratocephalus | 7 | 17 | 16 |
| Eudorylaimus | 2 | 11 | 7 | Tylencholaimus | 3 | 11 | 10 | Eudorylaimus | 7 | 33 | 12 |
| Discolaimoides | 2 | 11 | 6 | Alaimus | 3 | 11 | 9 | Leptonchus | 5 | 17 | 13 |
| – | – | – | – | Mononchus | 2 | 11 | 5 | Coslenchus | 4 | 17 | 10 |
| – | – | – | – | – | – | – | – | Tylencholaimellus | 4 | 17 | 9 |
| – | – | – | – | – | – | – | – | Discolaimoides | 3 | 17 | 8 |
Table 6
Non-parasitic nematodes genera mean population density data per 200 g rhizosphere soil of glyphosate-tolerant and conventional soybean crops, as well natural vegetation from 28 sites surveyed in the soybean production areas of South Africa during the 2011/12 and 2012/2013 growing seasons. Values shown are means, followed by the standard deviation (SD).
| 2011/12 | 2012/13 | ||||
|---|---|---|---|---|---|
| Ecosystems | t-value | P | Ecosystems | t-value | P |
| Acrobeles | |||||
| Glyphosate-tolerant soybean: 603 ± 1,348 Conventional soybean: 27 ± 284 | 0.15 | 0.88 | Glyphosate-tolerant soybean: 261 ± 583 Conventional soybean: 50 ± 335 | 0.06 | 0.97 |
| Glyphosate-tolerant: 603 ± 1,348 Natural vegetation: 777 ± 1,737 | −0.02 | 0.98 | Glyphosate-tolerant soybean: 261 ± 583 Natural veld: 227 ± 507 | 0.01 | 0.99 |
| Conventional soybean: 127 ± 284 Natural vegetation: 777 ± 1,737 | −0.17 | 0.87 | Conventional soybean: 150 ± 335 Natural veld: 227 ± 507 | −0.04 | 0.97 |
| Acrobeloides | |||||
| Glyphosate-tolerant soybean: 281 ± 627 Conventional soybean: 560 ± 1,254 | 0.06 | 0.96 | Glyphosate-tolerant soybean: 202 ± 452 Conventional soybean: 201 ± 449 | 0.001 | 1 |
| Glyphosate-tolerant: 281 ± 627 Natural vegetation: 637 ± 1,424 | 0.08 | 0.94 | Glyphosate-tolerant: 202 ± 452 Natural vegetation: 254 ± 568 | 0.02 | 0.98 |
| Conventional soybean: 560 ± 1,254 Natural vegetation: 637 ± 1,424 | −0.01 | 0.99 | Conventional soybean: 201 ± 449 Natural vegetation: 254 ± 568 | 0.02 | 0.98 |
| Aphelenchus | |||||
| Glyphosate-tolerant soybean: 729 ± 1,631 Conventional soybean: 476 ± 1,064 | −0.04 | 0.97 | Glyphosate-tolerant soybean: 455 ± 1,017 Conventional soybean: 290 ± 648 | 0.04 | 0.97 |
| Glyphosate-tolerant: 729 ± 1,631 Natural vegetation: 864 ± 1,932 | −0.12 | 0.91 | Glyphosate-tolerant: 455 ± 1,017 Natural vegetation: 518 ± 1,158 | 0.01 | 0.99 |
| Conventional soybean: 476 ± 1,064 Natural vegetation: 864 ± 1,932 | −0.05 | 0.96 | Conventional soybean: 290 ± 648 Natural vegetation: 518 ± 1,158 | 0.05 | 0.96 |
| Eucephalobus | |||||
| Glyphosate-tolerant soybean: 267 ± 597 Conventional soybean: 68 ± 153 | −0.15 | 0.89 | Glyphosate-tolerant soybean: 213 ± 476 Conventional soybean: 298 ± 666 | −0.03 | 0.97 |
| Glyphosate-tolerant: 267 ± 597 Natural vegetation: 256 ± 573 | −0.004 | 1 | Glyphosate-tolerant: 213 ± 476 Natural vegetation: 532 ± 1,191 | 0.09 | 0.93 |
| Conventional soybean: 68 ± 153 Natural vegetation: 256 ± 573 | −0.14 | 0.89 | Conventional soybean: 298 ± 666 Natural vegetation: 532 ± 1,191 | 0.05 | 0.96 |
| Panagrolaimus | |||||
| Glyphosate-tolerant soybean: 101 ± 226 Conventional soybean: 629 ± 1,406 | 0.18 | 0.86 | Glyphosate-tolerant soybean: 154 ± 344 Conventional soybean: 192 ± 430 | −0.02 | 0.98 |
| Glyphosate-tolerant: 101 ± 226 Natural vegetation: 371 ± 829 | 0.13 | 0.9 | Glyphosate-tolerant: 154 ± 344 Natural vegetation: 323 ± 722 | 0.07 | 0.94 |
| Conventional soybean: 629 ± 1,406 Natural vegetation: 371 ± 829 | 0.05 | 0.96 | Conventional soybean: 192 ± 430 Natural vegetation: 323 ± 722 | 0.05 | 0.96 |
Table 7
Significance values (P and F-ratios) for three independent variables (ecosystem, locality, and season), according to a Mixed Models analysis, showing their effects (individually and in combination) on four non-parasitic nematode trophic groups that were identified in the soybean production areas of South Africa during the 2011/12 and 2012/13 growing seasons.
| Bacterivores | Fungivores | Omnivores | Predators | |||||
|---|---|---|---|---|---|---|---|---|
| Source | F | P | F | P | F | P | F | P |
| Season | 42.158 | 0.001** | 17.322 | 0.001** | 10.078 | 0.006** | 4.531 | 0.049** |
| Ecosystem | 0.489 | 0.622 | 0.536 | 0.595 | 0.675 | 0.523 | 6.384 | 0.009** |
| Season*Ecosystem | 0.123 | 0.885 | 0.021 | 0.980 | 0.300 | 0.745 | 1.238 | 0.316 |
| Locality | 1.315 | 0.307 | 2.494 | 0.075 | 4.851 | 0.007** | 8.648 | 0.001** |
| Season*Locality | 1.073 | 0.388 | 3.540 | 0.039** | 8.641 | 0.001** | 24.999 | 0.001** |
| Ecosystem*Locality | 0.580 | 0.794 | 0.930 | 0.526 | 0.554 | 0.814 | 2.001 | 0.108 |
| Season*Ecosystem*Locality | 0.561 | 0.728 | 1.454 | 0.259 | 1.076 | 0.410 | 7.083 | 0.001** |
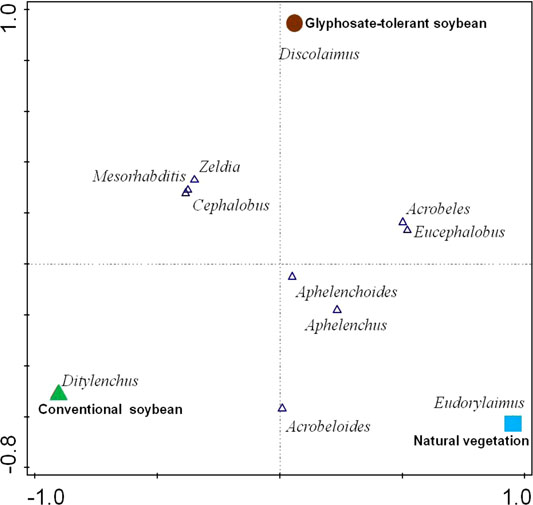
Fig. 2
Canonical correspondence analyses (CCA) of population densities of terrestrial, non-parasitic nematode genera identified from 200 g soil samples obtained from three ecosystems: glyphosate-tolerant soybean fields, conventional soybean fields, and natural vegetation in Edenville during 2012/13 season.
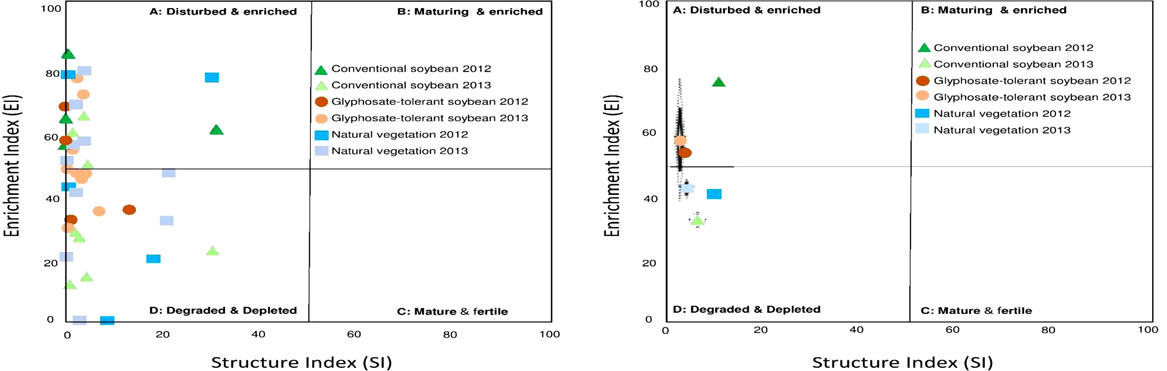
Fig. 3
(A and B) Faunal profiles (Sieriebriennikov et al., 2014) representing the enrichment and structural conditions of soil food webs on the abundance and diversity of terrestrial, non-parasitic nematode genera identified from soils of glyphosate-tolerant and conventional soybean fields, as well as adjacent natural vegetation sites (39 in total) sampled during 2011/12 and 2012/13 seasons (A) and data for such sites pooled for the two seasons (B) in South African soybean production areas.
Table 8
Number of non-parasitic nematodes per 200 g rhizosphere soil of soybean cv. LS 6164 R and maize cv. DKC 80–30 RR plants in glyphosate-treated and non-treated small-field plot halves at three sampling dates during the 2013/14 and 2014/15 growing seasons. Values shown are means, followed by the standard deviation (SD).
| Soybean | Maize | ||||||||
|---|---|---|---|---|---|---|---|---|---|
| Nematode genus | Functional guild, followed by c–p value | Glyphosate-treated | Non-treated | t-value | P | Glyphosate-treated | Non-treated | t-value | P |
| Acrobeles | Ba2 | – | 298 ± 527 | −7 | 0.001 | 888 ± 1,029 | – | −8.15 | 0.001 |
| Acrobeloides | Ba2 | 201 ± 342 | 155 ± 172 | 0.9 | 0.37 | 1,001 ± 1,795 | 149 ± 169 | −1.57 | 0.12 |
| Aphelenchus | Fu2 | 475 ± 746 | 189 ± 249 | 0.31 | 0.76 | 2,635 ± 3,020 | 1,762 ± 2,002 | −6.68 | 0.5 |
| Aphelenchoides | Fu2 | 240 ± 394 | – | 5.25 | 0.001 | 1,226 ± 2,090 | – | −4.15 | 0.001 |
| Aporcelaimellus | Pr5 | – | 0.17 ± 1 | −1 | 0.33 | – | – | ||
| Cephalobus | Ba2 | 512 ± 1,011 | 189 ± 298 | 3.73 | 0.001 | 745 ± 1,098 | 256 ± 316 | −0.96 | 0.34 |
| Discolaimium | Pr5 | – | 0.22 ± 1 | −0.99 | 0.33 | – | – | ||
| Ditylenchus | Fu2 | 38 ± 92 | – | 3.16 | 0.002 | – | – | ||
| Eucephalobus | Ba2 | 211 ± 407 | 46 ± 20 | 0.81 | 0.42 | 1,000 ± 1,129 | 89 ± 156 | −3.98 | 0.001 |
| Leptonchus | Fu4 | 10 ± 17 | 5 ± 13 | 1.54 | 0.13 | – | – | ||
| Panagrolaimus | Ba2 | 544 ± 1,002 | – | 17.65 | 0.001 | 1,350 ± 1,542 | 267 ± 467 | −3.41 | 0.001 |
| Teratocephalus | Ba4 | – | – | – | – | 2 ± 7 | 16 ± 16 | 5.46 | 0.001 |
| Tylenchus | Fu2 | – | 306 ± 537 | −4.1 | 0.001 | – | 267 ± 462 | 4.16 | 0.001 |
| Tylencholaimus | Fu4 | 5 ± 15 | 7 ± 17 | −0.02 | 0.99 | 24 ± 35 | 12 ± 23 | −2.76 | 0.007 |
[i] – No nematodes recovered. Functional guilds given according to Ferris et al. (2001); Colonizer-persister (c–p) values given according to Bongers (1990) with Ba, Bacterivores; Fu, Fungivores; and Pr, Predators.
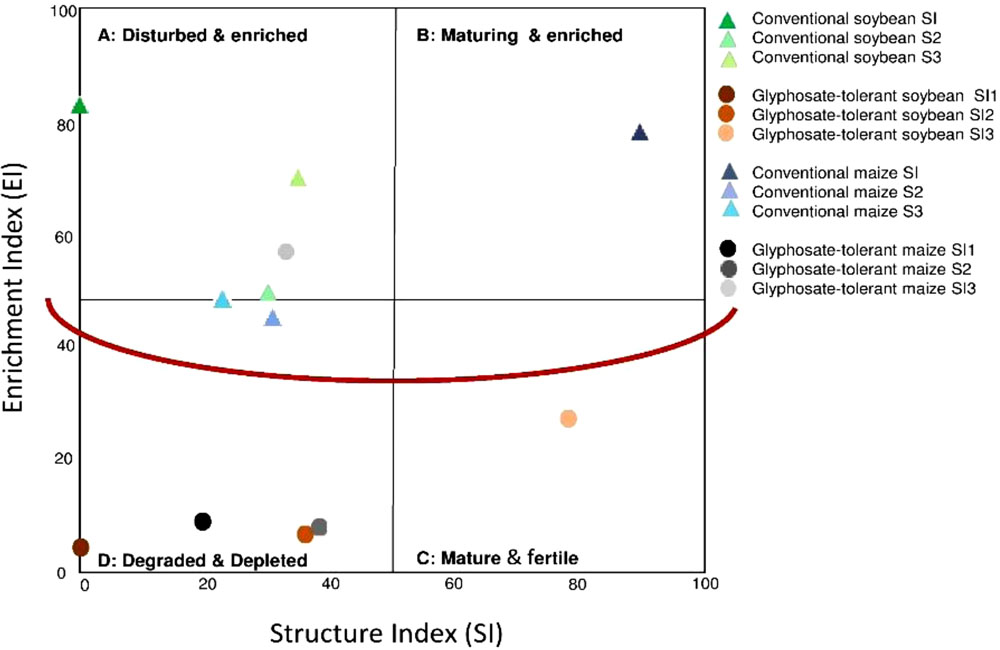
Fig. 4
A faunal, soil food web profile representing the enrichment and structural indices (EI and SI, respectively) of terrestrial, non-parasitic nematode assemblages identified at the three sampling dates in glyphosate-tolerant and non-treated plot halves planted with soybean (during 2013/14 growing season) and maize (during 2014/15 growing season).