
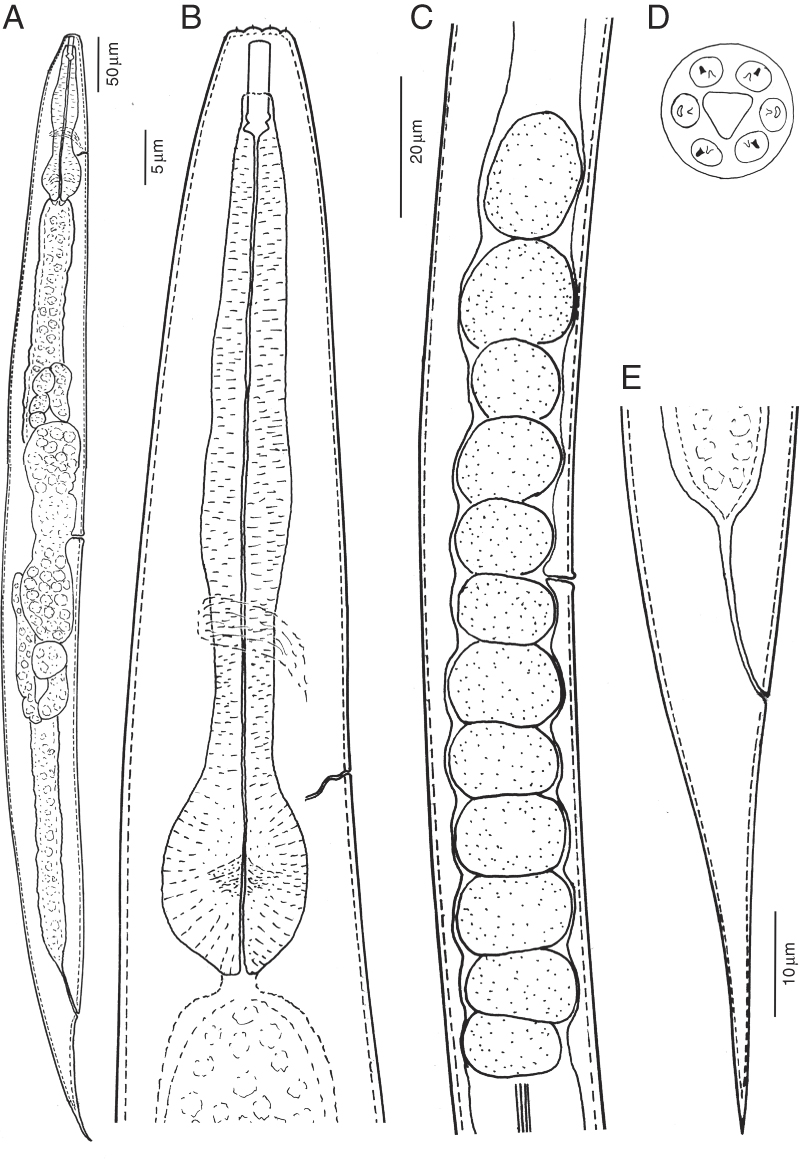
Figure 1
Oscheius onirici female. (A) Entire body. (B) Pharyngeal region. (C) Lateral view of vulva region and lateral field. (D) Schematic representation of En-face view of lip region. (E) Lateral view of tail region.
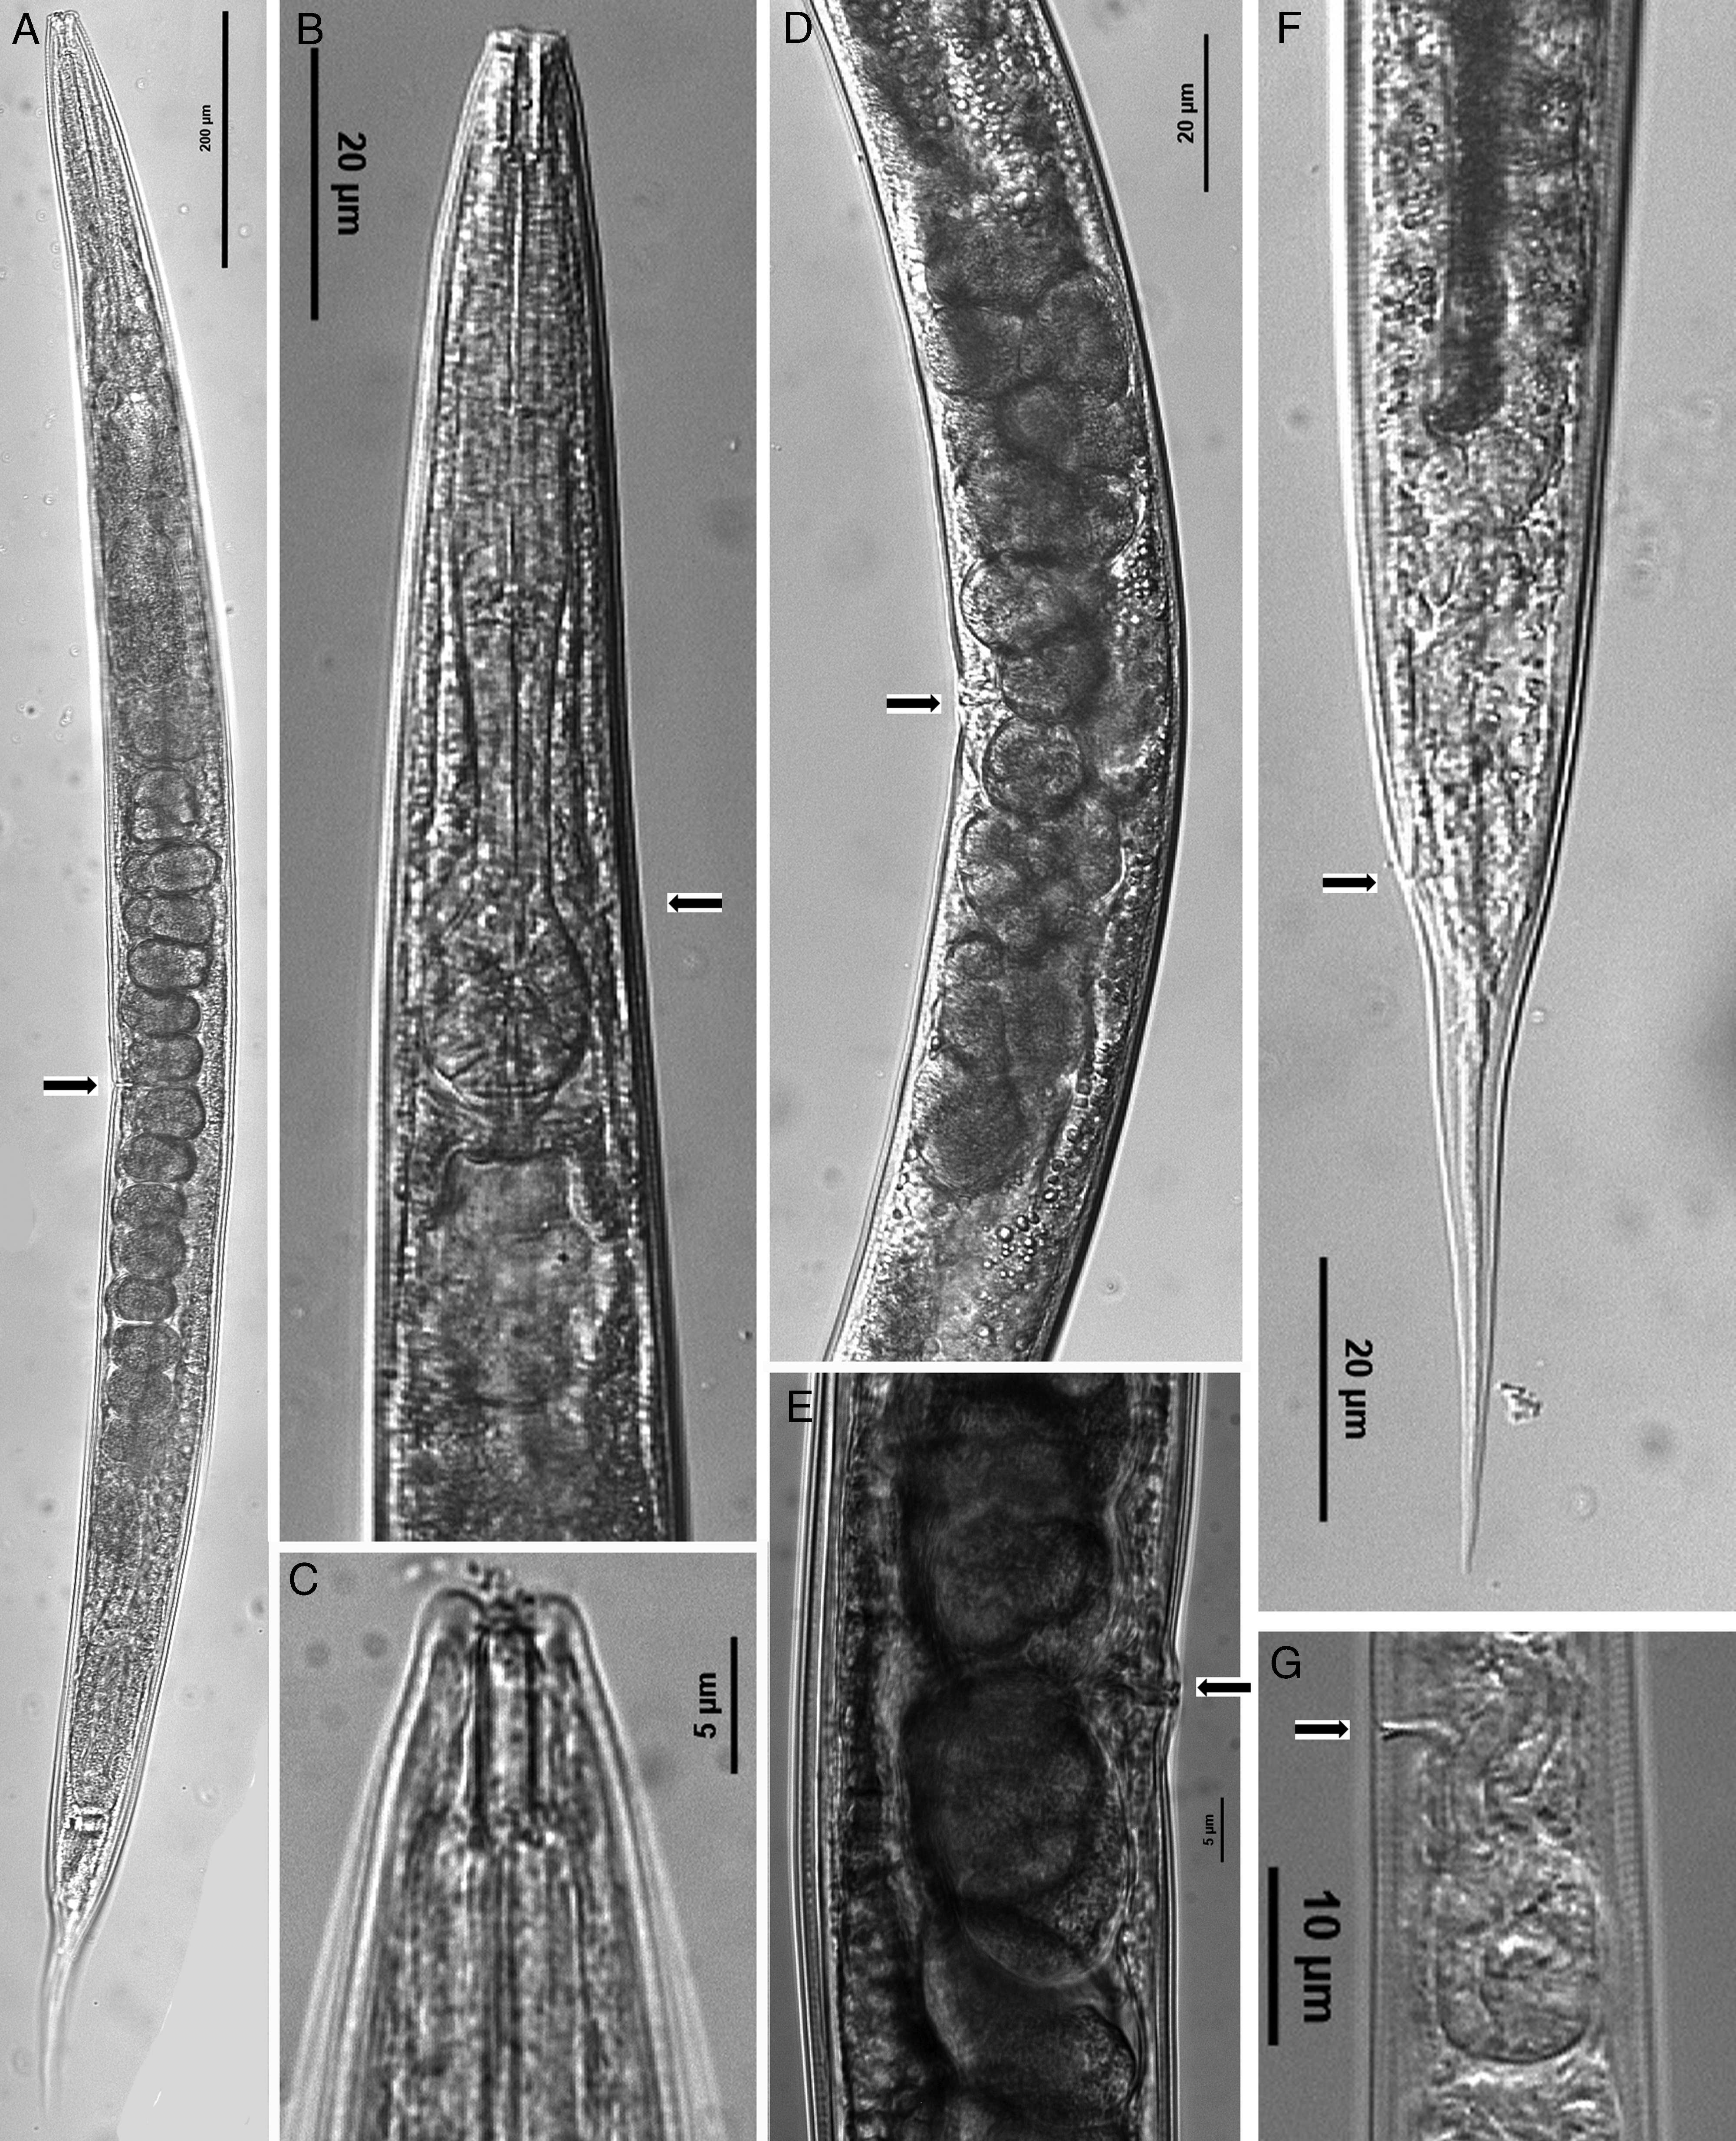
Figure 2
Photographs of Oscheius onirici female. (A) Entire body (arrow showing vulva). (B) Pharyngeal region (arrow showing excretory pore). (C) Head region. (D, E) Lateral view of vulva region (arrow showing vulva). (F) Lateral view of tail region (arrow showing anus). (G) Basal bulb (arrow showing excretory pore).
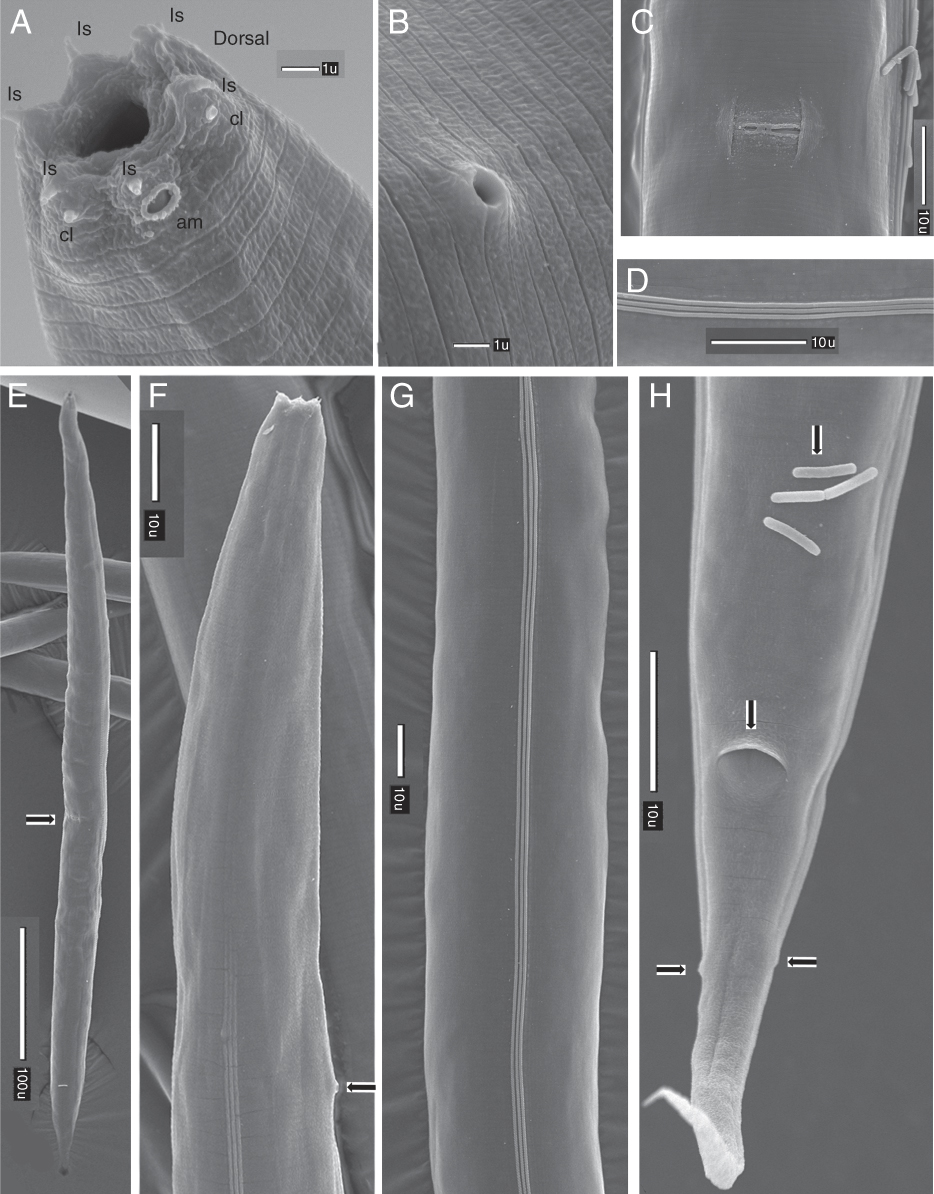
Figure 3
Scanning electron microscope photographs of Oscheius onirici female. (A) Lip region en-face view showing one amphideal aperture (am), six labial sensilla (ls) and two cephalic sensilla (cs). (B) Excrotory pore. (C) Ventral view of vulva. (D) Lateral lines. (E) Entire body lateral view (arrow showing vulva). (F) Esophageal region (arrow showing excretory pore). (G) Lateral field showing lateral lines. (H) Tail region ventral view (Top arrow showing four bacteria, middle arrow showing anus, two bottom arrows showing phasmids).
Table 1
Morphometrics of female Oscheius onirici.
| Measurement or ratio | 16-34833 Wisconsin | PS2068 Oregon | Jul179 France | DFL2014a
Italy |
|---|---|---|---|---|
| N | 20 | 13 | 14 | 20 |
| L | 615-830 (733.3 ± 63.8) | 610-830 (670.4 ± 54.0) | 565 – 835 (645.4 ± 69.3) | 584-801 (671 ± 65.5) |
| a | 13.5-36 (16.3 ± 4.6) | 4.8-23.3 (18.1 ± 4.3) | 14.1-21.4 (16.2 ± 1.8) | 15.8 – 22.5 (19 ± 2) |
| b | 4.8-6.5 (5.6 ± 0.4) | 3.3-6.4 (5.1 ± 0.7) | 3.9-5.4 (4.3 ± 0.4) | 4.4 – 6.0 (4.9 ± 0.5) |
| c | 8.1-15.4 (10.6 ± 2.1) | 3.6-9.4 (7.6 ± 1.5) | 6.1-9.9 (7.4 ± 1.1) | 8.6 – 11.8 (9.7 ± 0.9) |
| c' | 2.2-4.8 (3.5 ± 0.7) | 3.7-5.7 (4.6 ± 0.7) | 3.5-5.8 (4.8 ± 0.7) | 3.5-5.0 (4.3 ± 0.4) |
| V | 47.3-53.2 (50.6 ± 1.3) | 47.2-51.5 (49.7 ± 1.2) | 37.7-53.9 (49.3 ± 3.9) | 47.3 – 52.6 (51.0 ± 1.3) |
| Pharynx | 118-154 (132.0 ± 11.3) | 104-190 (134.7 ± 18.3) | 135-163 (148.4 ± 6.7) | 126-146 (137 ± 6.2) |
| Midbody width | 20-55 (46.8 ± 7.4) | 30-131 (42.8 ± 25.8) | 34-46 (40.0 ± 3.4) | 30-51 (36.0 ± 5.3) |
| Tail | 40-95 (72.1 ± 26.3) | 74-176 (93.3 ± 34.9) | 72-102 (87.6 ± 8.3) | 63-81 (69 ± 5.5) |
| ABW | 16-38 (21 ± 7.6) | 15-44 (20.8 ± 9.0) | 16-29 (18.5 ± 3.4) | 13-23 (16 ± 2.2) |
| Stoma length | 14-22 (17.6 ± 1.9) | 16-19 (17.7 ± 1.1) | 18-29 (20.9 ± 2.4) | 12-16 (14 ± 1.1) |
| Stoma diameter | 3-5 (4.1 ± 0.5) | 3-5 (4.1 ± 0.5) | 4-5 (4.2 ± 0.4) | 3-4 (4 ± 0.4) |
| Basal bulb length | 24-45 (30.5 ± 5.4) | 25-30 (27.6 ± 1.8) | 20-31 (26.6 ± 3.4) | 21-25 (23 ± 1.3) |
| Basal bulb width | 19-28 (22.9 ± 2.6) | 16-26 (19.7 ± 3.1) | 18-27 (23.3 ± 3.1) | 17-21 (19 ± 1.2) |
| EP (Anterior end to excretory pore) | 88-130 (113.1 ± 28.4) | 95-122 (109.3 ± 8.6) | 100-133 (112.7 ± 8.2) | 92-146 (108 ± 13.2) |
| D (%) | 72.4-100.8 (87.6 ± 7.1) | 70.9-92.5 (83.19 ± 6.3) | 64.5-88.9 (77.4 ± 7.1) | 63.4-101.7 (78.9 ± 9.6) |
| Stoma length/stoma diameter | 3.6-5.5 (4.3 ± 0.5) | 1.9-6 (4.2 ± 0.9) | 1.12-5.50 (4.6 ± 1.1) |
[i] aData from Torrini et al. (2015).
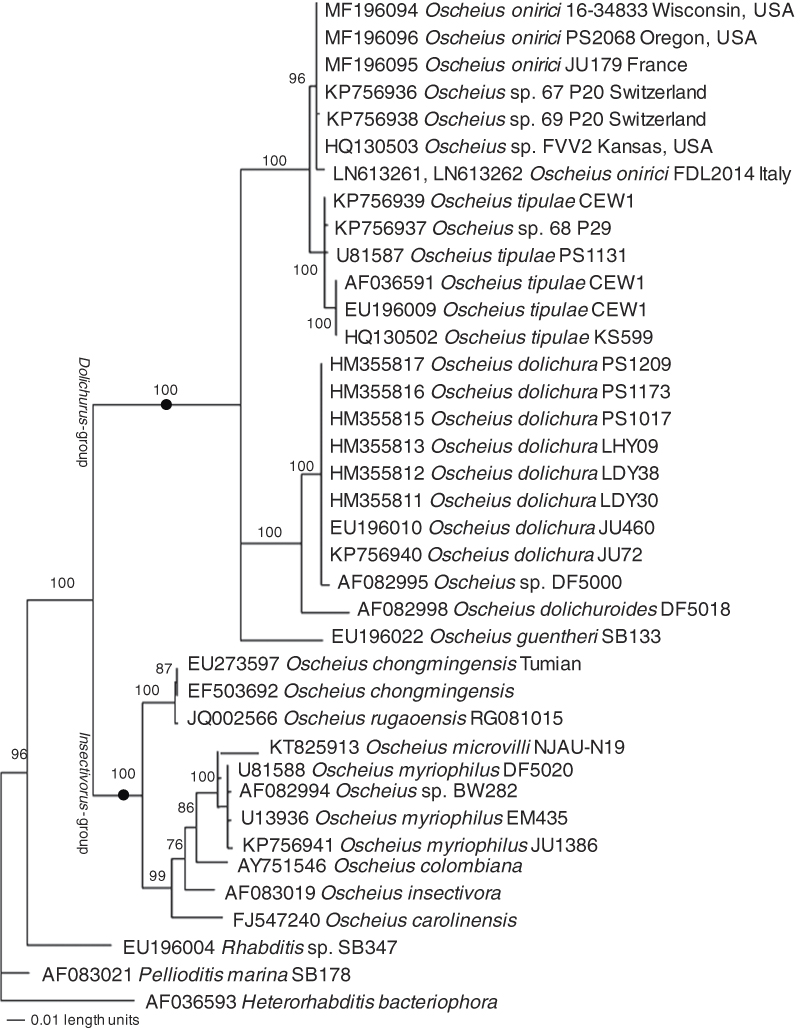
Figure 4
Bayesian consensus tree inferred from 18S under GTR+I+G model (−ln L = 5789.8442; AIC = 11599.6885; freqA = 0.2657; freqC = 0.202; freqG = 0.258; freqT = 0.2743; R(a) = 0.9275; R(b) = 3.6026; R(c) = 2.6802; R(d) = 0.6926; R(e) = 6.3237; R(f) = 1; Pinva = 0.4134; Shape = 0.6825). Posterior probability values exceeding 50% are given on appropriate clades.
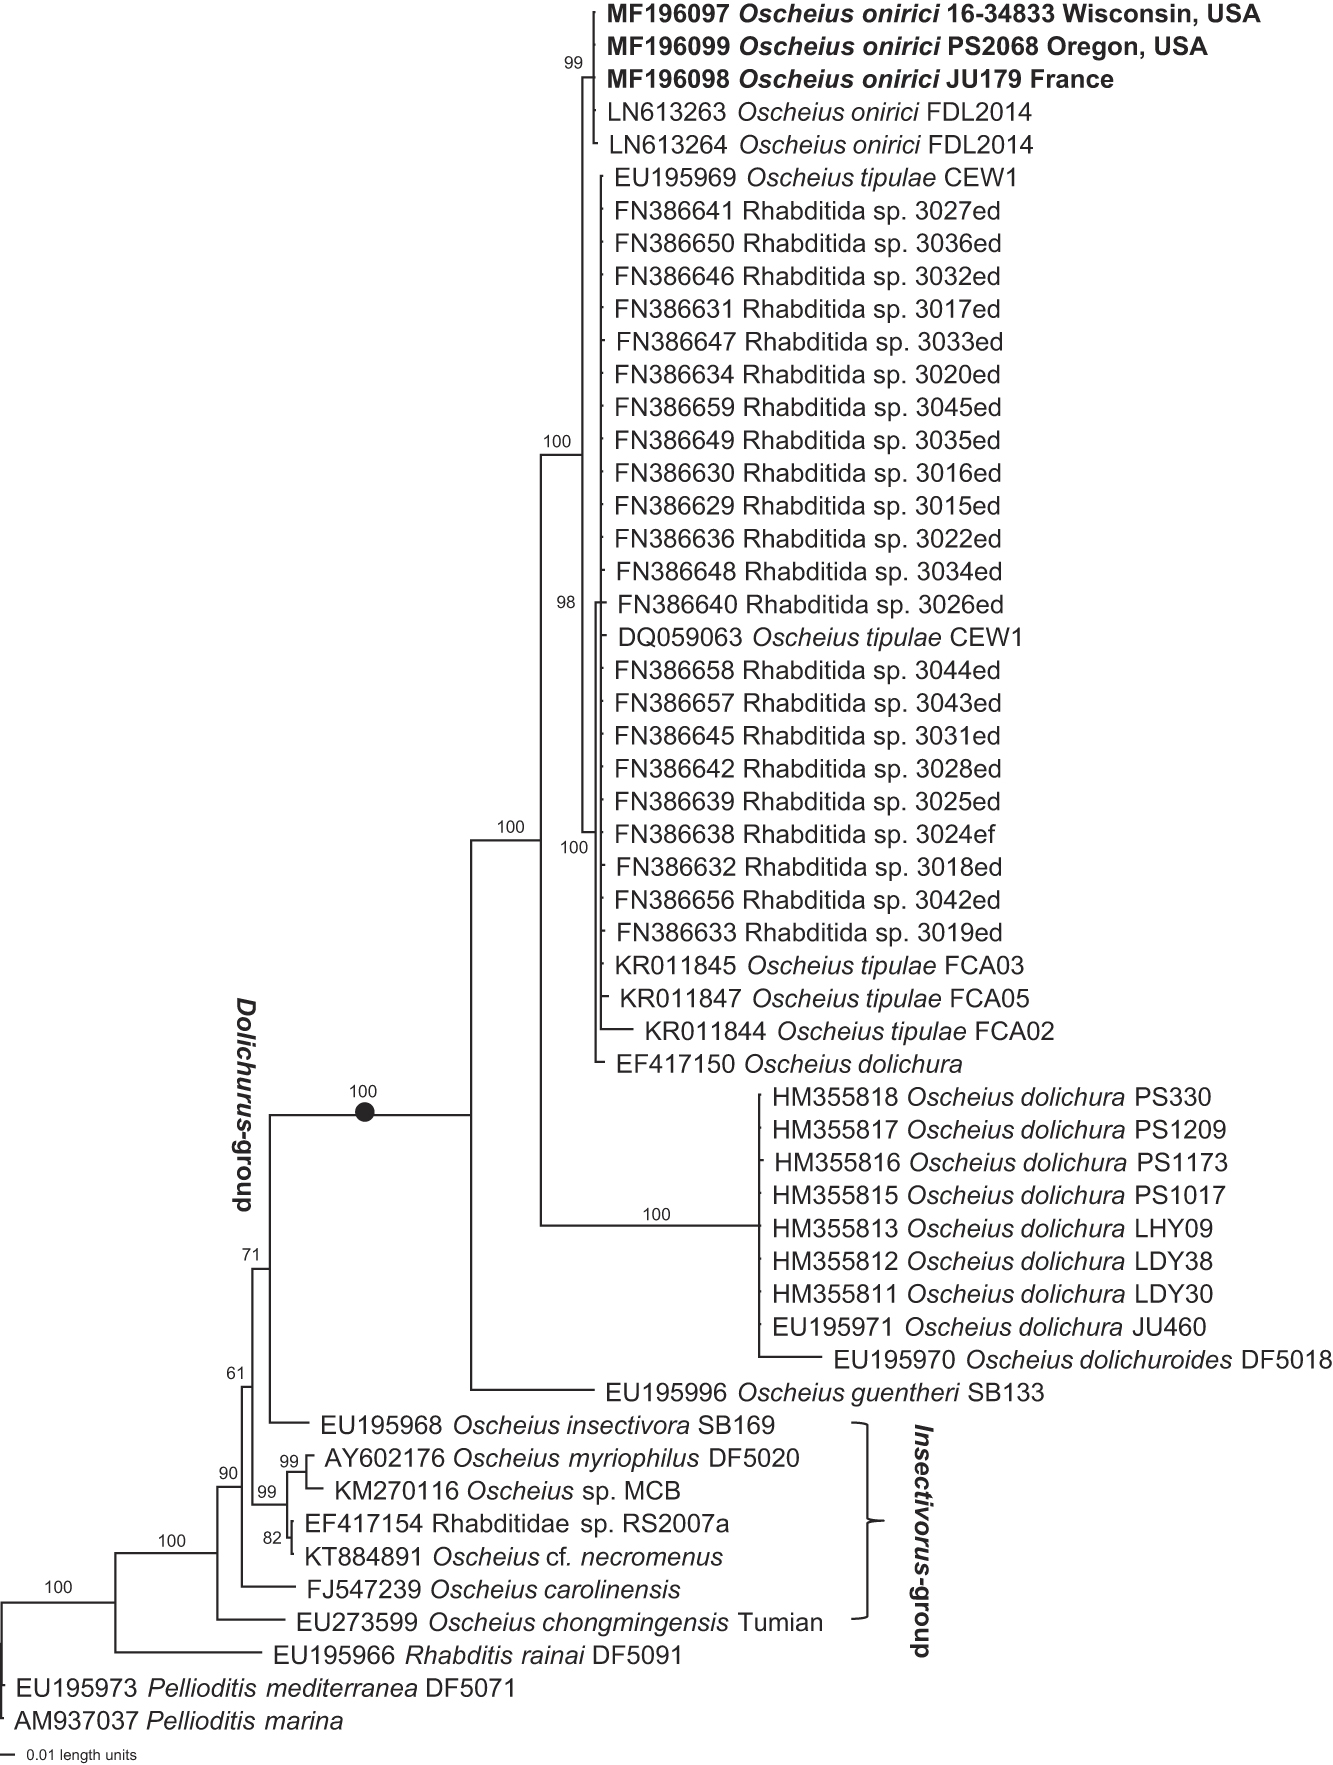
Figure 5
Bayesian consensus tree inferred from 28S D2/D3 under GTR+I+G model (−ln L = 4799.2056; AIC = 9618.4111; freqA = 0.2557; freqC = 0.182; freqG = 0.2892; freqT = 0.2732; R(a) = 0.6259; R(b) = 2.263; R(c) = 1.6102; R(d) = 0.5689; R(e) = 5.2205; R(f) = 1; Pinva = 0.2558; Shape = 0.6827). Posterior probability values exceeding 50% are given on appropriate clades.
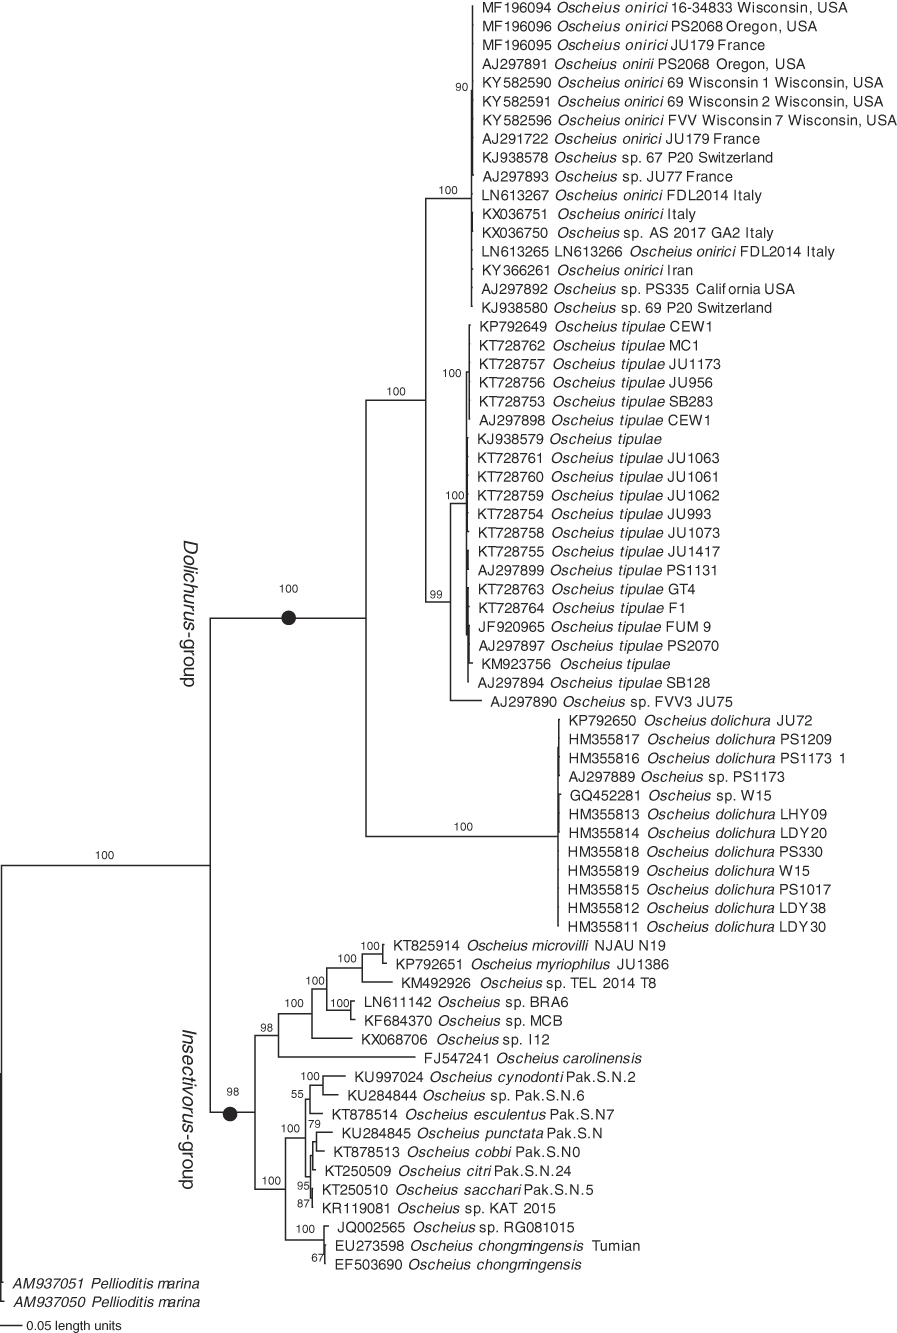
Figure 6
Bayesian consensus tree inferred from ITS under TVM+I model (−ln L = 9235.373; AIC = 18488.7461; freqA = 0.2255; freqC = 0.2115; freqG = 0.2393; freqT = 0.3237; R(a) = 1.3757; R(b) = 3.2802; R(c) = 1.847; R(d) = 1.2014; R(e) = 3.2802; R(f) = 1; Pinva = 0.1375; Shape = 1.5896). Posterior probability values exceeding 50% are given on appropriate clades.
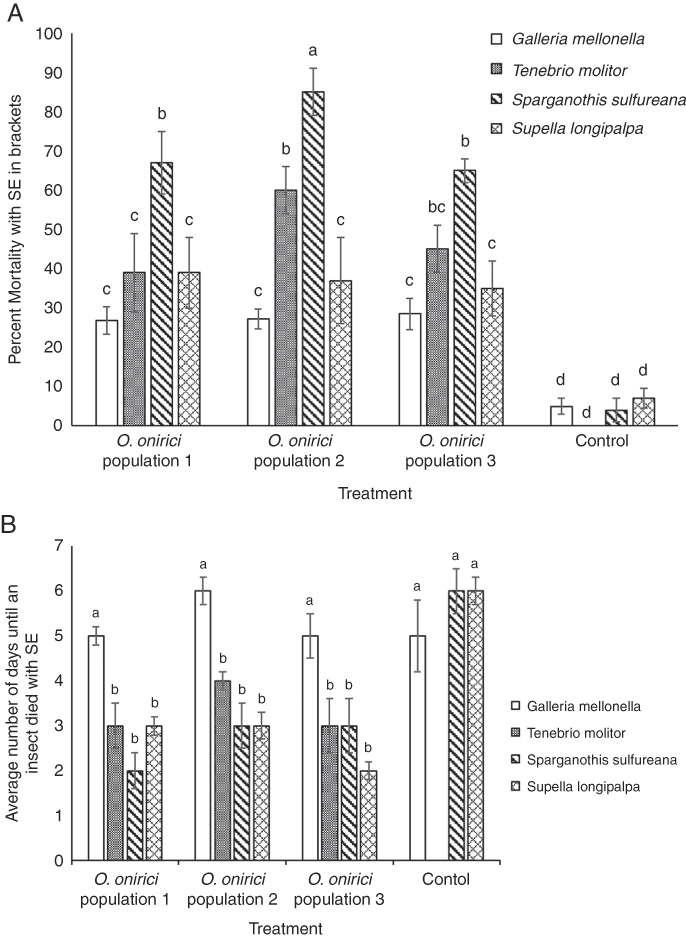
Figure 7A
The mortality rates for different insect types treated with either an Oscheius onirici population, or a control treatment of two milliliters of distilled water. (B) The average number of days that it took for a larva to die after exposure to the treatment. Insects were treated with either an Oscheius onirici population, or a control treatment of two milliliters of distilled water.