
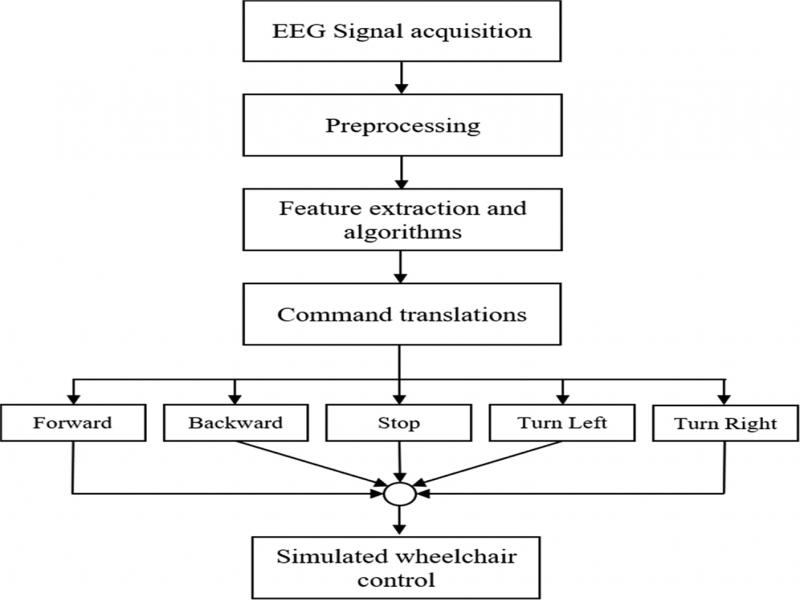
Figure 1:
The proposed face-machine interface system for simulated wheelchair control using artifacts from an EEG neuroheadset.
Table 1.
The commands for simulated wheelchair control.
| Commands No. | Actions | Output commands |
|---|---|---|
| 1 | Jaw chewing on both sides | Forward |
| 2 | Jaw chewing on the left side | Turn Left |
| 3 | Jaw chewing on the right side | Turn Right |
| 4 | Winking both eyes | Backward |
| 5 | Winking the left eye | Turn Left |
| 6 | Winking the right eye | Turn Right |
| Optional | Winking the left eye and then the right eye within 3 sec | Enable/Disable System |
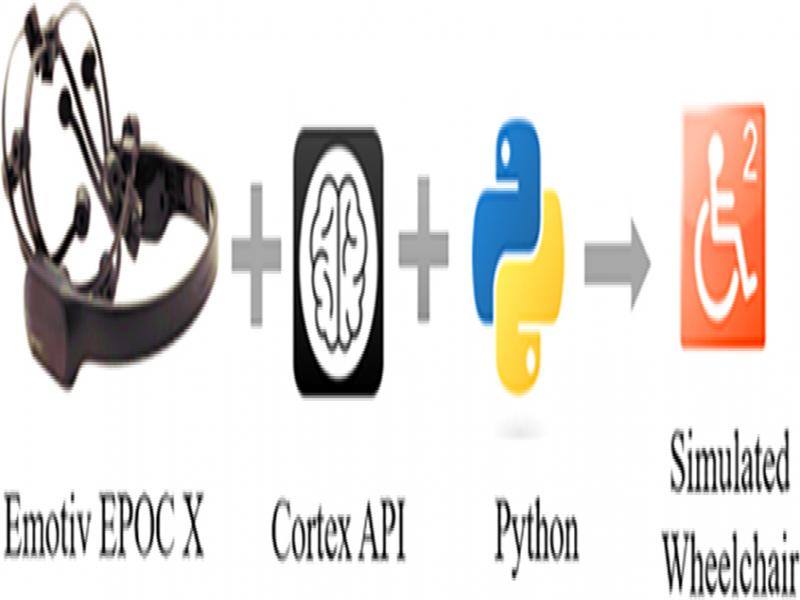
Figure 2:
Components of the EEG signal acquisition process using an Emotiv EPOC X neuroheadset.
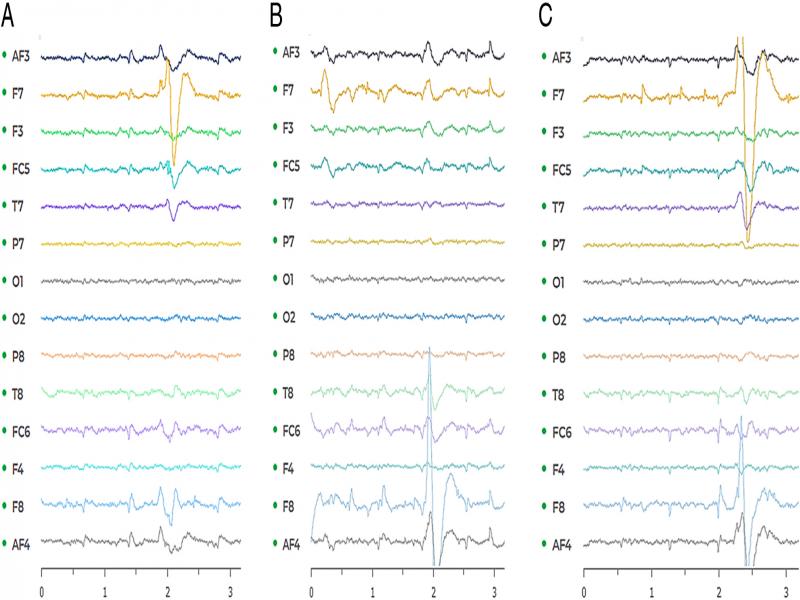
Figure 3:
Examples of EEG signals from the Emotiv Neuroheadset: (a) left eye winking, (b) right eye winking, and (c) both eyes winking.
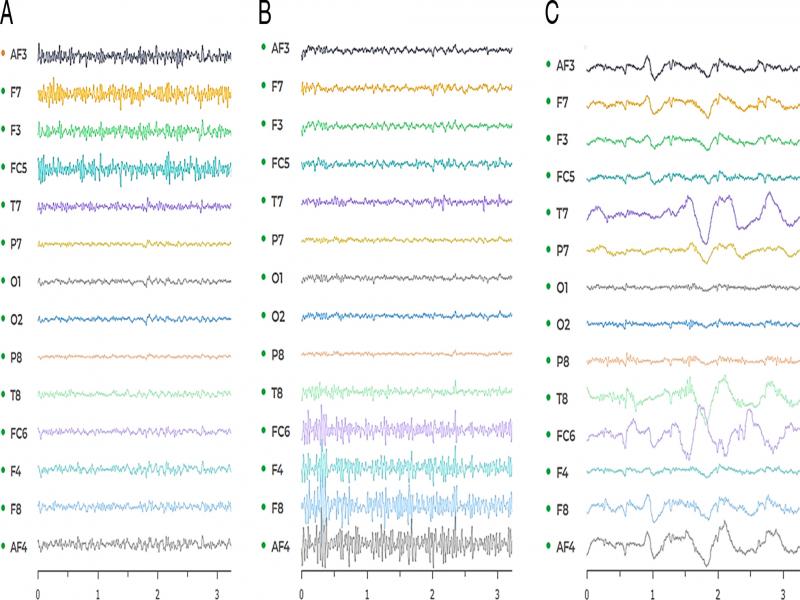
Figure 4:
Examples of EEG signals from the Emotiv Neuroheadset during: (a) left side jaw chewing, (b) right side jaw chewing, and (c) jaw chewing on both sides.
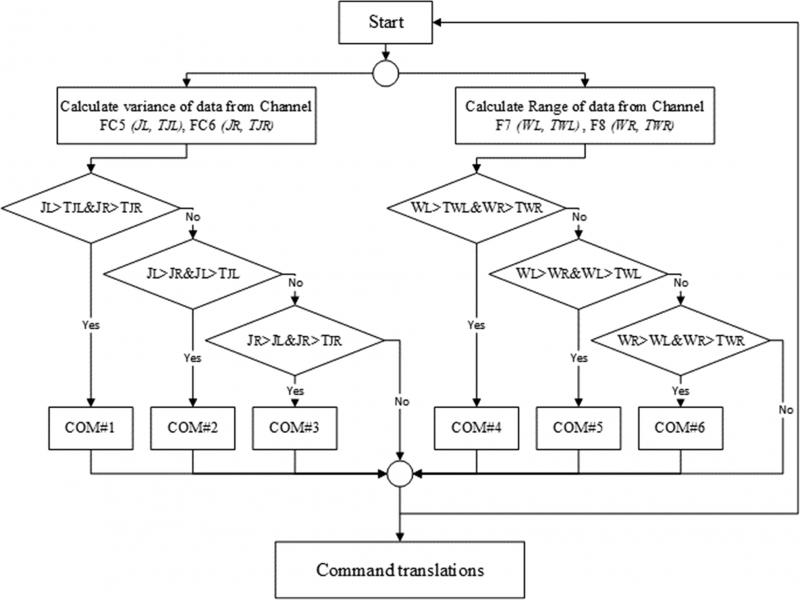
Figure 5:
Flowchart of the proposed classification decisions.
| if JL >TJL & JR>TJR, | Decision is “Com#1” |
| if JL>JR & JL>TJL, | Decision is “Com#2” |
| if JR>JL & JR>TJR, | Decision is “Com#3” |
| if WL >TWL & WR>TWR, | Decision is “Com#4” |
| if WL >WR & WL>TWL, | Decision is “Com#5” |
| if WR>WL & WR>TWR, | Decision is “Com#6” |
| Otherwise, | No Decision |
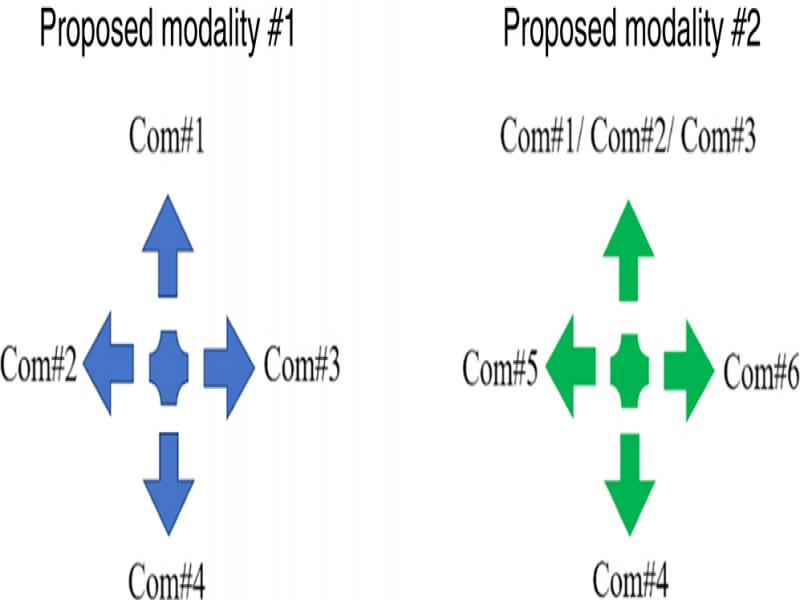
Figure 6:
The proposed modalities for simulated wheelchair control.
Table 2.
The command sequence for testing the performance of the proposed system.
| Sequence No. | Commands | Sequence No. | Commands |
|---|---|---|---|
| 1 | Turn Left | 7 | Turn Right |
| 2 | Turn Right | 8 | Turn Left |
| 3 | Turn Right | 9 | Backward |
| 4 | Turn Left | 10 | Turn Left |
| 5 | Forward | 11 | Turn Right |
| 6 | Backward | 12 | Forward |
Table 3.
Results of the proposed control modalities.
| Average accuracy (%) | ||
|---|---|---|
| Participants | Proposed modality #1 | Proposed modality #2 |
| 1 | 95.8 | 100 |
| 2 | 95.8 | 100 |
| 3 | 91.7 | 95.8 |
| 4 | 87.5 | 95.8 |
| 5 | 91.7 | 100 |
| 6 | 87.5 | 91.7 |
| 7 | 95.8 | 95.8 |
| 8 | 91.7 | 95.8 |
| Mean ± SD | 92.2 ± 3.46 | 96.9 ± 2.94 |
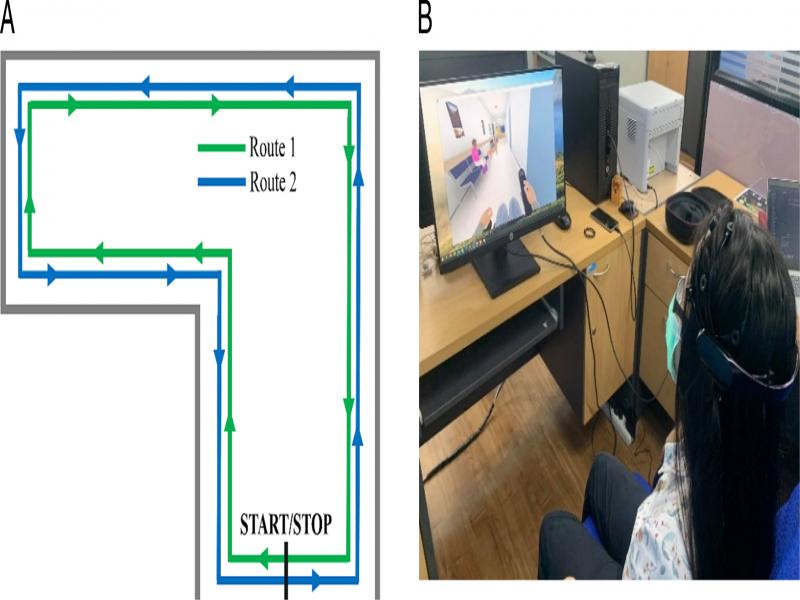
Figure 7:
(a) The testing route (total distance: 30 m). (b) A sample scenario encountered by the simulated power wheelchair during testing.
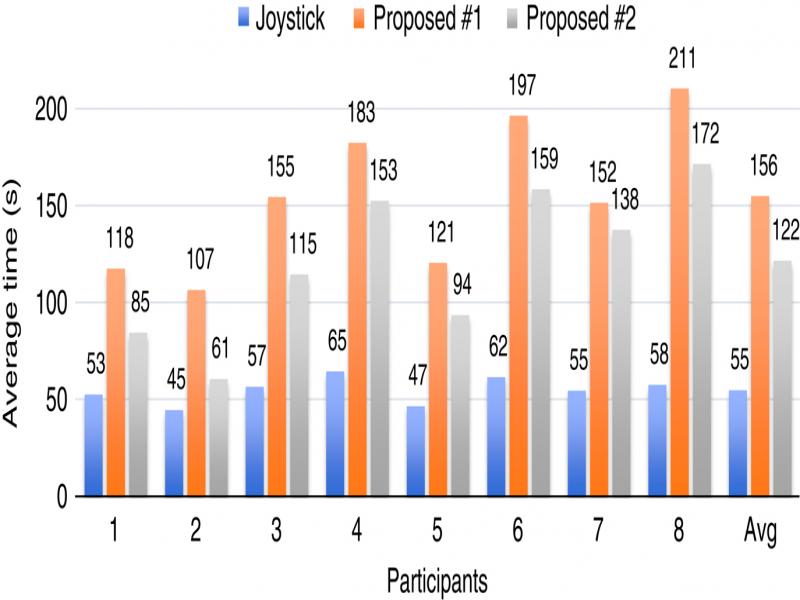
Figure 8:
The average times taken by all participants to complete route 1.
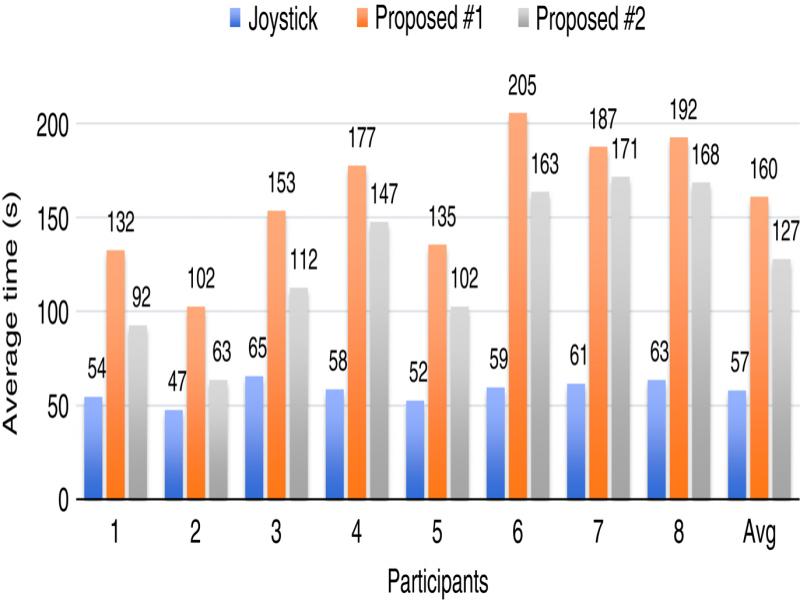
Figure 9:
The average times taken by all participants to complete route 2.