
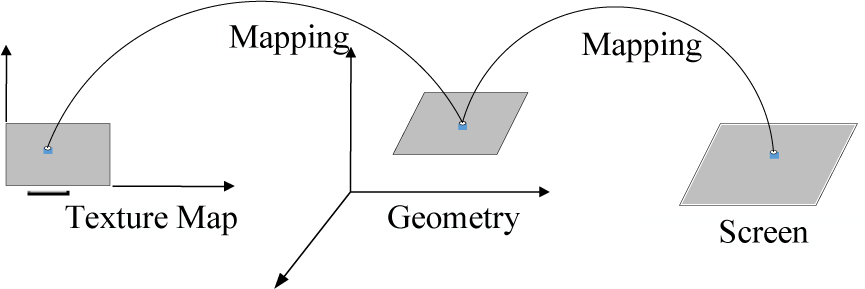
Figure 1.
Texture Map.
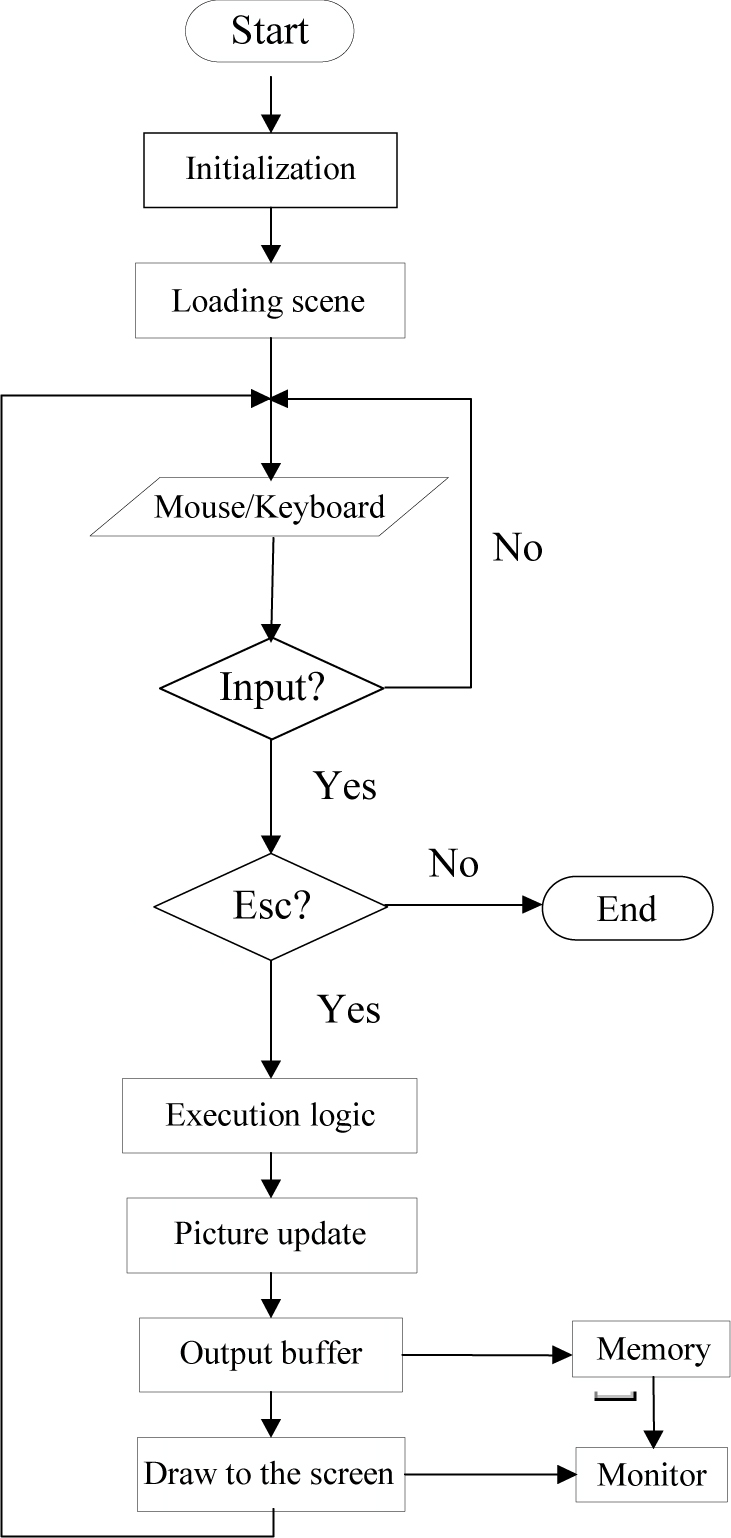
Figure 2.
System Running Process
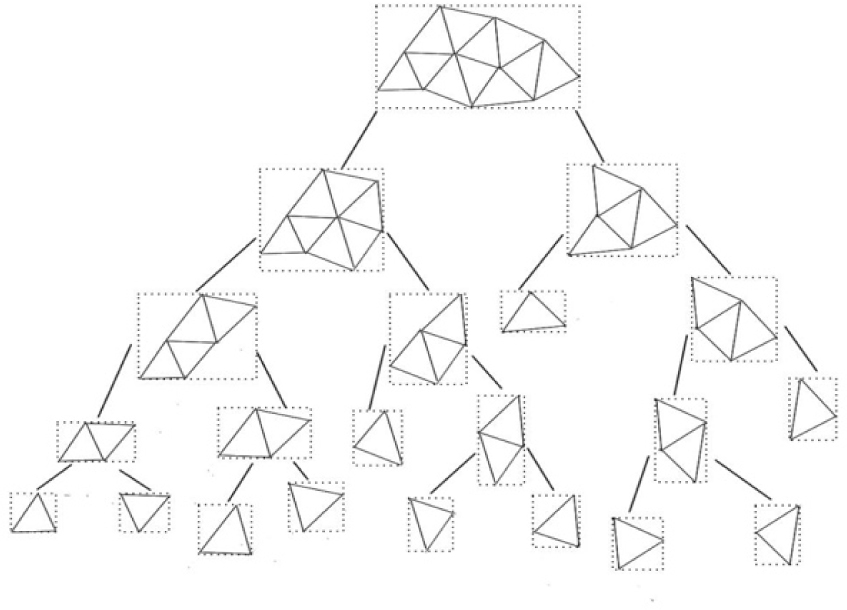
Figure 3.
The Top-down Bounding Box Tree.
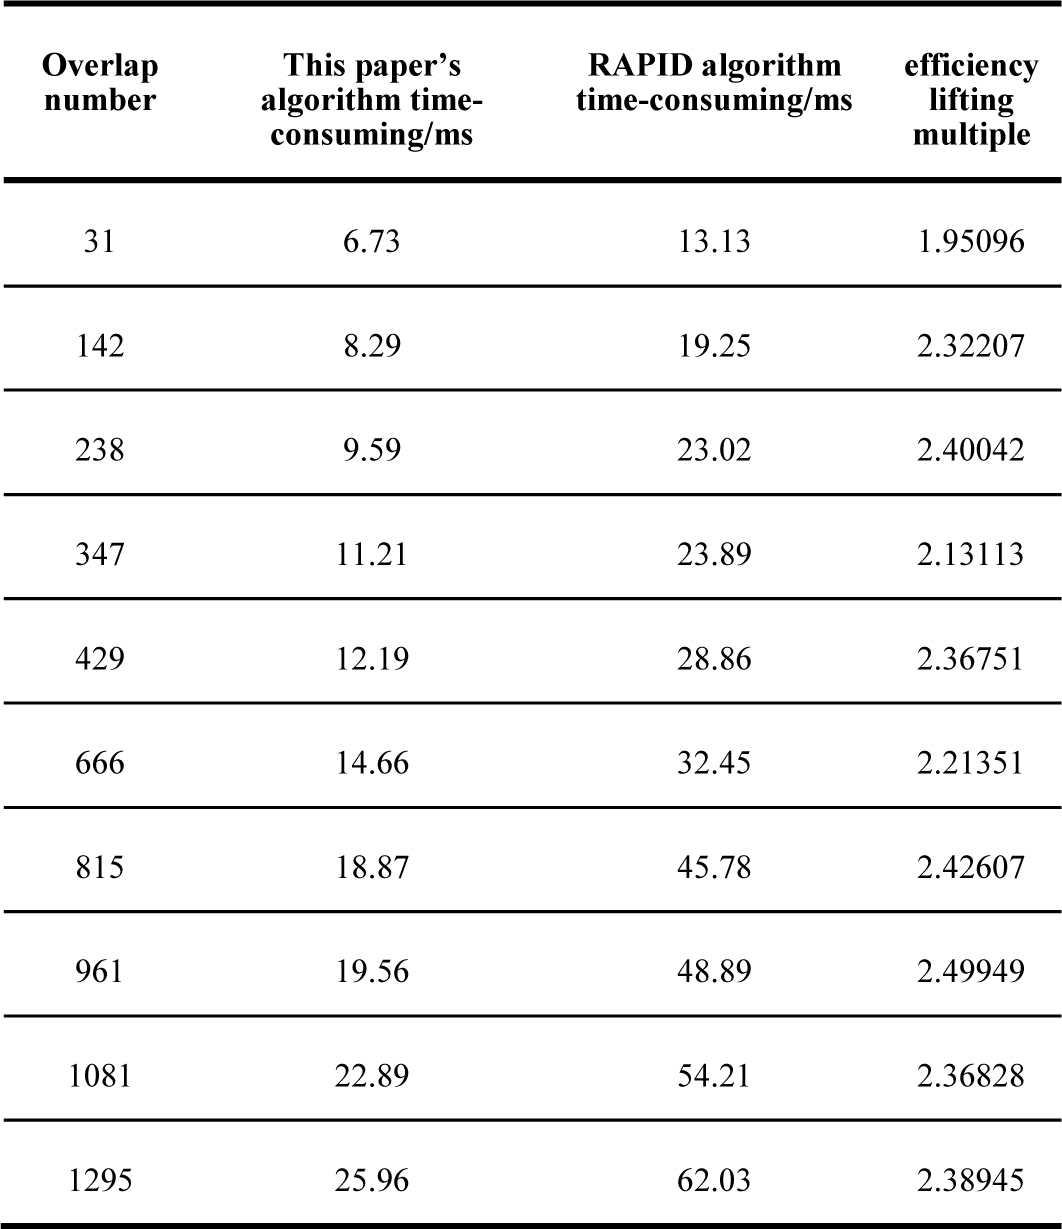
TABLE I.
TABLE COLLISION DETECTION TIME COMPARISON
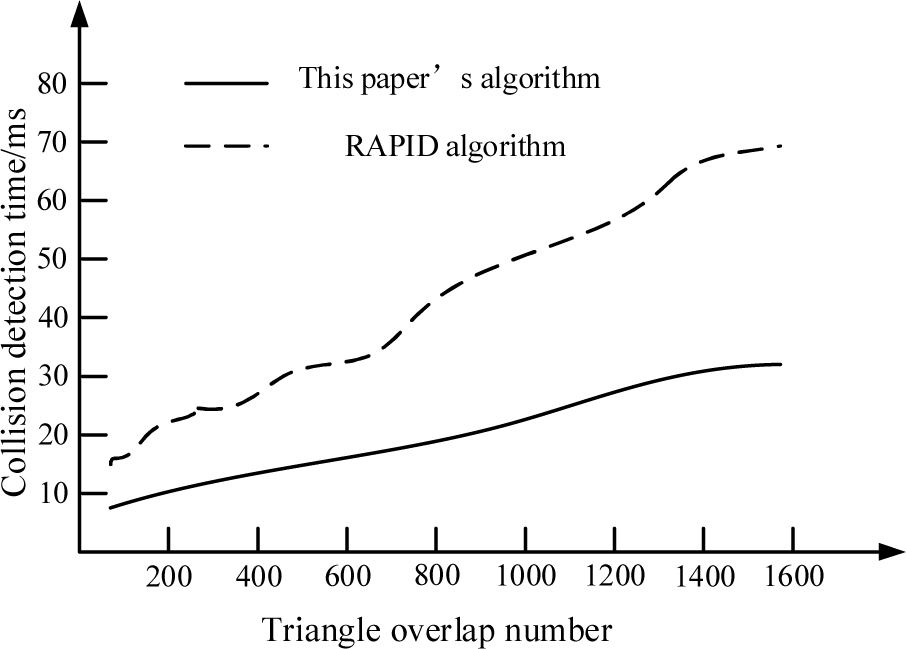
Figure 4.
Time contrast diagram of algorithm collision detection
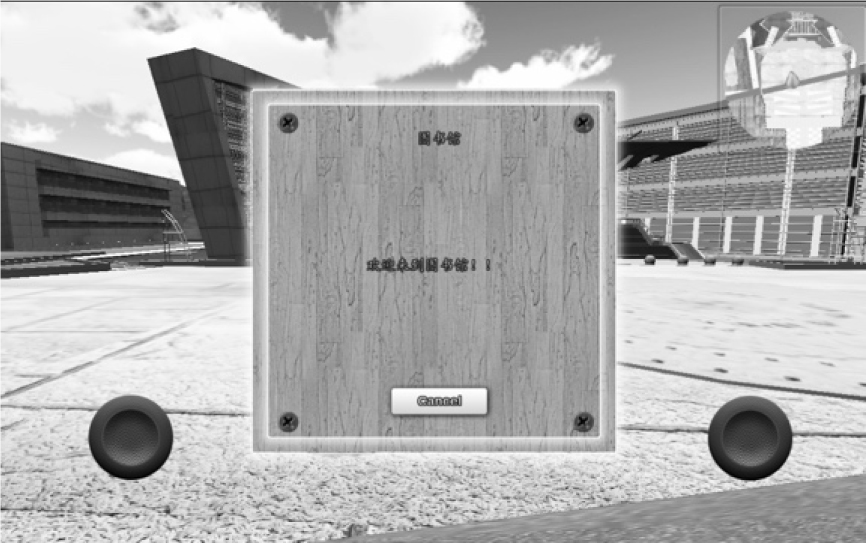
Figure 5.
The information window displayed after the collision