
Table 1
Differences among central theories, conceptualizations, and expectations to interlocks.
| Agency theory | Resource dependence theory | Social network theory | Class hegemony theory | |
|---|---|---|---|---|
| Unit of analysis | Individual | Organization | Organization, individual, or both | Organization/individual |
| Interlocking organization | Firm | Organization (unspecified) | Organization (unspecified), individual, or both | Inter-sectoral organizations |
| Level of analysis of interlock | Individual | Organization | Local network | Global ecology |
| What do interlocks do? | Undermine financial performance | Improve financial performance | Improve financial performance | Establish the possibility of capitalist class cohesion and joint political action. The effect on financial performance is unclear |
Source: Author’s contribution.
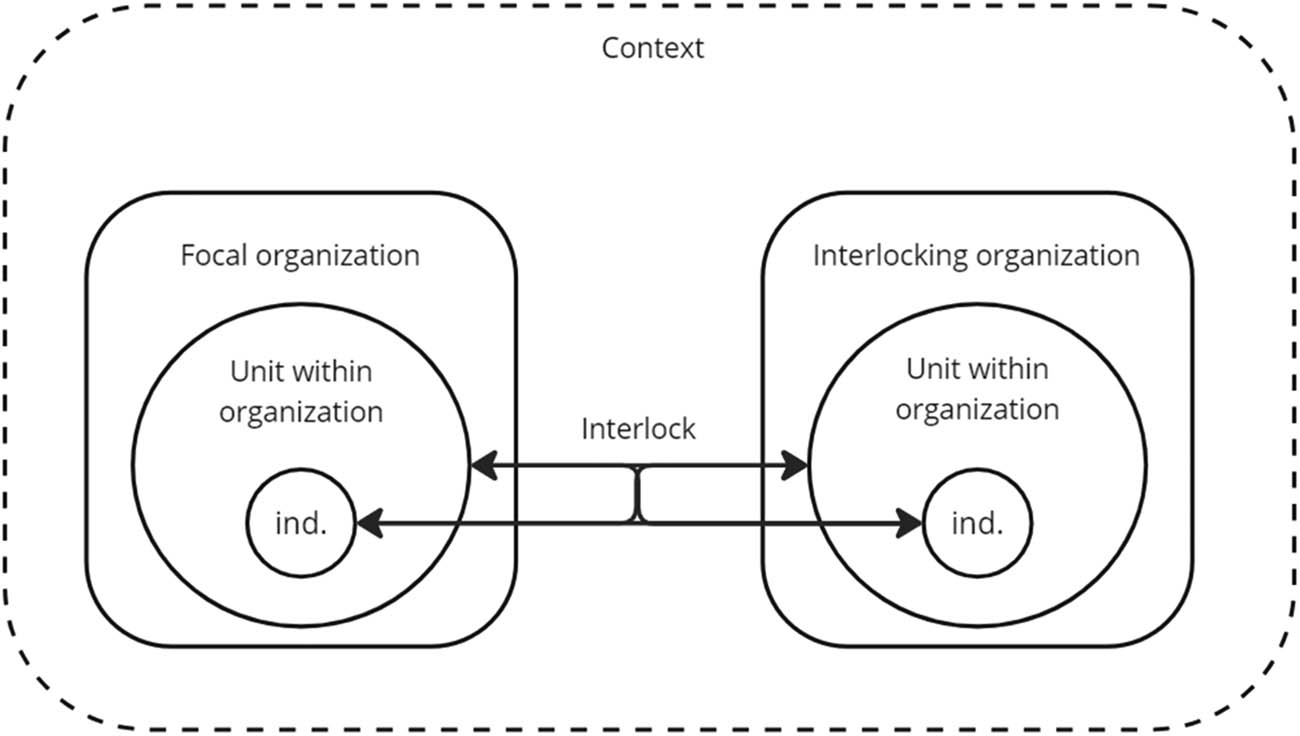
Figure 1
Boundary specification of the term “interlock”.
Source: Author’s contribution.
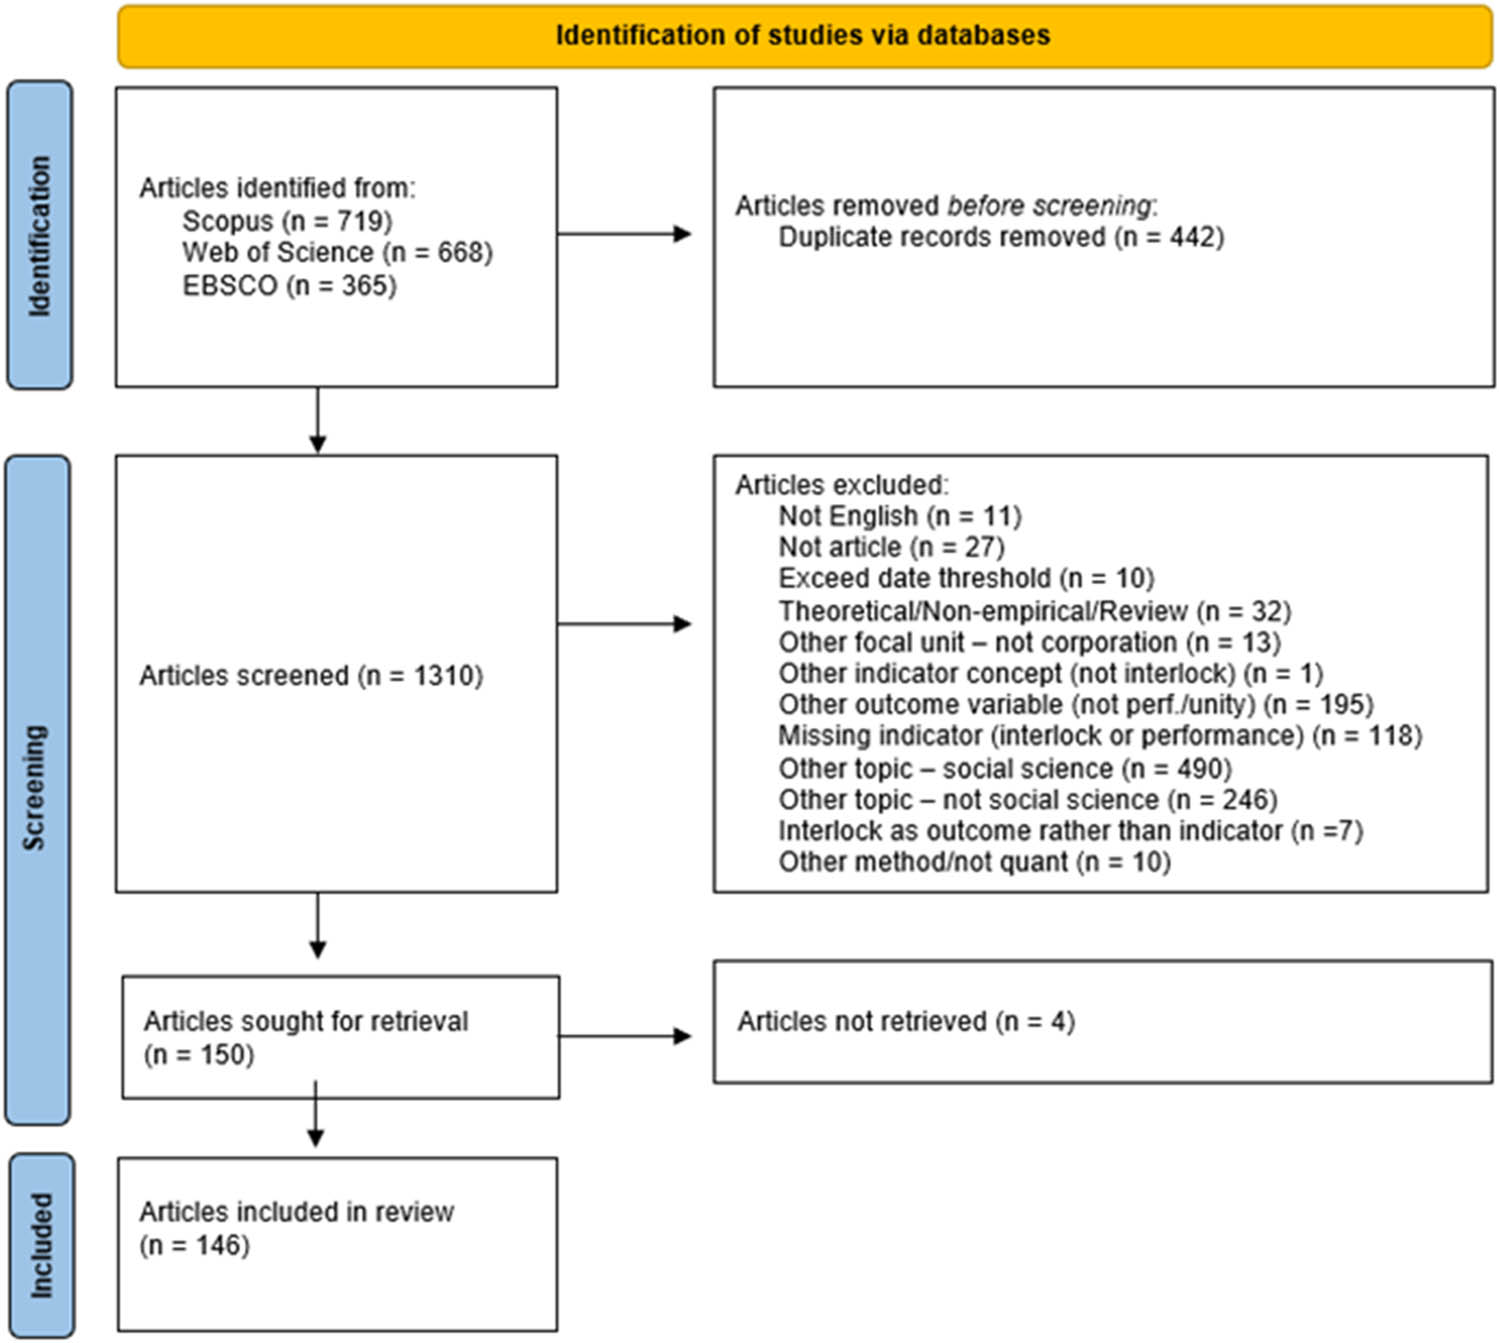
Figure 2
PRISMA diagram.
Source: Author’s own analysis and data. Figure adapted from the PRISMA 2020 flow diagram template (Page et al., 2021), licensed under CC BY 4.0.
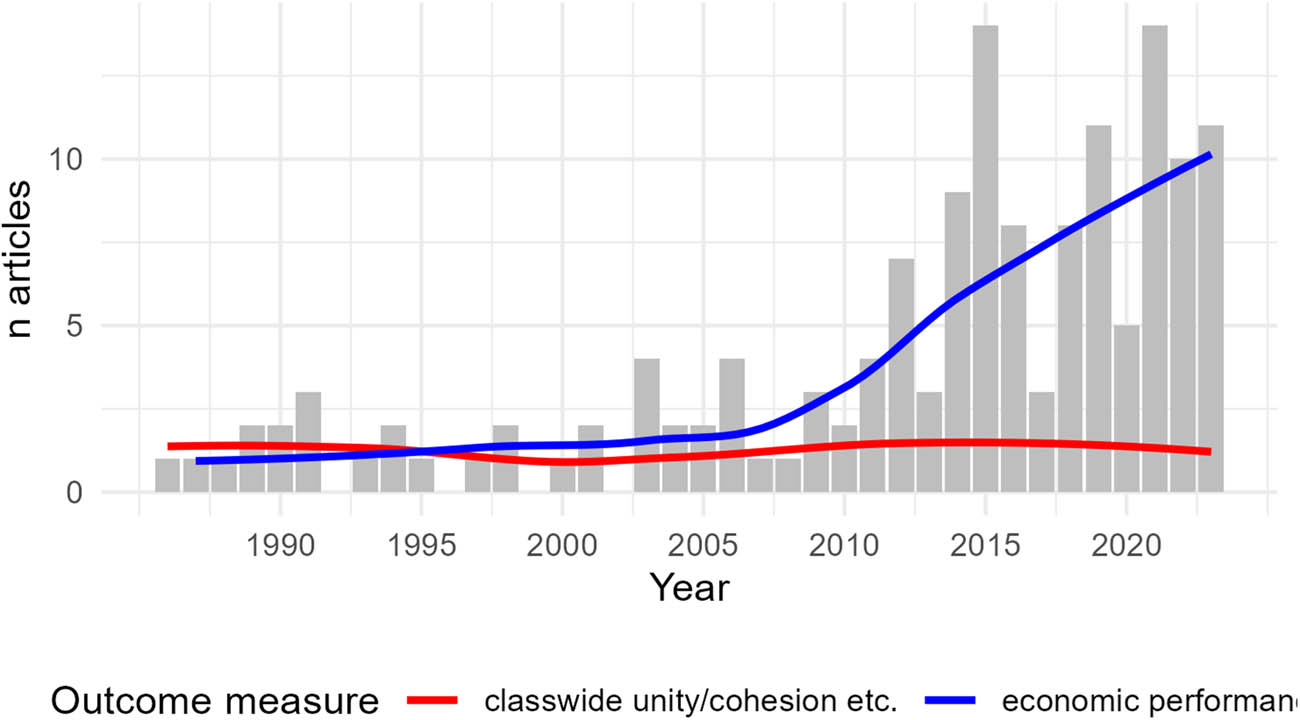
Figure 3
“Articles in sample per year.”
Source: Author’s contribution.
Table 2
Main theoretical frameworks of the sampled papers.
| Economic outcome | Cohesion as outcome | Total | ||||
|---|---|---|---|---|---|---|
| n | % | n | % | n | % | |
| Agency theory | 35 | 30 | 1 | 4 | 36 | 25 |
| Resource dependence theory | 48 | 41 | 3 | 11 | 51 | 35 |
| Social network analysis | 16 | 14 | 0 | 0 | 16 | 11 |
| Hegemony | 4 | 3 | 24 | 86 | 28 | 19 |
| Other | 15 | 13 | 7 | 25 | 22 | 15 |
| None | 16 | 14 | 1 | 4 | 17 | 12 |
| N Papers | 118 | 100 | 28 | 100 | 146 | 100 |
Source: Author’s contribution.
Table 3
Operationalizations of interlocks grouped by boundary conditions.
| Operationalization: What constitutes the interlock? | N | Pct. |
| Interlocking organization | ||
| Not clearly specified (but probably firms) | 22 | 15% |
| Firm | 108 | 74% |
| (Firm) + Political Party/ Government/Organization | 16 | 11% |
| Unit within the focal firm | ||
| Not specified/Ambiguous (often “directors”) | 29 | 20% |
| Board | 96 | 66% |
| Board + Executive(s) | 8 | 5% |
| Management/Executive(s) | 10 | 7% |
| Committee | 3 | 2% |
| Unit within the interlocking organization | ||
| Not specified/Ambiguous (often “directors”) | 63 | 43% |
| Board | 64 | 43% |
| Board + Executive(s) | 7 | 5% |
| Management/Executives | 4 | 3% |
| Committee | 3 | 2% |
| Other (position, auditors, etc.) | 5 | 3% |
| Individuals within the focal firm | ||
| Links from one single individual (CEO, Board chair) | 9 | 8% |
| Individuals added to the sampled individuals (adding the CEO, siblings, etc.) | 7 | 6% |
| Individual traits used to restrict individuals in the sample (independent board members, female-only) | 10 | 8% |
| Individuals within the interlocking organization | ||
| Specific individual (CEO, Board Chair, Proprietary director) | 3 | 3% |
| Individuals added to the sampled individuals (CEO) | 6 | 5% |
| Individual traits used to restrict individuals in the sample (independent board members, family relations with the focal firm) | 5 | 4% |
Source: Author’s contribution.
Table 4
Operationalizations of interlocks grouped by type of empirical measure.
| Operationalizations – which measure?* | N | Pct. |
|---|---|---|
| Focal firm: Dummy measures | ||
| Interlock dummy (specific individual) | 10 | 7% |
| Interlock dummy (org. level) | 33 | 23% |
| Total papers using dummy measures | 39 | 27% |
| Focal firm: Individual-level count and busy measures | ||
| N connections (degree) at the individual-level (squared and average measures included) | 19 | 13% |
| Busy director threshold | 12 | 8% |
| Total papers using individual-level count and busy measures | 32 | 22% |
| Focal firm: Firm-level count measures | ||
| N connections (degree) at the firm/unit level (squared and weighted measures included) | 61 | 42% |
| Percentage of unit interlocked | 10 | 7% |
| Total papers using focal firm organizational level count measures | 71 | 49% |
| Interlocking firm: Contextual measures | ||
| Interlock with non-firm: political/governmental/trade association ties | 11 | 8% |
| Inter-/Intra-industry interlocks | 12 | 8% |
| Performance of an interlocked firm (profitability, penalized firm, etc.) | 7 | 5% |
| Interlock with a bank/financial institution | 11 | 8% |
| “Vertical interlock”/business group interlock | 7 | 5% |
| Total papers using contextual measures on interlocked organization | 45 | 31% |
| Network measures** | ||
| Structural hole: Betweenness, Burt’s constraint | 17 | 12% |
| Well-connected neighbors: Eigenvector centrality, Bonacich Power | 16 | 11% |
| Global network measures: Closeness, clustering coefficient, cliques, K-core | 12 | 8% |
| Total papers deploying network measures | 28 | 19% |
*As papers often have more than one operationalization and thus measures of interlocks, the counts of operationalizations do not summarize the total number of papers included.
**Although many papers conceptualize the number of connections of the focal firm in network terms as degree centrality, degree centrality is not grouped under network operationalizations but instead grouped under count operationalizations.
Source: Author’s contribution.
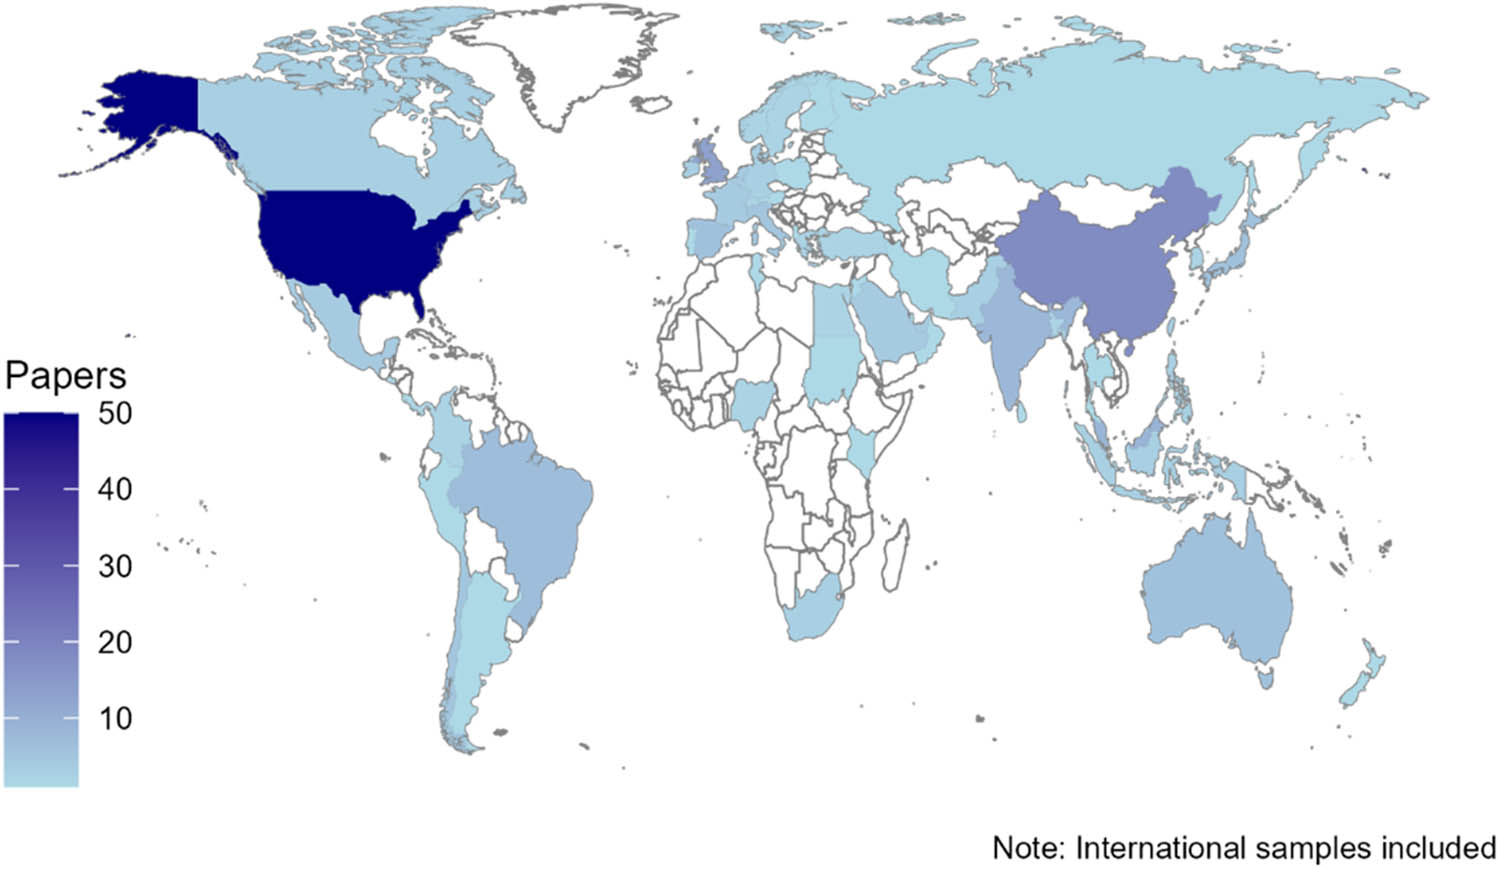
Figure 4
“Articles in sample per country”.
Source: Author’s contribution.
Table 5
“Articles per region.”
| Region | N | Percent |
|---|---|---|
| Africa | 1 | 1% |
| Anglo-Saxon* | 64 | 44% |
| Asia** | 40 | 27% |
| Europe | 18 | 12% |
| Middle East | 2 | 1% |
| South America | 14 | 10% |
| Trans-national | 7 | 5% |
| Total | 146 | 100% |
*of which 46 papers study the USA (accounting for 32% of the total sample).
**of which 15 papers study China (accounting for 12% of the total sample).
Source: Author’s contribution.
Table 6
Roadmap for enhancing construct clarity in empirical measures of interlocks.
| Theoretical framework | Theoretical (sub)construct | Boundary specification | Empirical measures |
|---|---|---|---|
| Agency theory | Busy directors | All simultaneous positions of board members across sectors | Individual-level measures:
|
| Busy boards | All simultaneous positions of board members across sectors | Board-level measure:
| |
| Board independence | Within-company mapping of managers on the board |
| |
| Vertical interlocks | Board and/or management interlocks between a controlling shareholder and a subsidiary listed firm |
| |
| Family/kinship interlock | Board and/or management interlocks between firms in a family business group | ||
| Resource dependence theory | Cooptation | Board and/or management interlocks with organizations of choice. The relevance of an interlocking organization (firm, financial institution, state agency, etc.) will depend on the case |
|
Monitoring
| Focal firm receiving a manager from x organizations of interest on the board. A focal firm receiving a manager from a financial organization (often as a lending financial institution) to its board | Interlocks with specific monitoring organizations measured as a dummy variable, such as:
| |
| Social network theory | Centrality | Boundary specification will depend on the case and research interest |
|
| Structural hole |
| ||
| Well-connected neighbors |
| ||
| Bipartite interlock network |
| ||
| Class hegemony theory | “Power elite” interlocks | Managers’ and board members’ positions in organizations across sectors (firms, government bodies, trade organizations, etc.) |
|
| “Inner circle” interlocks | Managers’ and board members’ positions in companies |
| |
| Transnational interlocks (transnational capitalist class) | Managers’ and board members’ positions in international organizations across sectors |
|
Source: Author’s contribution.
| Africa | Anglo-Saxon | Asia | Europe | Middle East | South America | Trans-regional | Total | |||||||||
|---|---|---|---|---|---|---|---|---|---|---|---|---|---|---|---|---|
| n | % | n | % | n | % | n | % | n | % | n | % | n | % | n | % | |
| Agency theory | 1 | 100 | 12 | 19 | 11 | 28 | 6 | 33 | 2 | 100 | 2 | 14 | 2 | 29 | 36 | 25 |
| Resource dependence theory | 0 | 0 | 18 | 28 | 19 | 48 | 8 | 44 | 2 | 100 | 3 | 21 | 1 | 14 | 51 | 35 |
| Social network analysis | 0 | 0 | 5 | 8 | 8 | 20 | 1 | 6 | 0 | 0 | 1 | 7 | 1 | 14 | 16 | 11 |
| Hegemony | 0 | 0 | 22 | 34 | 2 | 5 | 0 | 0 | 0 | 0 | 2 | 14 | 2 | 29 | 28 | 19 |
| Other | 0 | 0 | 14 | 22 | 6 | 15 | 2 | 11 | 0 | 0 | 0 | 0 | 0 | 0 | 22 | 15 |
| None | 0 | 0 | 4 | 6 | 4 | 10 | 2 | 11 | 0 | 0 | 6 | 43 | 1 | 14 | 17 | 12 |
| Total | 1 | 100 | 64 | 100 | 40 | 100 | 18 | 100 | 2 | 100 | 14 | 100 | 7 | 100 | 146* | 100 |
| Africa | Anglo-Saxon | Asia | Europe | Middle East | South America | Trans-regional | Total | ||
|---|---|---|---|---|---|---|---|---|---|
| Focal firm | n | 0 | 16 | 13 | 2 | 1 | 5 | 2 | 39 |
| Dummy measures | % | 0% | 25% | 33% | 11% | 50% | 36% | 29% | 27% |
| Focal firm | n | 1 | 14 | 7 | 5 | 1 | 3 | 1 | 32 |
| Ind. level count | % | 100% | 22% | 18% | 28% | 50% | 21% | 14% | 22% |
| Focal firm | n | 0 | 28 | 21 | 10 | 2 | 6 | 4 | 71 |
| Firm level count | % | 0% | 44% | 53% | 56% | 100% | 43% | 57% | 49% |
| Interlocking firm | n | 0 | 24 | 11 | 4 | 0 | 2 | 4 | 45 |
| Contextual | % | 0% | 38% | 28% | 22% | 0% | 14% | 57% | 31% |
| Network | n | 0 | 9 | 10 | 2 | 0 | 6 | 1 | 28 |
| Measures | % | 0% | 14% | 25% | 11% | 0% | 43% | 14% | 19% |
| Total papers | n | 1 | 64 | 40 | 18 | 2 | 14 | 7 | 146 |
| % | 1% | 44% | 27% | 12% | 1% | 10% | 5% | 100% |
| Operationalization type | N | Positive findings | Negative findings | Mixed findings | Insignificant findings |
|---|---|---|---|---|---|
| Focal firm dummy measures | 28 (100%) | 6 (21%) | 7 (25%) | 8 (29%) | 7 (25%) |
| Individual-level count and busy measures | 27 (100%) | 9 (33%) | 8 (30%) | 6 (22%) | 4 (15%) |
| Organizational-level count measures | 59 (100%) | 34 (58%) | 5 (8%) | 8 (13%) | 14 (24%) |
| Network measures | 24 (100%) | 13 (54%) | 0 (0%) | 6 (25%) | 4 (17%) |