
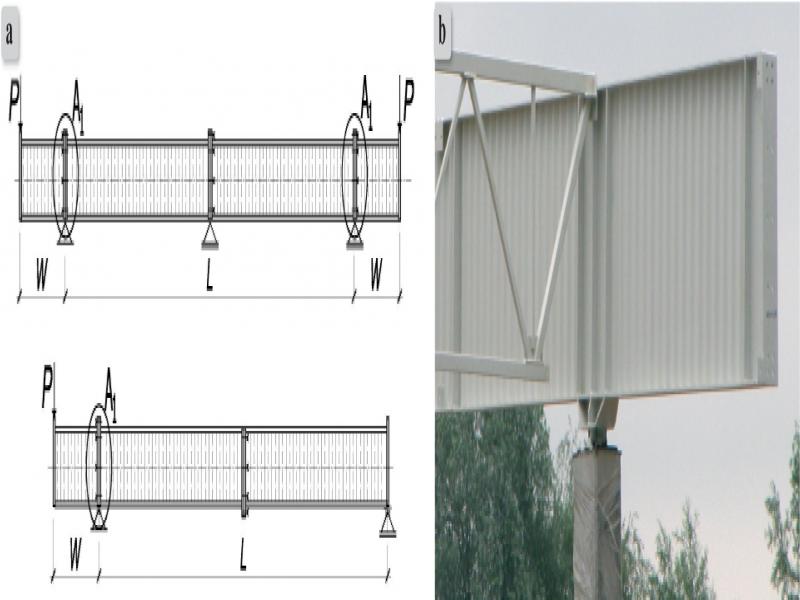
Figure 1.
Cantilever SIN girders: a) static scheme, b) flat plates on the support in the SIN girder
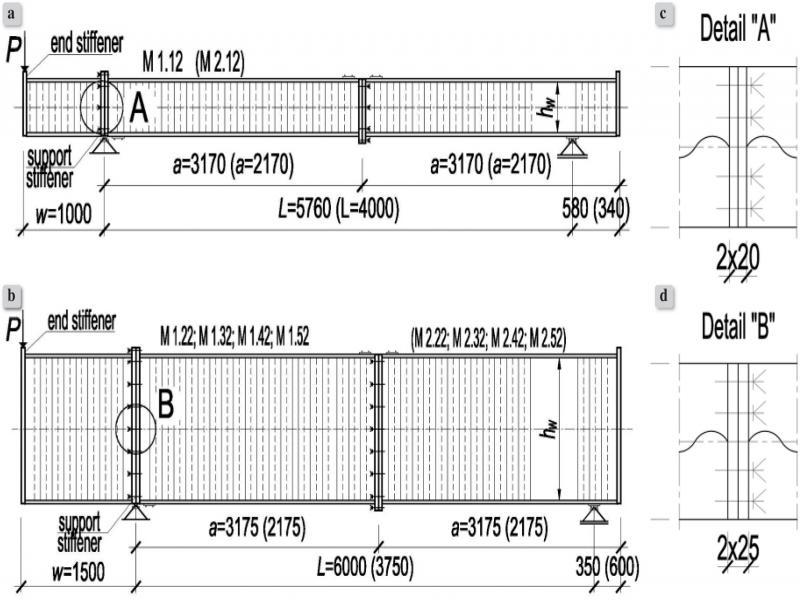
Figure 2.
Cantilever girders with corrugated web a) models M 1.12, M 2.12 b) models M 1.22, M 1.32, M 1.42, M 1.52, M 2.22, M 2.32, M 2.42, M 2.52; c) d) end stiffeners
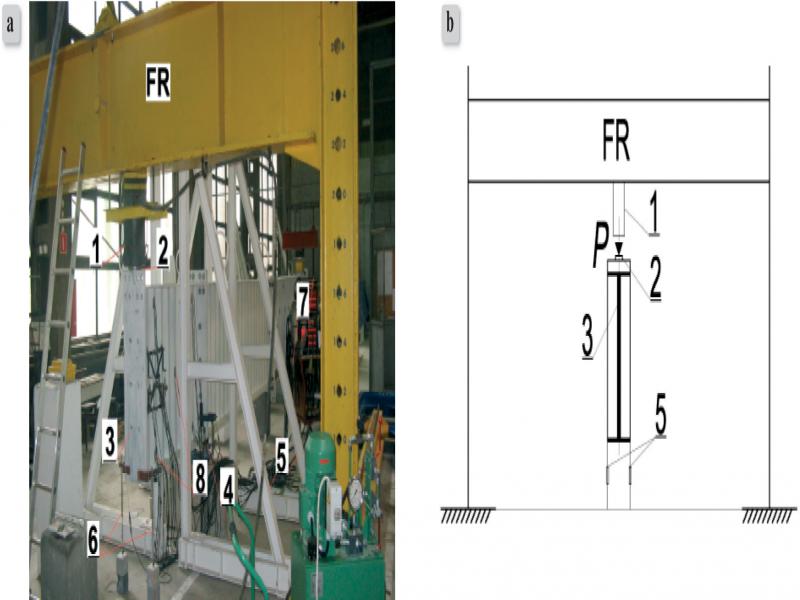
Figure 3.
a) Girder 2.32 on the test stand; b) steel frame FR
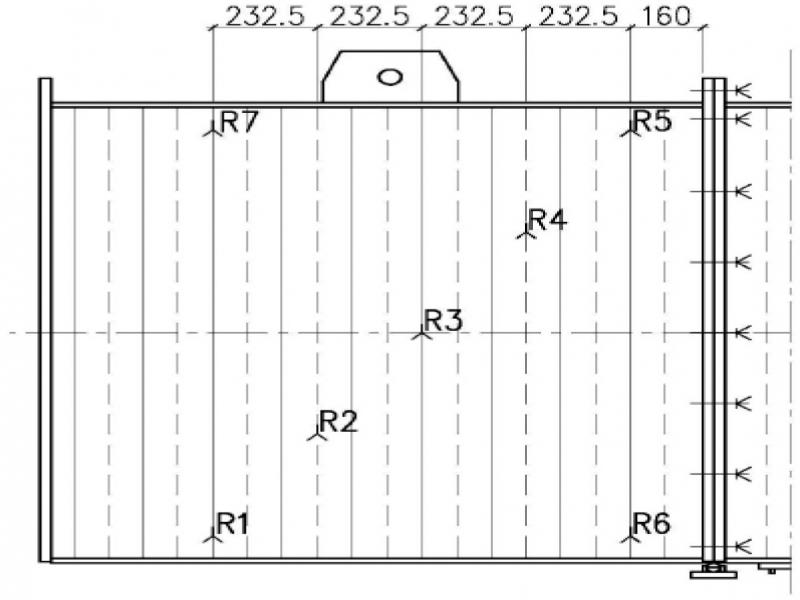
Figure 4.
Location of strain gauges on the girder web M 2.52
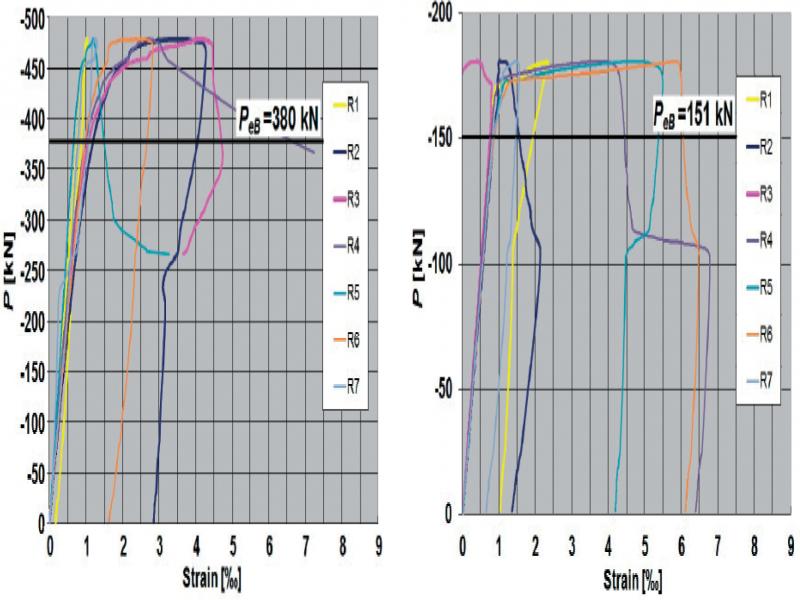
Figure 5.
Strain in the direction 60° relative to the axis of the web a) girder M 1.32; b) girder M 2.12
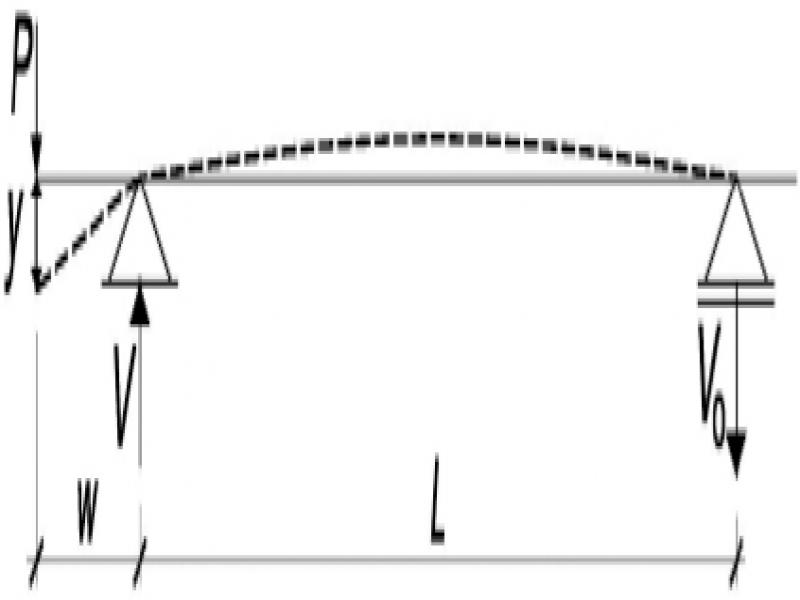
Figure 6.
Diagram of global displacements y of tested girders
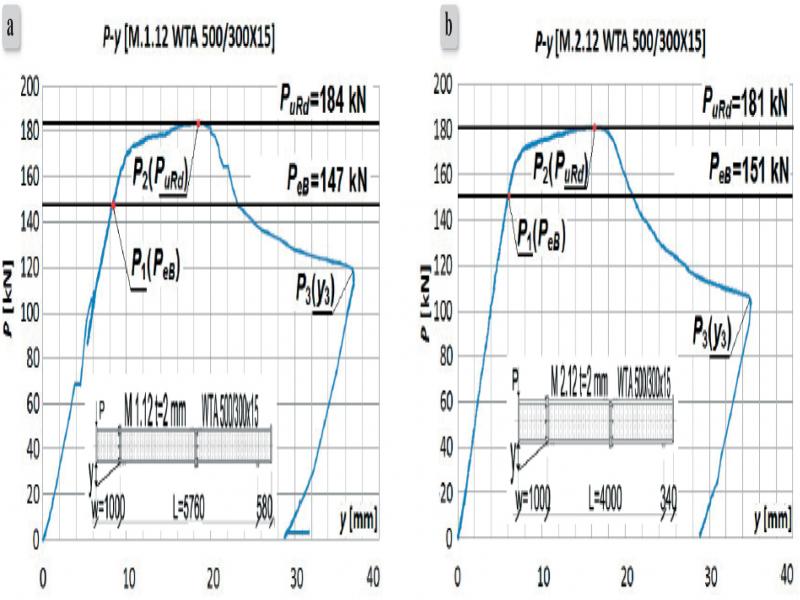
Figure 7.
Load – displacements paths P(y) of girders a) M 1.12 (2×300×20); b) M 2. 12 (2×300×20 mm)
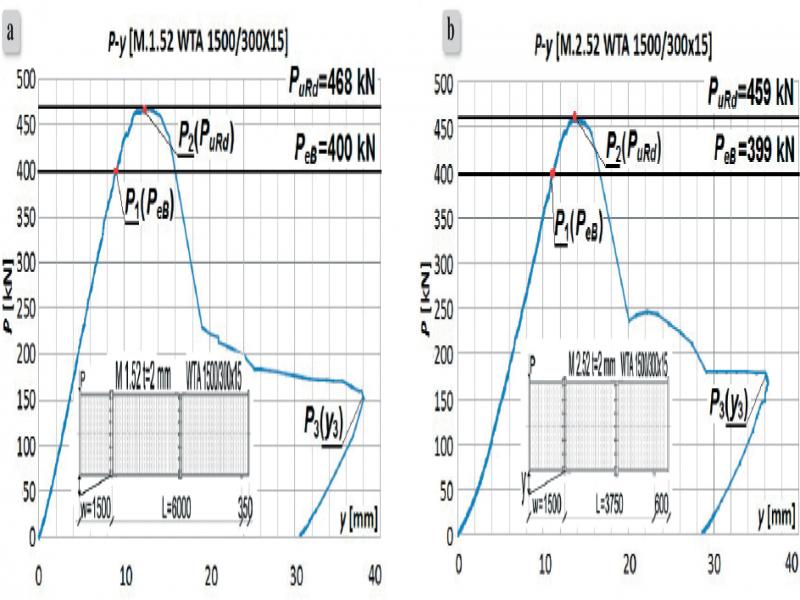
Figure 8.
Load – displacements paths P(y) of girders a) M 1.52 (2×300×25 mm); b) M 2. 52 (2×300×25 mm)
Table 1.
Experimental results of girders
| Girder | Web hw x tw [mm] | Flange [mm] | Suport stiffener | Failure modes | Limit load PeB [kN] | First buckling load Pu,Rd [kN] | PeB /Pu,Rd [%] |
|---|---|---|---|---|---|---|---|
| 2 | 3 | 4 | 5 | 6 | 7 | 8 | 9 |
| M 1.12 | 500×2 | 300×15 | 2×300×20 | L | 184 | 147 | 0.80 |
| M 2.12 | 500×2 | 300×15 | 2×300×25 | L | 181 | 151 | 0.82 |
| M 1.22 | 1000×2 | 300×20 | 2×300×25 | I | 342 | 298 | 0.87 |
| M 2.22 | 1000×2 | 300×15 | 2×300×25 | L | 343 | 296 | 0.86 |
| M 1.32 | 1000×2.6 | 300×20 | 2×300×25 | I | 478 | 380 | 0.79 |
| M 2.32 | 1000×2.6 | 300×15 | 2×300×25 | I | 492 | 390 | 0.79 |
| M 2.42 | 1000×3 | 300×15 | 2×300×25 | I | 694 | 510 | 0.73 |
| M 1.42 | 1250×2 | 300×15 | 2×300×25 | I | 348 | 304 | 0.87 |
| M 1.52 | 1500×2 | 300×15 | 2×300×25 | I | 468 | 400 | 0.85 |
| M 2.52 | 1500×2 | 300×15 | 2×300×25 | I | 459 | 399 | 0.87 |
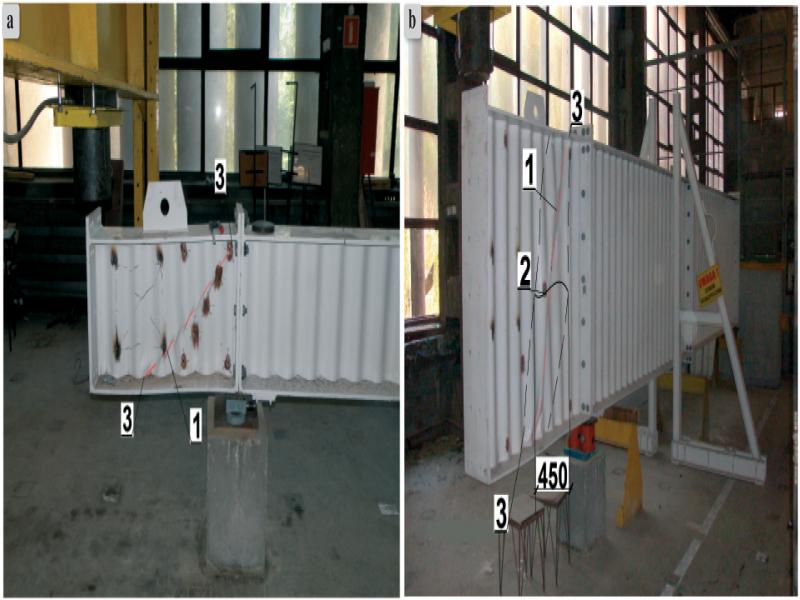
Figure 9.
Failure modes of cantilever SIN girders: a) M 1.12 (2×300×20 mm); b) M 2. 52 (2×300×25 mm)
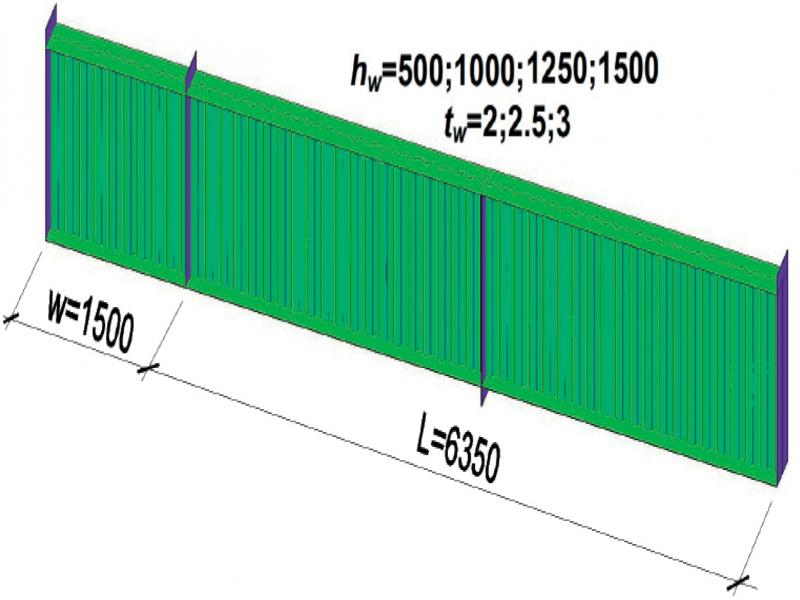
Figure 10.
Numerical models
Table 2.
Current numerical program
| hw [mm] | tw [mm] | Flange [mm] | Suport stiffener [mm] | w [mm] | L [mm] | Number of models |
|---|---|---|---|---|---|---|
| 1 | 2 | 3 | 4 | 5 | 7 | 8 |
| 500 | 2; 2.6; 3 | 300×15 | 2×300×20 | 1500 | 6350 | 3 |
| 1000 | 2; 2.6; 3 | 300×15 | 2×300×25 | 1500 | 6350 | 3 |
| 1250 | 2; 2.6; 3 | 300×15 | 2×300×25 | 1500 | 6350 | 3 |
| 1500 | 2; 2.6; 3 | 300×15 | 2×300×25 | 1500 | 6350 | 3 |
Table 3.
Material properties
| Girder | [MPa] | [MPa] | Percentage total elongation at maximum force (Fm ) [%] | Percentage total elongation at fracture [%] | [MPa] | [MPa] | Percentage total elongation at maximum force (Fm ) [%] | Percentage total elongation at fracture [%] | E [GPa] |
|---|---|---|---|---|---|---|---|---|---|
| web | flange | ||||||||
| 1 | 2 | 3 | 4 | 5 | 6 | 7 | 8 | 9 | 10 |
| M 1.12 | 334.7 | 430.6 | 16.1 | 22.1 | 297.5 | 443.1 | 23.9 | 30.3 | 196 |
| M 2.12 | 337.9 | 429.1 | 15.7 | 20.8 | 311.2 | 476.7 | 24.5 | 30.8 | 188 |
| M 1.22 | 339.4 | 435.4 | 15.9 | 22.2 | 287.2 | 448 | 24.1 | 31.4 | 200 |
| M 2.22 | 336.3 | 427.3 | 14.9 | 22.5 | 323.5 | 461.4 | 23.1 | 29.6 | 234 |
| M 1.32 | 312.5 | 453.9 | 13.8 | 20.2 | 264.2 | 460.9 | 22.6 | 28.0 | 199 |
| M 2.32 | 324.6 | 451.5 | 13.6 | 19.2 | 293.9 | 442.1 | 25.1 | 32.3 | 241 |
| M 2.42 | 445.9 | 544.1 | 10.7 | 14.6 | 301.5 | 439.8 | 21.3 | 27.7 | 205 |
| M 1.42 | 267.2 | 360.9 | 13.4 | 19.9 | 302.8 | 440.4 | 22.9 | 30.8 | 199 |
| M 1.52 | 299.1 | 380.5 | 16.8 | 23.3 | 312.5 | 445.6 | 24.1 | 30.0 | 200 |
| M 2.52 | 281.0 | 375.5 | 17.2 | 24.6 | 306.7 | 449.3 | 21.9 | 28.6 | 203 |
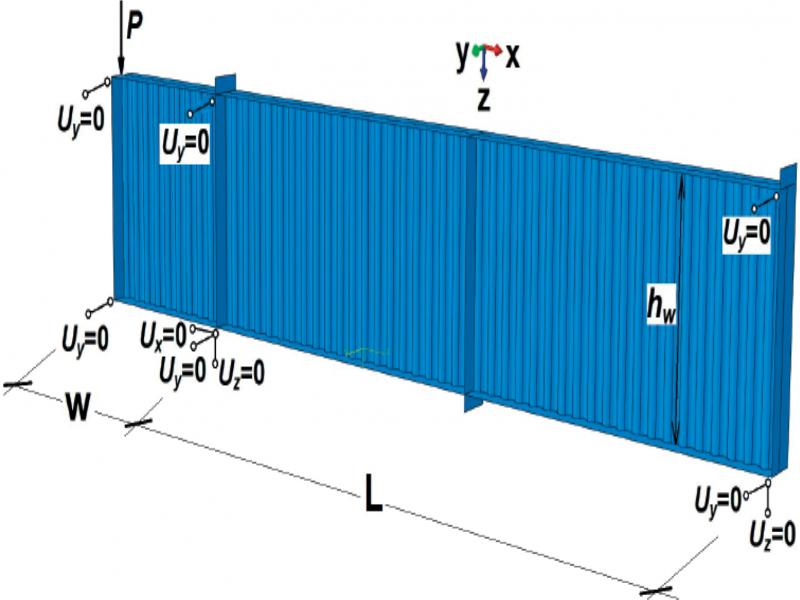
Figure 11.
Boundary conditions and load application to numerical model
Table 4.
Numerical results of girders
| Girder h w x t w [mm] | Support Stiffener | Failure modes | Limit load P u,Rd [kN] | First buckling load P eB [kN] | P eB /P u,Rd [%] |
|---|---|---|---|---|---|
| 1 | 2 | 3 | 4 | 5 | 6 |
| 500×2 | 2×300×20 | L | 154.1 | 149.1 | 0.97 |
| 500×2.5 | 2×300×20 | L | 192.2 | 186.8 | 0.97 |
| 500×3 | 2×300×20 | L | 231.3 | 224.6 | 0.97 |
| 1000×2 | 2×300×25 | L | 308.1 | 297.2 | 0.96 |
| 1000×2.5 | 2×300×25 | I | 384.3 | 371.3 | 0.97 |
| 1000×3 | 2×300×25 | I | 462.2 | 445.3 | 0.96 |
| 1250×2 | 2×300×25 | I | 384.6 | 360.1 | 0.94 |
| 1250×2.5 | 2×300×25 | I | 480.4 | 449.9 | 0.94 |
| 1250×3 | 2×300×25 | I | 576.5 | 539.5 | 0.94 |
| 1500×2 | 2×300×25 | I | 460.8 | 419.2 | 0.91 |
| 1500×2.5 | 2×300×25 | I | 575.6 | 531.9 | 0.92 |
| 1500×3 | 2×300×25 | I | 687.5 | 635.7 | 0.92 |
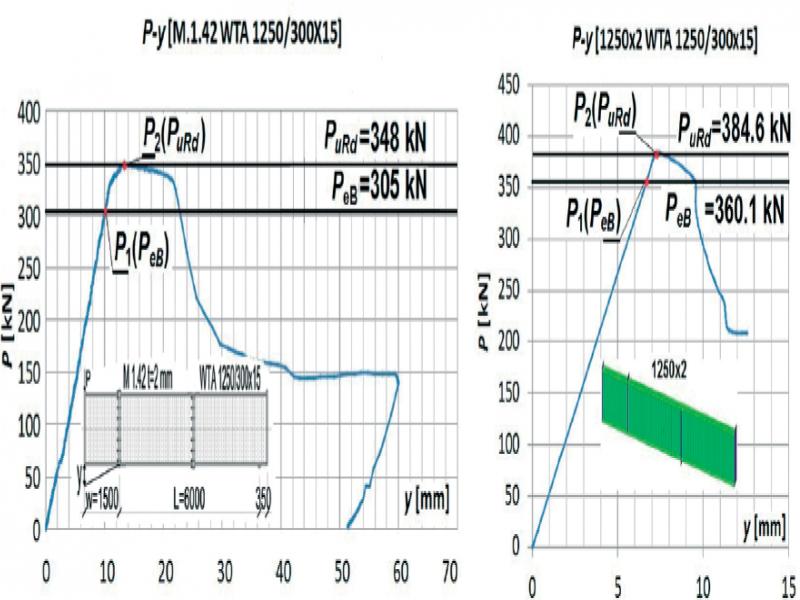
Figure 12.
Comparison of LDPs P(y): a) tests M 1.42; b) FEM 1250×2
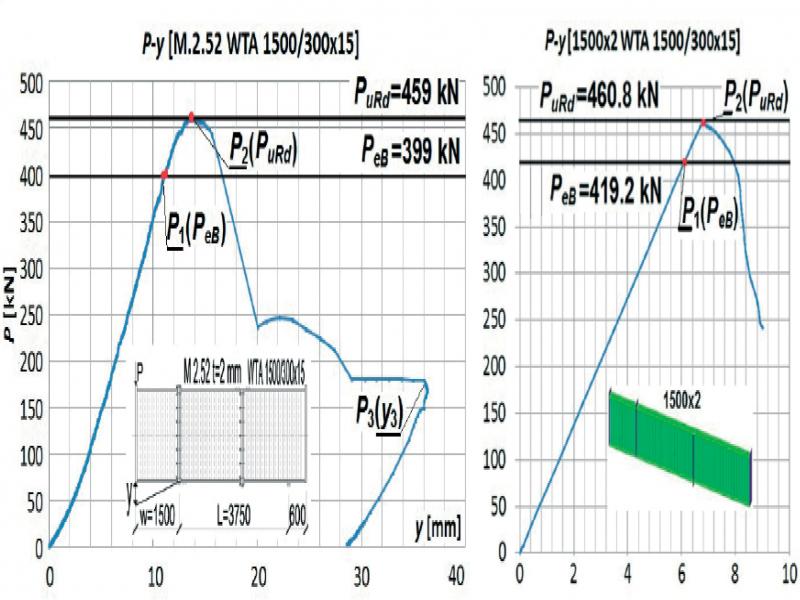
Figure 13.
Comparison of LDPs P(y): a) test M 2.52; b) FEM 1500×2
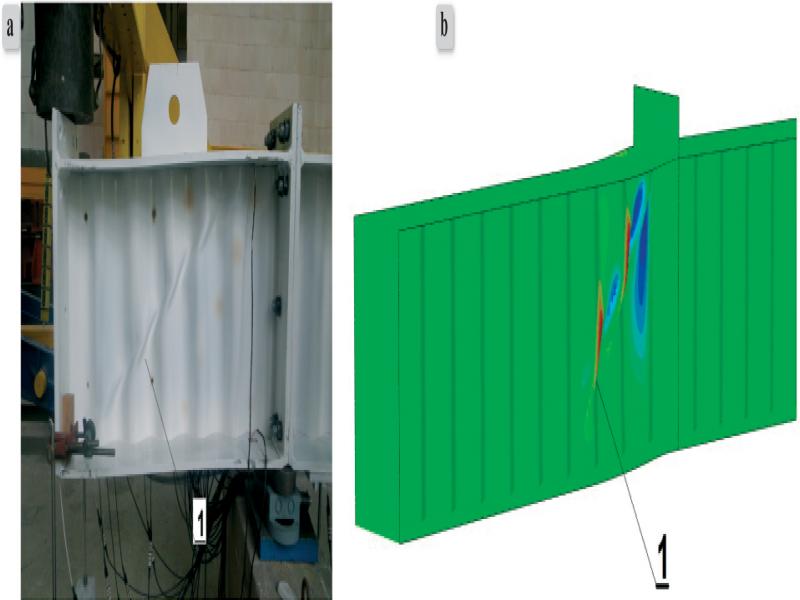
Figure 14.
Comparison of failure modes: a) experimental girder M 1.12 (500×2: stiffener 2×300×20); b) numerical model 500×2 (stiffener: 2×300×20)
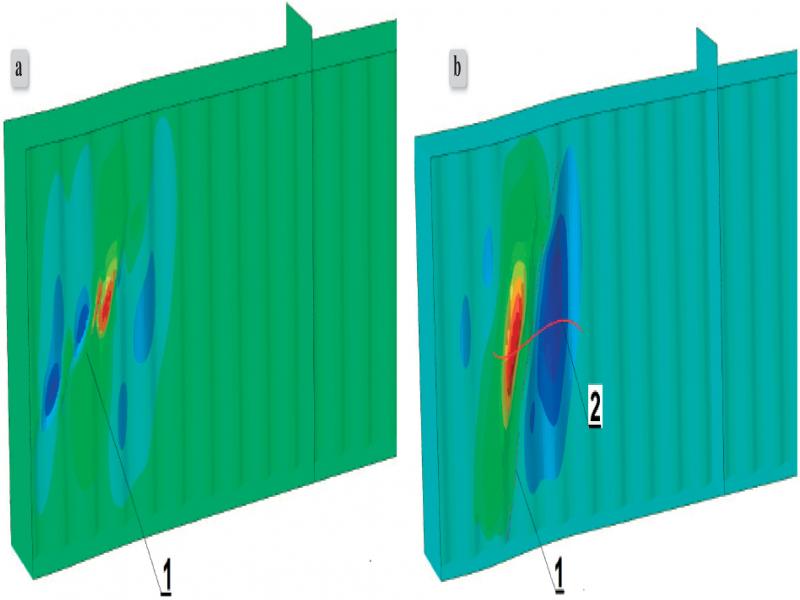
Figure 15.
Failure modes of numerical models: a) 1000×2 (stiffener 2×300×25); b) 1000×2.5 (stiffener 2×300×25)
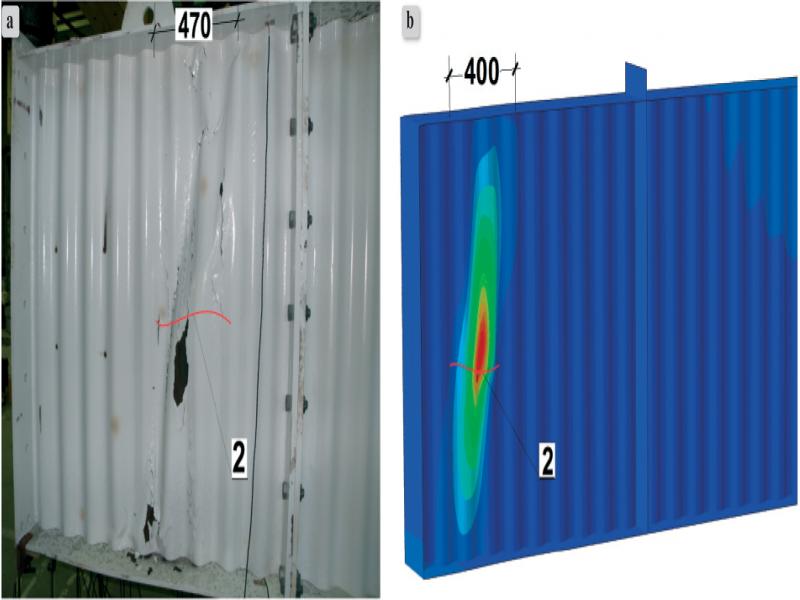
Figure 16.
Comparison of failure modes: a) experimental girder M 1.52 (1500×2: stiffener 2×300×25); b) numerical model 1500×2 (stiffener: 2×300×25)
Table 5.
| Girder hw x tw [mm] | τINV [MPa] | τFEM [MPa] | |||||||
|---|---|---|---|---|---|---|---|---|---|
| 1 | 2 | 3 | 4 | 5 | 6 | 7 | 8 | 9 | 10 |
| 500×2 | 147.0 | 149.1 | 0.80 | 0.92 | 0.79 | 0.86 | 0.86 | 1.09 | 0.93 |
| 500×2.5 | 149.4 | 0.92 | 0.79 | 0.91 | 0.86 | 0.93 | |||
| 500×3 | 149.7 | 0.92 | 0.79 | 0.95 | 0.86 | 0.93 | |||
| 1000×2 | 149.0 | 148.6 | 0.78 | 0.92 | 0.79 | 0.83 | 0.86 | 1.10 | 0.94 |
| 1000×2.5 | 152.0 | 148.5 | 0.90 | 0.92 | 0.79 | 0.88 | 0.86 | 0.96 | 0.94 |
| 1000×3 | 170.0 | 148.4 | 0.75 | 0.91 | 0.79 | 0.93 | 0.86 | 1.26 | 0.94 |
| 1250×2 | 121.6 | 144.0 | 0.86 | 0.89 | 0.79 | 0.82 | 0.85 | 1.01 | 0.96 |
| 1250×2.5 | 144.0 | 0.89 | 0.79 | 0.88 | 0.85 | 0.96 | |||
| 1250×3 | 143.9 | 0.89 | 0.79 | 0.92 | 0.86 | 0.96 | |||
| 1500×2 | 133.0 | 139.7 | 0.88 | 0.86 | 0.79 | 0.82 | 0.84 | 0.96 | 0.98 |
| 1500×2.5 | 141.8 | 0.87 | 0.79 | 0.87 | 0.85 | 0.97 | |||
| 1500×3 | 141.3 | 0.87 | 0.79 | 0.92 | 0.85 | 0.97 | |||
| AVG. | 0.83 | 0.90 | 0.79 | 0.88 | 0.85 | 1.06 | 0.95 |
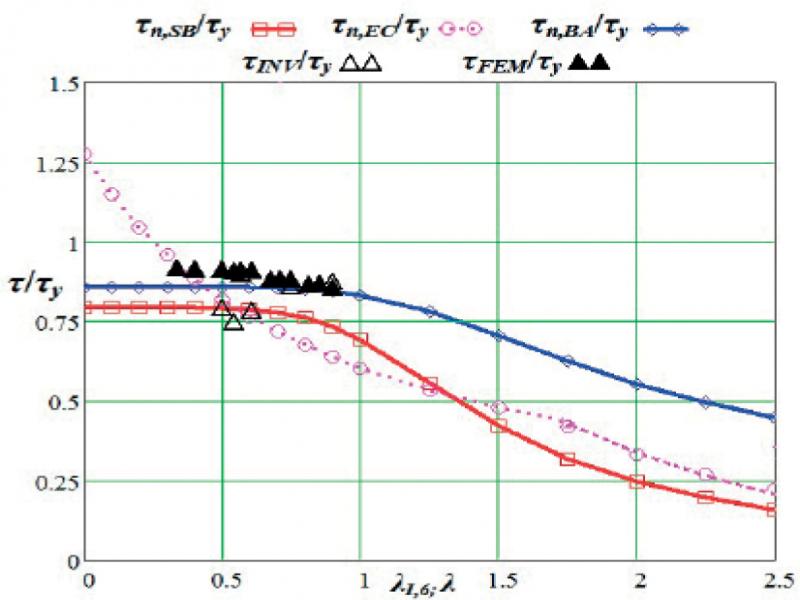
Figure 17.
Normalized shear resistance in function of the slenderness