
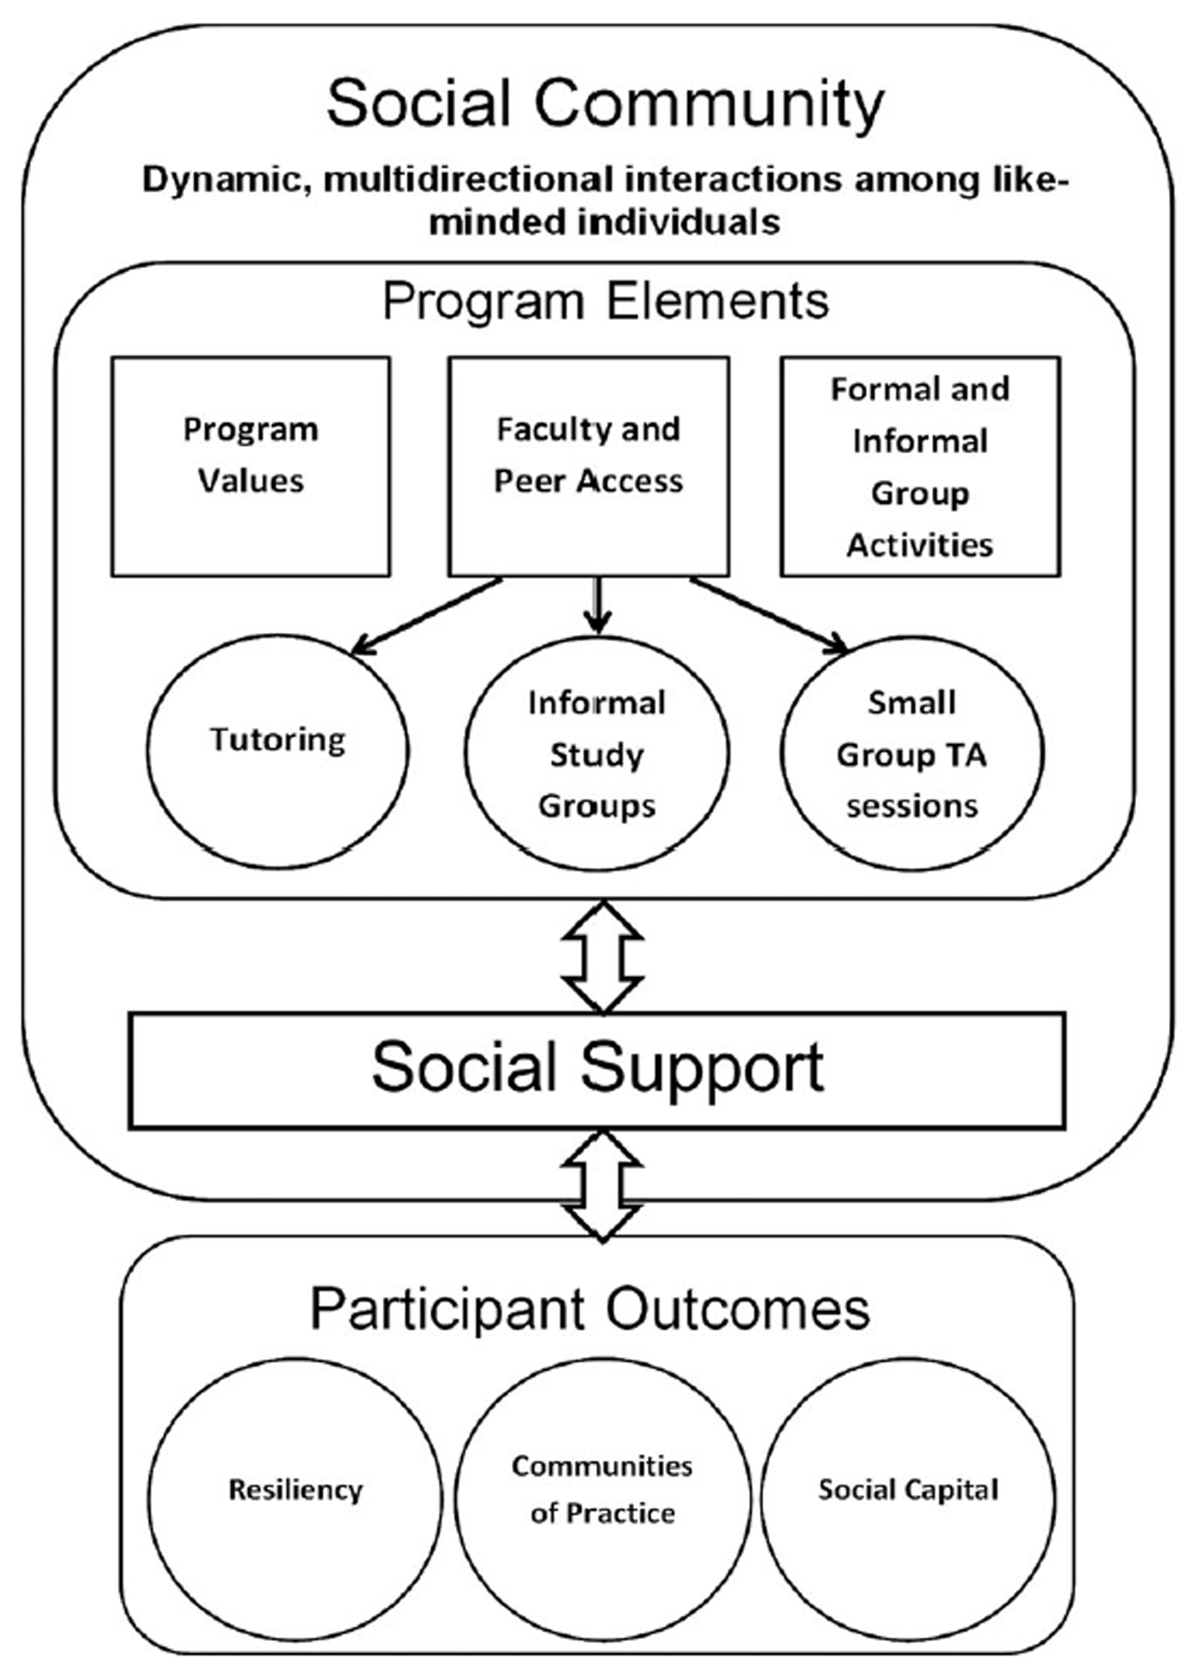
Figure 1
Social Community Framework from Mondisa & McComb (2015, reprinted with permission).
Table 1
Race/Ethnicity: Survey Respondents from 2016–2019 Cohorts.
| ASIAN | LATINX/HISPANIC | WHITE | AMERICAN INDIAN/ALASKAN NATIVE | BLACK/AFRICAN AMERICAN | |
|---|---|---|---|---|---|
| ACES (n = 24) | 44% | 48% | 4% | 0% | 0% |
| IDEA (n = 56) | 45% | 45% | 25% | 2% | 2% |
| SEI Only (n = 24) | 68% | 4% | 24% | 0% | 0% |
| Comparison (n = 150) | 71% | 13% | 23% | 0% | 0% |
[i] Note: Totals may exceed 100% because multiple categories selected.
Table 2
First-Generation & Pell Eligibility: Survey Respondents from 2016–2019 Cohorts.
| FIRST-GENERATION | PELL GRANT ELIGIBLE | |
|---|---|---|
| ACES (n = 24) | 71% | 92% |
| IDEA (n = 56) | 48% | 43% |
| SEI Only (n = 24) | 8% | 13% |
| Comparison (n = 150) | 25% | 27% |
[i] Note: Totals may exceed 100% because multiple categories selected.
Table 3
Gender: Survey Respondents from 2016–2019 Cohorts.
| MAN | NON-BINARY/TRANSGENDER | WOMAN | MISSING | |
|---|---|---|---|---|
| ACES (n = 25) | 44% | 0% | 52% | 4% |
| IDEA (n = 56) | 38% | 2% | 61% | 0% |
| SEI Only (n = 25) | 84% | 4% | 12% | 0% |
| Comparison (n = 150) | 58% | 2% | 41% | 0% |
Table 4
Which aspects of the Scholars program supported your success the MOST? Top 3 ranking.
| ACES (n = 25) | IDEA (n = 56) | |
|---|---|---|
| Summer Engineering Institute* | 88% | 98% |
| Weekly Scholar Discussions | 16% | 20% |
| Cohort of Peer Scholars* | 60% | 61% |
| IDEA Center Advising/Staff* | 28% | 64% |
| Peer Mentoring (ACES)/Big-Little (IDEA) | 4% | 25% |
| Faculty Mentoring (ACES Only) | 32% | n/a |
| Professional Development Workshops | 16% | 14% |
| Other | 8% | 13% |
[i] * Aspects of the program that were mentioned by at least 60% of respondents in either of the scholar programs.
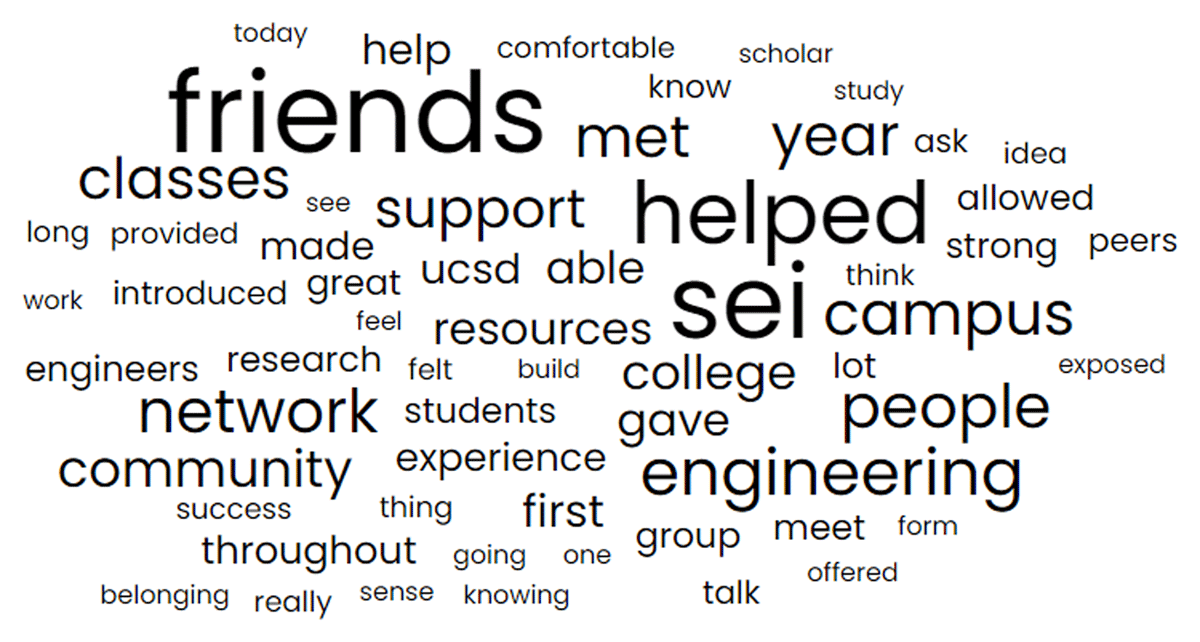
Figure 2
In what ways (if any) did participating in SEI support your success as an engineering student at UC San Diego?
Table 5
Student Involvement by Program.
| ACES SCHOLARS | IDEA SCHOLARS | SEI ONLY | COMPARISON | CHI SQUARE TESTS OF INDEPENDENCE | |
|---|---|---|---|---|---|
| Diversity Org* | 61% | 63% | 9% | 24% | X2(3, N = 228) = 38.59, p < .001 |
| IDEA Center* | 74% | 86% | 26% | 35% | X2(3, N = 228) = 48.96, p < .001 |
| Research* | 70% | 60% | 38% | 31% | X2(3, N = 229) = 20.52, p < .001 |
[i] Note: Abbreviations: X2, chi-square test statistic.
*Significance at p = 0.05.
Table 6
First-Generation Student Involvement.
| ACES (n = 15) | IDEA (n = 23) | COMPARISON (n = 29) | CHI SQUARE TESTS OF INDEPENDENCE | |
|---|---|---|---|---|
| Diversity Org* | 53% | 61% | 28% | X2(2, N = 67) = 6.32, p = .042 |
| IDEA Center* | 67% | 91% | 41% | X2(2, N = 67) = 13.96, p < .001 |
| Research* | 73% | 55% | 10% | X2(2, N = 66) = 19.60, p < .001 |
[i] Note: Abbreviations: X2, chi-square test statistic.
*Significance at p = 0.05.
Table 7
Latinx Student Involvement.
| ACES (n = 10) | IDEA (n = 21) | COMPARISON (n = 16) | CHI SQUARE TESTS OF INDEPENDENCE | |
|---|---|---|---|---|
| Diversity Org* | 60% | 86% | 19% | X2(2, N = 47) = 16.69, p < .001 |
| IDEA Center | 70% | 100% | 36% | Cell counts too low |
| Research* | 80% | 50% | 13% | X2(2, N = 46) = 12.02, p = .002 |
[i] Note: Abbreviations: X2, chi-square test statistic.
*Significance at p = 0.05.
Table 8
Pell Grant Eligible Student Involvement.
| ACES (n = 20) | IDEA (n = 19) | COMPARISON (n = 31) | CHI SQUARE TESTS OF INDEPENDENCE | |
|---|---|---|---|---|
| Diversity Org* | 55% | 79% | 36% | X2(2, N = 70) = 8.98, p = .011 |
| IDEA Center* | 75% | 90% | 32% | X2(2, N = 70) = 18.69, p < .001 |
| Research* | 70% | 58% | 13% | X2(2, N = 70) = 19.25, p < .001 |
[i] Note: Abbreviations: X2, chi-square test statistic.
*Significance at p = 0.05.
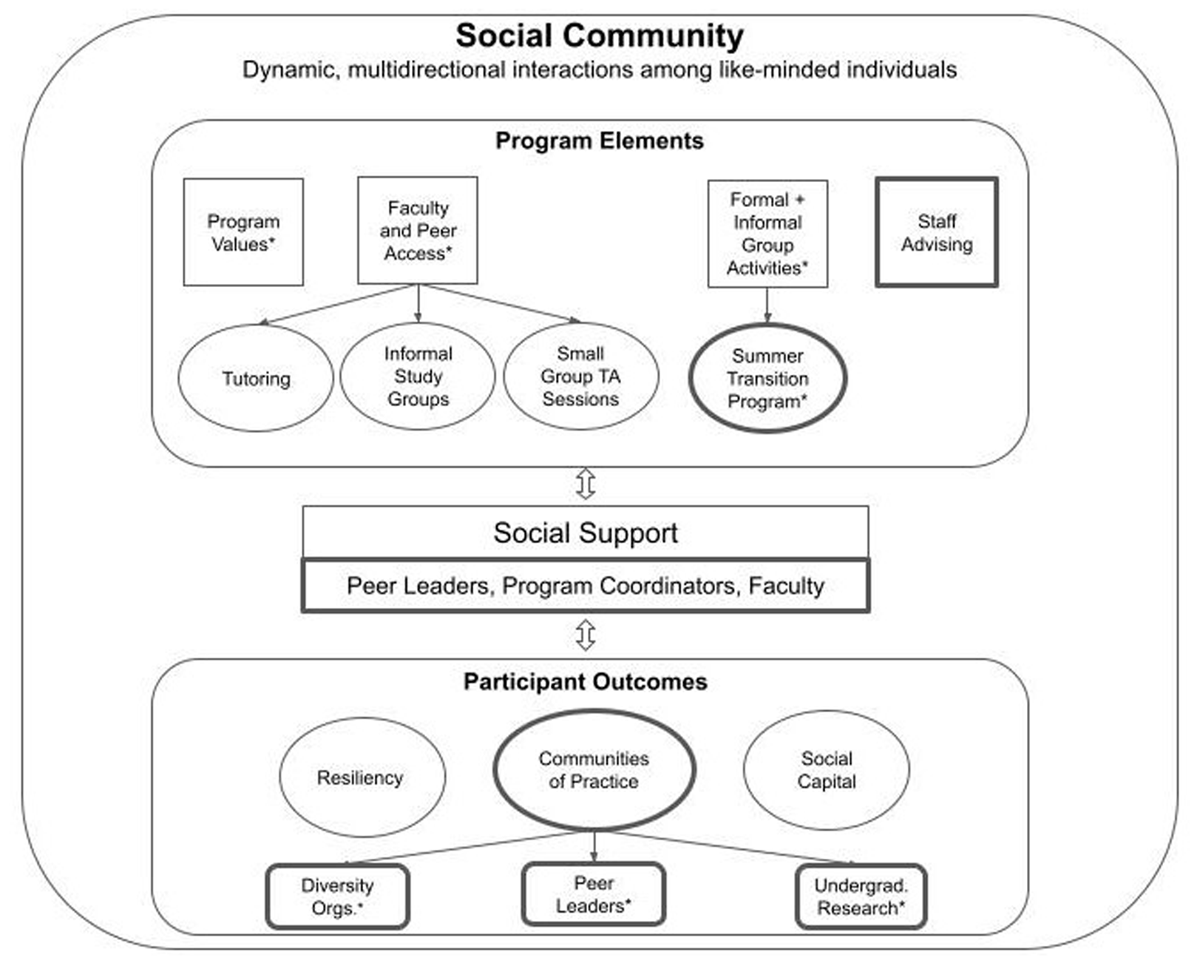
Figure 3
Social Community Model Applied to Engineering Scholar Programs (Mondisa & McComb 2015, adapted with permission).
* Aspects that are strongly influenced by the Peer Leader community of practice in this study.