
Table 1
Integrated STEM Education Principles*
| Principles | Description |
|---|---|
| Integration | Combines content from science, technology, engineering, and mathematics |
| Problem-centered learning | Focuses on using real-world problems to create the context for concept application |
| Inquiry-based learning | Questioning, discussing, interpreting, using, and attempting to understand the content |
| Design-based learning | Using engineering or technological design |
| Cooperative learning | Centers around teamwork and collaboration with others in small group |
[i] *key principles for integrated STEM education, Üçgül & Altıok, 2021; Thibaut et al., 2018
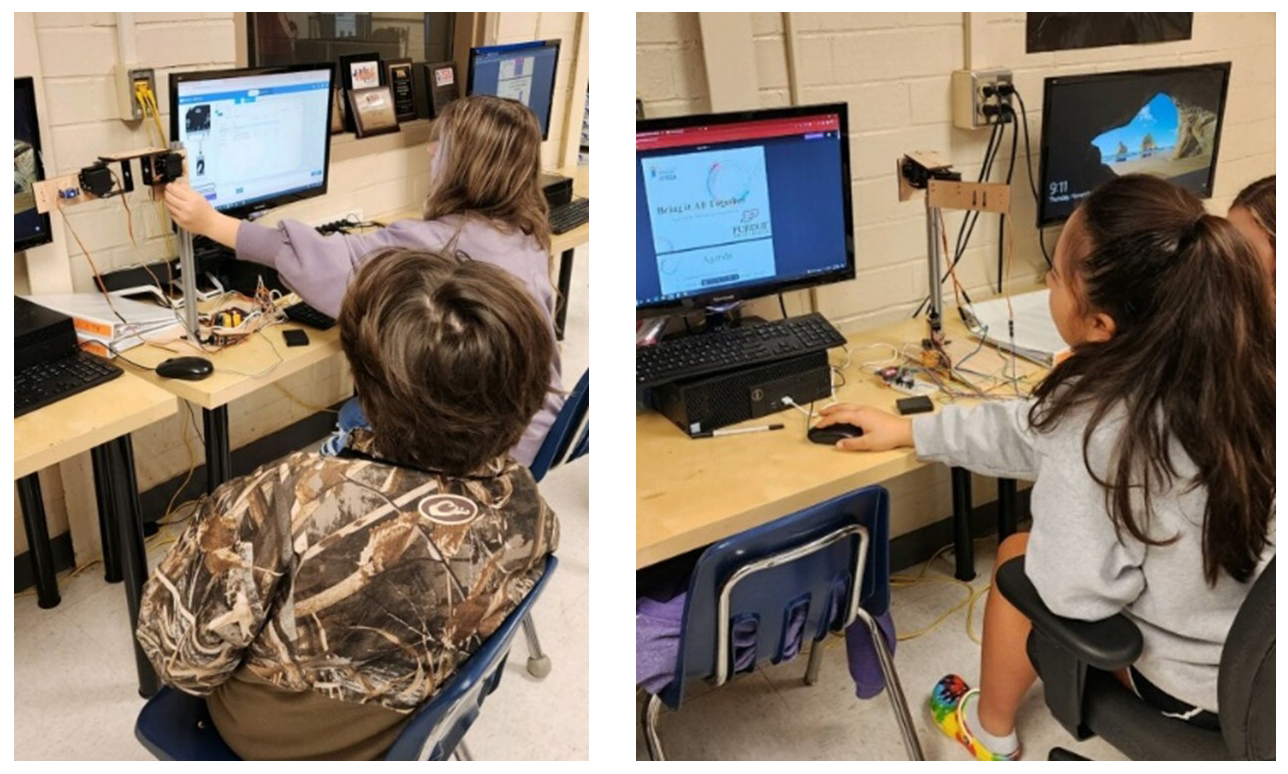
Figure 1
Student Engagement in Robotics Programming
Table 2
Engineering Skills Self-Efficacy Instrument: Constructs Measured
| Construct | Questions on the Instrument |
|---|---|
| General Self-Efficacy |
|
| Experimental Self-Efficacy |
|
| Design Self-Efficacy |
|
| Tinkering Self-Efficacy |
|
[i] Engineering Skills Self-Efficacy Instrument (Jackson, 2018; Mamaril et al., 2016).
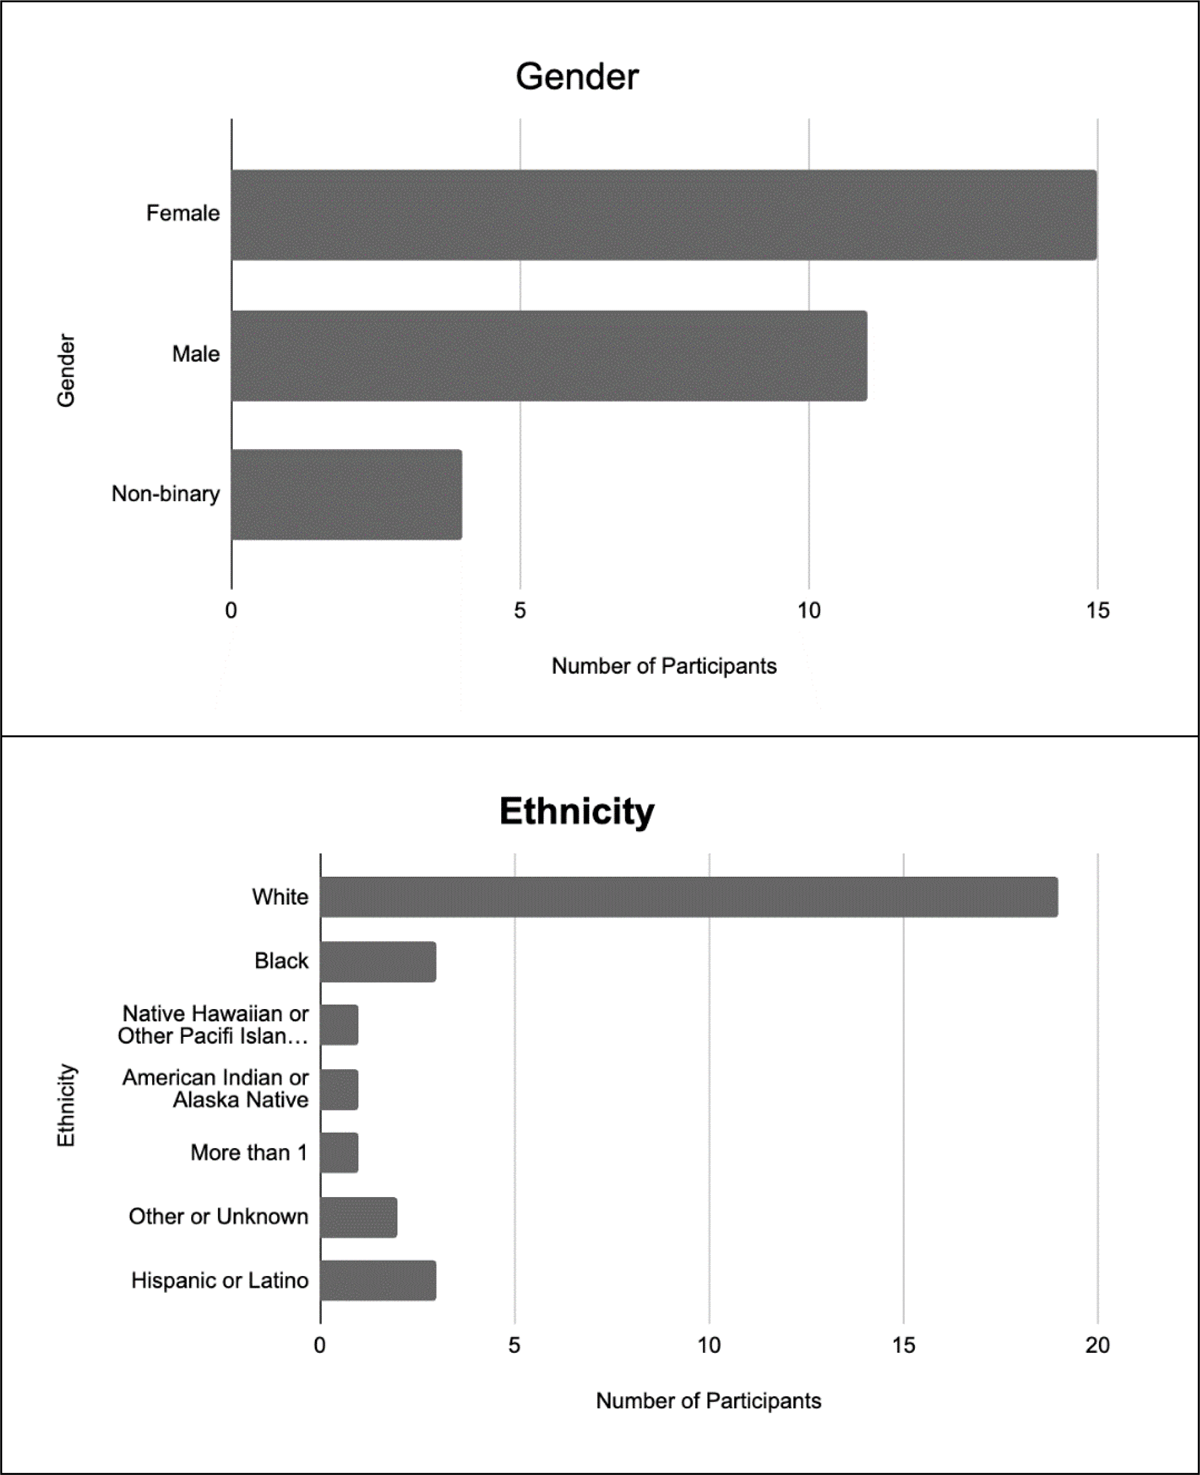
Figure 2
Participant Demographics: Gender and Ethnicity
Table 3
Engineering Self-Efficacy Evaluation Mean Scores
| Engineering Self-Efficacy Constructs | Pre (SD) | Post (SD) | Gain |
|---|---|---|---|
| General Self-Efficacy | 3.45 (1.27) | 4.24 (1.01) | 0.79 |
| Experimental Self-Efficacy | 3.88 (1.54) | 5.32 (1.71) | 1.44 |
| Design Self-Efficacy | 2.45 (1.16) | 3.36 (0.99) | 0.91 |
| Tinkering Self-Efficacy | 3.79 (1.35) | 4.54 (1.23) | 0.75 |
[i] Note. n = 30; *p < .05, two-tailed, paired; †Effect Size (Cohen’s d)
Table 4
Pretest/Posttest Data Analysis Results
| Engineering Self-Efficacy Constructs | Self-Efficacy Gain Score | ||||
|---|---|---|---|---|---|
| M | SD | t | p | †ES | |
| General | 0.79 | 1.33 | 3.26 | 0.003* | 1.33 |
| Experimental | 1.08 | 1.21 | 4.90 | ≤ 0.001* | 1.22 |
| Design | 1.13 | 1.53 | 4.04 | ≤ 0.001* | 1.53 |
| Tinkering | 0.75 | 1.72 | 2.39 | 0.024* | 1.72 |
[i] Note. n = 30; *p < .05, two-tailed, paired; †Effect Size (Cohen’s d)
Table 5
Kruskal-Wallis analysis for male and nonmale participants
| Engineering Self-Efficacy Constructs | Group | Pretest (SD) | Posttest (SD) | Self-Efficacy Gain Score | ||
|---|---|---|---|---|---|---|
| M Rank | H | p | ||||
| General | Male Nonmale | 3.89 (1.39) 3.19 (1.15) | 4.18 (1.04) 4.27 (1.02) | 12.09 17.47 | 2.68 | 0.101 |
| Experimental | Male Nonmale | 4.06 (1.93) 3.77 (1.30) | 5.48 (1.91) 5.23 (1.64) | 15.32 15.61 | 0.008 | 0.930 |
| Design | Male Nonmale | 2.73 (1.15) 2.29 (1.16) | 3.26 (0.87) 3.43 (1.07) | 13.36 16.74 | 1.08 | 0.299 |
| Tinkering | Male Nonmale | 4.48 (0.97) 3.39 (1.39) | 4.50 (1.10) 4.57 (1.33) | 12.55 17.21 | 2.02 | 0.156 |
Table 6
Kruskal-Wallis analysis for white and nonwhite participants
| Engineering Self-Efficacy Constructs | Group | Pretest (SD) | Posttest (SD) | Self-Efficacy Gain Score | ||
|---|---|---|---|---|---|---|
| M Rank | H | p | ||||
| General | Male Nonmale | 3.45 (1.02) 3.44 (1.73) | 4.31 (0.97) 4.10 (1.13) | 15.88 14.75 | 0.112 | 0.738 |
| Experimental | Male Nonmale | 4.27 (1.14) 3.10 (1.96) | 5.60 (1.43) 4.77 (2.15) | 15.30 15.90 | 0.032 | 0.857 |
| Design | Male Nonmale | 2.63 (1.05) 2.10 (1.34) | 3.45 (0.83) 3.18 (1.28) | 15.63 15.25 | 0.013 | 0.910 |
| Tinkering | Male Nonmale | 3.83 (1.01) 3.73 (1.91) | 4.81 (0.84) 4.00 (1.70) | 16.95 12.60 | 1.68 | 0.195 |