
Figure 1

Figure 2

Figure 3

Figure 4
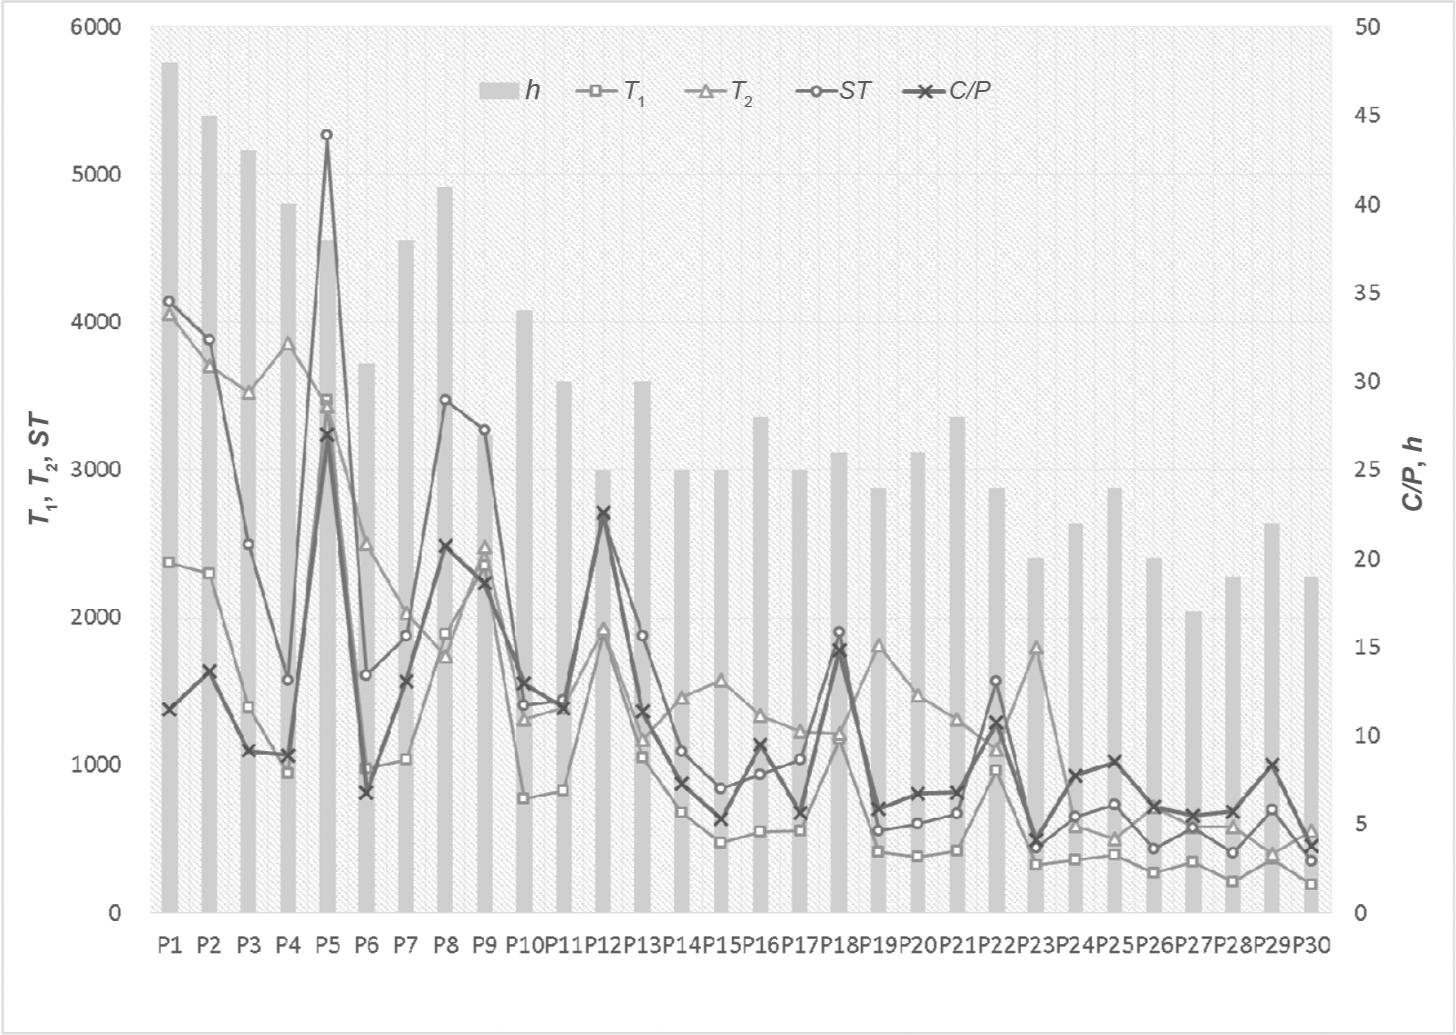
Figure 5
Spearman and Pearson correlation coefficients among the C/P, h, T1, T2, and ST of the top 30 assignees_
| Spearman | T1 | T2 | ST | C/P | h | |
|---|---|---|---|---|---|---|
| Pearson | ||||||
| T1 | 1 | −0.248 | 0.093 | 0.932 Significant correlation at 0.01 level. | 0.275 | |
| T2 | −0.507 Significant correlation at 0.01 level. | 1 | 0.655 Significant correlation at 0.01 level. | −0.094 | 0.519 Significant correlation at 0.01 level. | |
| ST | −0.482 Significant correlation at 0.01 level. | 0.881 Significant correlation at 0.01 level. | 1 | 0.275 | 0.799 Significant correlation at 0.01 level. | |
| CP | 0.303 | −0.099 | 0.177 | 1 | 0.488 Significant correlation at 0.01 level. | |
| h | −0.151 | 0.646 Significant correlation at 0.01 level. | 0.750 Significant correlation at 0.01 level. | −0.121 | 1 | |
Spearman and Pearson correlation coefficients among the C, h, T1, T2, and ST of the top 30 highly cited patents_
| Spearman | T1 | T2 | ST | C/P | h | |
|---|---|---|---|---|---|---|
| Pearson | ||||||
| T1 | 1 | 0.830 Significant correlation at 0.01 level. | 0.988 Significant correlation at 0.01 level. | 0.963 Significant correlation at 0.01 level. | 0.892 Significant correlation at 0.01 level. | |
| T2 | 0.276 | 1 | 0.815 Significant correlation at 0.01 level. | 0.839 Significant correlation at 0.01 level. | 0.747 Significant correlation at 0.01 level. | |
| ST | 0.989 Significant correlation at 0.01 level. | 0.363 Significant correlation at 0.01 level. | 1 | 0.964 Significant correlation at 0.01 level. | 0.905 Significant correlation at 0.01 level. | |
| C/P | 0.962 Significant correlation at 0.01 level. | 0.410 Significant correlation at 0.01 level. | 0.975 Significant correlation at 0.01 level. | 1 | 0.959 Significant correlation at 0.01 level. | |
| h | 0.976 Significant correlation at 0.01 level. | 0.347 Significant correlation at 0.01 level. | 0.975 Significant correlation at 0.01 level. | 0.985 Significant correlation at 0.01 level. | 1 | |
Spearman and Pearson correlation coefficients among the C/P, h, T1, T2, and ST of the top 30 universities_
| Spearman | T1 | T2 | ST | C/P | h | |
|---|---|---|---|---|---|---|
| Pearson | ||||||
| T1 | 1 | 0.581 Significant correlation at 0.01 level. | 0.988 Significant correlation at 0.01 level. | 0.730 Significant correlation at 0.01 level. | 0.721 Significant correlation at 0.01 level. | |
| T2 | 0.593 Significant correlation at 0.01 level. | 1 | 0.598 Significant correlation at 0.01 level. | 0.065 | 0.755 Significant correlation at 0.01 level. | |
| ST | 0.994 Significant correlation at 0.01 level. | 0.624 Significant correlation at 0.01 level. | 1 | 0.715 Significant correlation at 0.01 level. | 0.749 Significant correlation at 0.01 level. | |
| C/P | 0.766 Significant correlation at 0.01 level. | 0.104 | 0.752 Significant correlation at 0.01 level. | 1 | 0.460 Significant correlation at 0.01 level. | |
| h | 0.751 Significant correlation at 0.01 level. | 0.745 Significant correlation at 0.01 level. | 0.790 Significant correlation at 0.01 level. | 0.519 Significant correlation at 0.01 level. | 1 | |
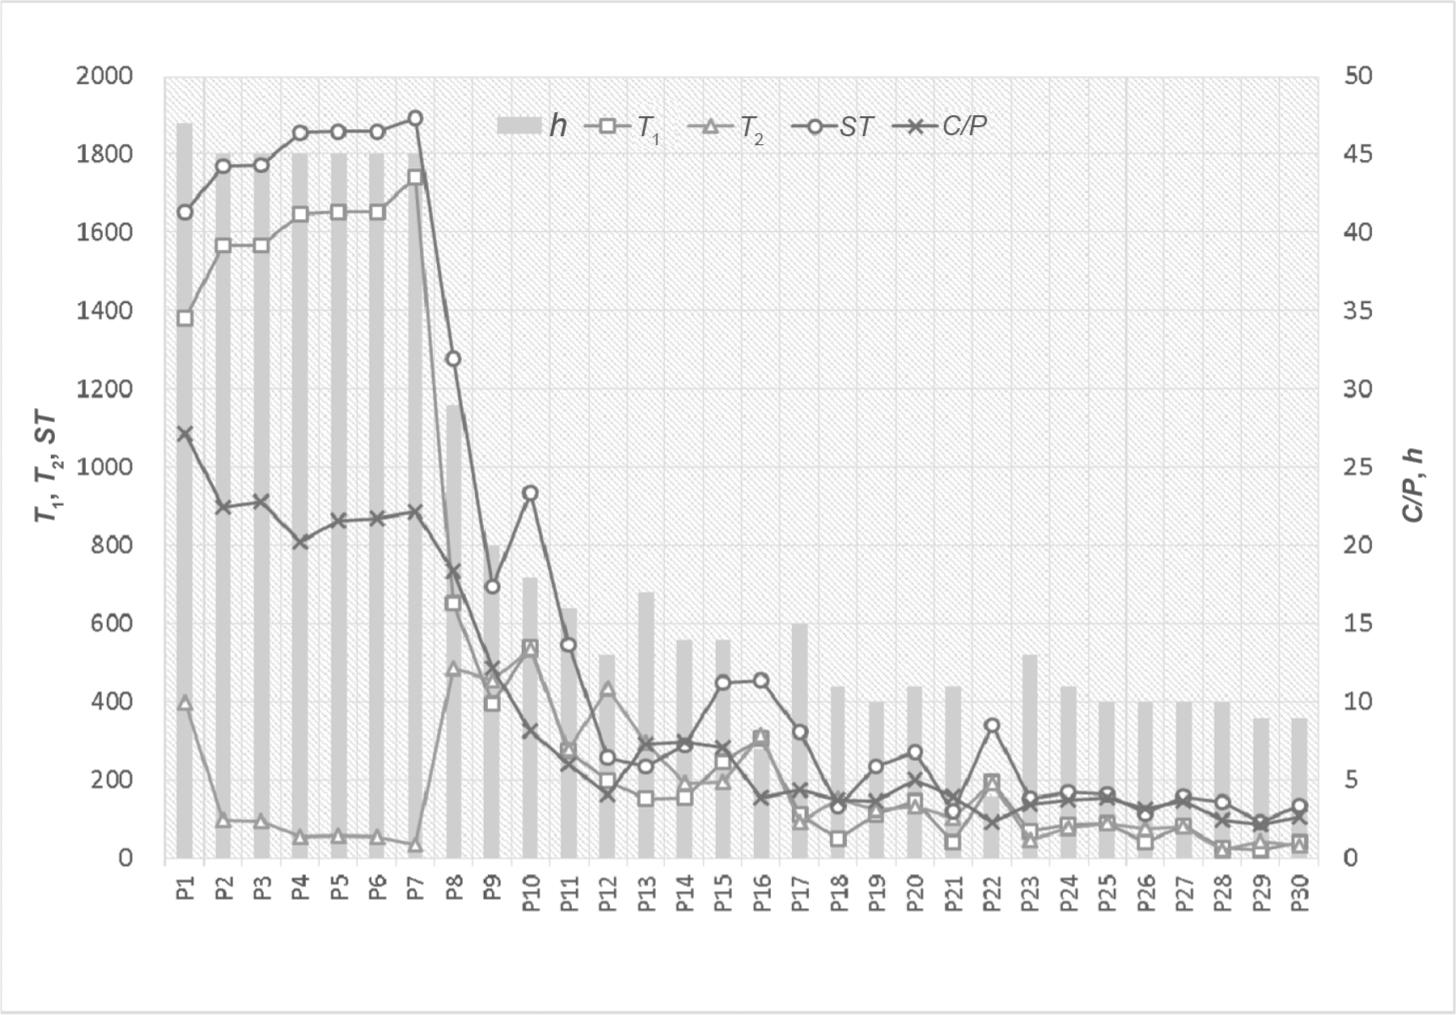
List of top 30 highly cited paper in the field “computer sciences” from ESI_
| No. | Authors | Journal | Publication year |
|---|---|---|---|
| P1 | Robinson, M.D. et al. | Bioinformatics | 2010 |
| P2 | Li, H. & Durbin, R. | Bioinformatics | 2010 |
| P3 | Edgar, R.C. | Bioinformatics | 2010 |
| P4 | Quinlan, A.R. & Hall, I.M. | Bioinformatics | 2010 |
| P5 | Bullard, J.H. et al. | BMC Bioinformatics | 2010 |
| P6 | Smoot, M.E. et al. | Bioinformatics | 2011 |
| P7 | Willer, C.J. et al. | Bioinformatics | 2010 |
| P8 | Wu, T.D. & Nacu, S. | Bioinformatics | 2010 |
| P9 | Wang, L.K. et al. | Bioinformatics | 2010 |
| P10 | Pruim, R.J. et al. | Bioinformatics | 2010 |
| P11 | Quince, C. et al. | BMC Bioinformatics | 2011 |
| P12 | Milne, I. et al. | Bioinformatics | 2010 |
| P13 | Caporaso, J.G. et al. | Bioinformatics | 2010 |
| P14 | Hadfield, J.D. | Journal of Statistical Software | 2010 |
| P15 | Edgar, R.C. et al. | Bioinformatics | 2011 |
| P16 | MacLean, B. et al. | Bioinformatics | 2010 |
| P17 | Friedman, J. et al. | Journal of Statistical Software | 2010 |
| P18 | McLaren, W. et al. | Bioinformatics | 2010 |
| P19 | Hyatt, D. et al. | BMC Bioinformatics | 2010 |
| P20 | Viechtbauer, W. | Journal of Statistical Software | 2010 |
| P21 | Kembel, S.W. et al. | Bioinformatics | 2010 |
| P22 | Danecek, P. et al. | Bioinformatics | 2011 |
| P23 | Martin, D.P. et al. | Bioinformatics | 2010 |
| P24 | Huang, Y. et al. | Bioinformatics | 2010 |
| P25 | Pluskal, T. et al. | BMC Bioinformatics | 2010 |
| P26 | Yu, N.Y. et al. | Bioinformatics | 2010 |
| P27 | O’Boyle, N.M. et al. | Journal of Cheminformatics | 2011 |
| P28 | Dweep, H. et al. | Journal of Biomedical Informatics | 2011 |
| P29 | Baraniuk, R.G. et al. | IEEE Transactions on Information Theory | 2010 |
| P30 | Robin, X. et al. | BMC Bioinformatics | 2011 |
Original records of top 30 cited patents in “computer software & hardware”_
| Patent | Patent number | Year | Assignee |
|---|---|---|---|
| P1 | 7665051 | 2010 | Qimonda AG |
| P2 | 7802219 | 2010 | Cadence Design Systems, Inc. |
| P3 | 7917877 | 2011 | Cadence Design Systems, Inc. |
| P4 | 7712056 | 2010 | Cadence Design Systems, Inc. |
| P5 | 7962867 | 2011 | Cadence Design Systems, Inc. |
| P6 | 7992122 | 2011 | GG Technology, Inc. |
| P7 | 7971160 | 2011 | Fujitsu Semiconductor Limited |
| P8 | 7738971 | 2010 | Ethicon Endo-Surgery, Inc. |
| P9 | 8306853 | 2012 | Colts Laboratories |
| P10 | 7693720 | 2010 | VoiceBox Technologies, Inc. |
| P11 | 7949529 | 2011 | VoiceBox Technologies, Inc. |
| P12 | 8301709 | 2012 | Google Inc. |
| P13 | 7685126 | 2010 | Isilon Systems, Inc. |
| P14 | 7716171 | 2010 | EMC Corporation |
| P15 | 7650009 | 2010 | Digimarc Corporation |
| P16 | 7809167 | 2010 | Bell_Matthew |
| P17 | 8032409 | 2011 | Accenture Global Services Limited |
| P18 | 7840537 | 2010 | CommVault Systems, Inc. |
| P19 | 7827208 | 2010 | Facebook, Inc. |
| P20 | 7643649 | 2010 | Digimarc Corporation |
| P21 | 7647237 | 2010 | MiniMed, Inc. |
| P22 | 7698160 | 2010 | VirtualAgility, Inc |
| P23 | 7685254 | 2010 | Pandya_Ashish A. |
| P24 | 7697719 | 2010 | Digimarc Corporation |
| P25 | 7751596 | 2010 | Digimarc Corporation |
| P26 | 7657849 | 2010 | Apple Inc. |
| P27 | 7760905 | 2010 | Digimarc Corporation |
| P28 | 7797204 | 2010 | Balent_Bruce F. |
| P29 | 7653883 | 2010 | Apple Inc. |
| P30 | 8200775 | 2012 | Newsilike Media Group, Inc |
Spearman and Pearson correlation coefficients among the C/P, h, T1, T2, and ST of the top 30 highly cited papers_
| Spearman | T1 | T2 | ST | C/P | h | |
|---|---|---|---|---|---|---|
| Pearson | ||||||
| T1 | 1 | 0.868 Significant correlation at 0.01 level. | 0.994 Significant correlation at 0.01 level. | 0.926 Significant correlation at 0.01 level. | 0.922 Significant correlation at 0.01 level. | |
| T2 | 0.820 Significant correlation at 0.01 level. | 1 | 0.838 Significant correlation at 0.01 level. | 0.746 Significant correlation at 0.01 level. | 0.907 Significant correlation at 0.01 level. | |
| ST | 0.992 Significant correlation at 0.01 level. | 0.828 Significant correlation at 0.01 level. | 1 | 0.926 Significant correlation at 0.01 level. | 0.915 Significant correlation at 0.01 level. | |
| CP | 0.901 Significant correlation at 0.01 level. | 0.627 Significant correlation at 0.01 level. | 0.880 Significant correlation at 0.01 level. | 1 | 0.867 Significant correlation at 0.01 level. | |
| h | 0.793 Significant correlation at 0.01 level. | 0.897 Significant correlation at 0.01 level. | 0.827 Significant correlation at 0.01 level. | 0.706 Significant correlation at 0.01 level. | 1 | |