Have a personal or library account? Click to login
Rising Temperatures and Maize Sector Performance in Zimbabwe: Evidence from 1961–2022 Cover

Rising Temperatures and Maize Sector Performance in Zimbabwe: Evidence from 1961–2022

Open Access
|Sep 2026

Figures & Tables

Table 1.

Definition of variables and data sources

VariableDescriptionUnit of measurementSource
TempAnnual mean land-surface air temperature anomaly relative to the 1951–1980 climatological mean°CFAOSTAT (based on NASA–GISS GISTEMP)
PrdxnMaize production‘000 tonnesFAOSTAT
YieldMaize yieldkg/haFAOSTAT
ImportsMaize imports‘000 tonnesFAO
ExportsMaize exports‘000 tonnesFAO

[i] Source: Annual temperature-change data were obtained from the FAOSTAT Temperature Change dataset. The indicator measures changes in annual mean land-surface air temperature relative to the 1951–1980 climatological mean and is based on NASA-GISS GISTEMP data.

Table 2.

Descriptive statistics of variables used in the study

VariableObsMeanMedianStd. dev.MinMax
Temp620.3170.20.458−0.4761.336
Prdxn621 399.81 362.7588.4361.92 833.3
Yield621 210.91 186.5488.82286.72 311
Imports62183.427.8271.1801 208.1
Exports62207.7180.3245.650.0031 279.9

[i] Source: own calculations using STATA based on FAOSTAT/FAO data.

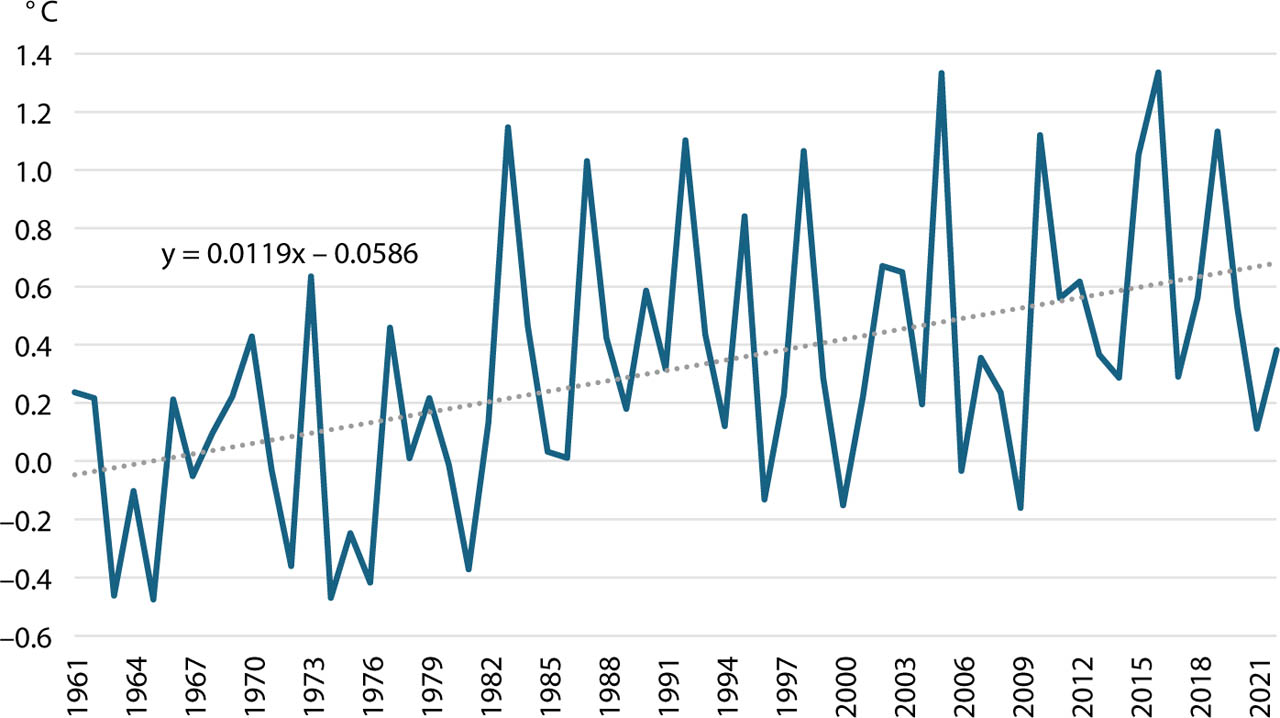
Fig. 1.

Temperature changes in Zimbabwe

Source: own work based on FAOSTAT data.
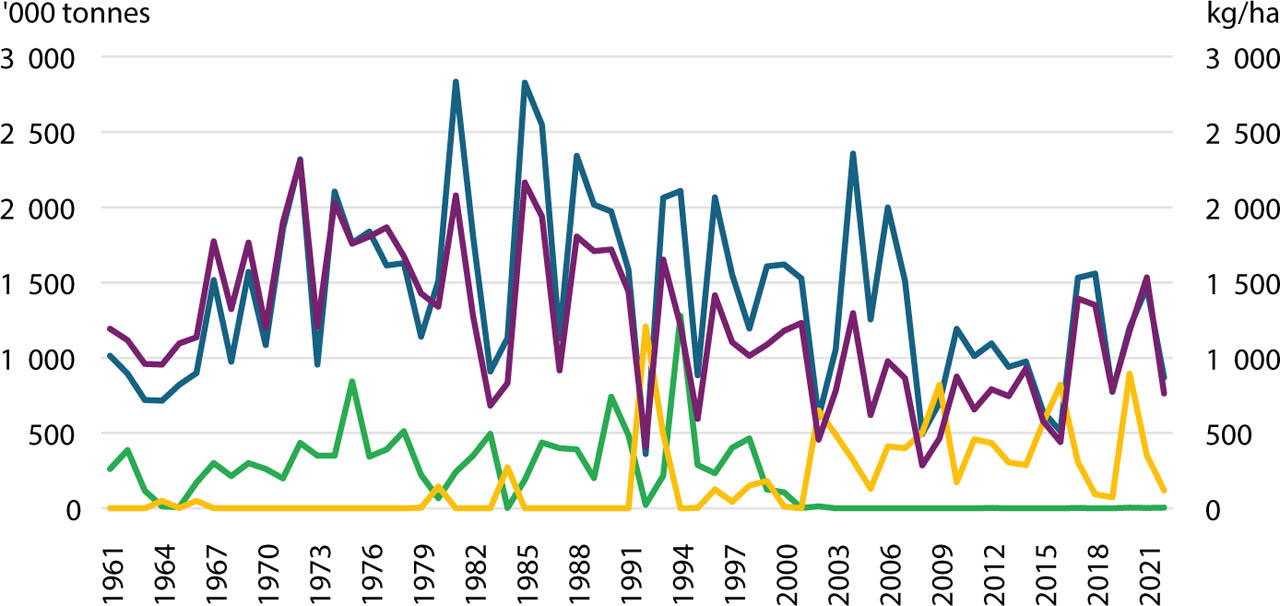
Fig. 2.

Production, export, import, and yield of maize in Zimbabwe

Source: own work based on the FAOSTAT.

Table 3.

Correlation matrix of temperature and maize variables

VariablesTempImportsExportsYieldPrdxn
Temp1.0000
Imports0.3665*1.0000
Exports−0.1664−0.5018*1.0000
Yield−0.5771*−0.5674*0.4561*1.0000
Prdxn−0.4563*−0.4171*0.4054*0.8231*1.0000

* Indicates statistical significance at the 5% level.

Source: own calculations using STATA.

Table 4.

OLS estimates with heteroskedasticity-robust standard errors for maize-sector performance in Zimbabwe

VariablesPrdxnYieldExportsImports
Temp−585.77*** (151.38)−615.29*** (104.98)–89.15 (60.83)216.78** (87.84)
Cons1 585.51*** (528.14)1 405.98*** (402.51)236.01*** (74.92)114.69 (92.41)
Observations62626262
F-stat14.9734.352.156.09
Prob > F0.000.000.150.02
R-squared0.210.330.030.14

Note: standard errors in parentheses.

*** p < 0.01,

** p < 0.05,

* p < 0.1.

Source: own calculations using STATA robust regression estimation.

Table 5.

First-difference OLS estimates with heteroskedasticity-robust standard errors

VariablesΔ prdxnΔ yieldΔ exportΔ import
Δ temp−845.971*** (135.192)−573.193*** (107.279)−9.378 (47.201)32.059 (80.114)
Cons−0.364 (68.494)−5.688 (53.869)−4.19 (21.462)1.875 (39.12)
Observations61616161
F-stat39.1628.550.040.16
Prob > F0.000.000.850.69
R-squared0.4810.4080.0010.004

Note: standard errors in parentheses.

*** p < 0.01,

** p < 0.05,

* p < 0.1.

Source: own calculations using STATA first-difference robust regression estimation.

DOI: https://doi.org/10.17306/j.jard.2026.3.00028r1 | Journal eISSN: 1899-5772 | Journal ISSN: 1899-5241
Language: English
Page range: 313 - 321
Accepted on: Aug 24, 2026
Published on: Sep 30, 2026
Published by: Poznań University of Life Science
In partnership with: Paradigm Publishing Services
Publication frequency: 4 issues per year

© 2026 Deborah Rusununguko Chinamatira, Sylwester Kozak, published by Poznań University of Life Science
This work is licensed under the Creative Commons Attribution 4.0 License.