
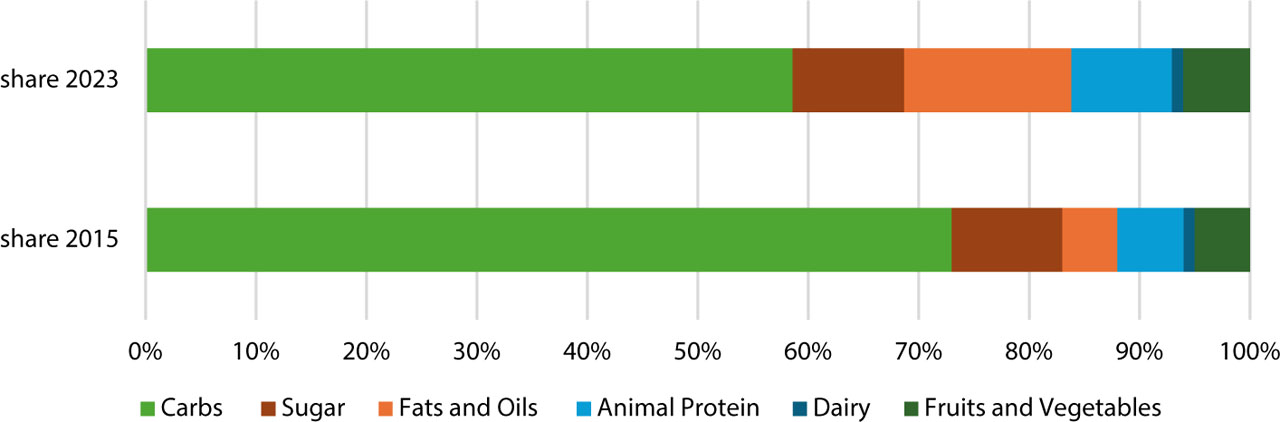
Fig. 1.
Structure of day food consumption in Indonesia based on kcal/capita
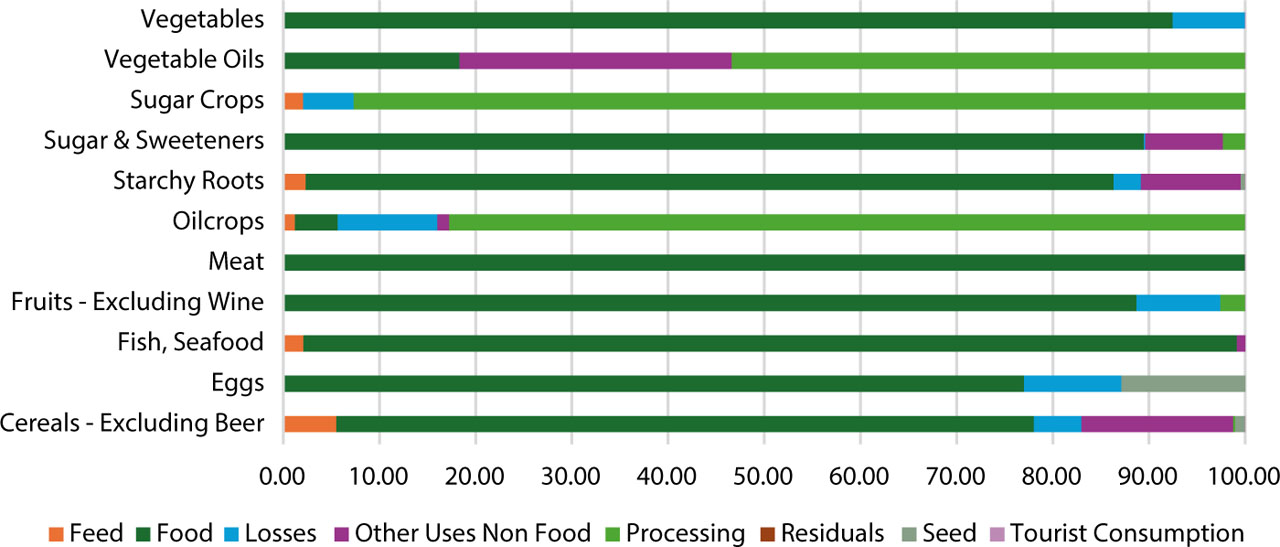
Fig. 2.
Share of food use directions by food product category in Indonesia, 2015
Source: FAO, 2015.
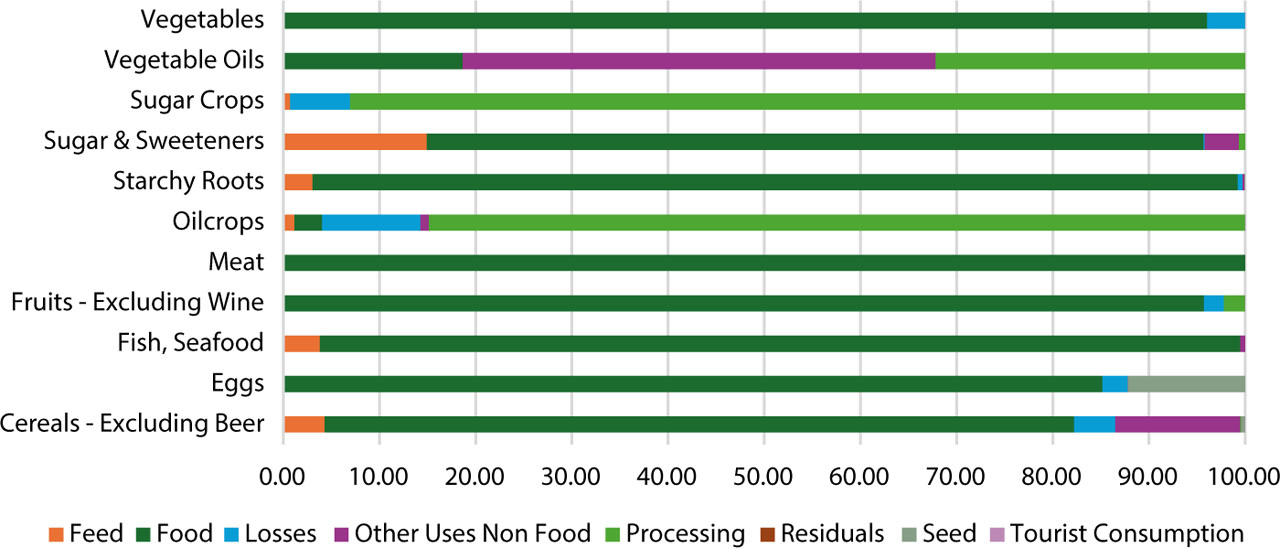
Fig. 3.
Share of food use directions in Indonesia, 2023
Source: FAO, 2023b.
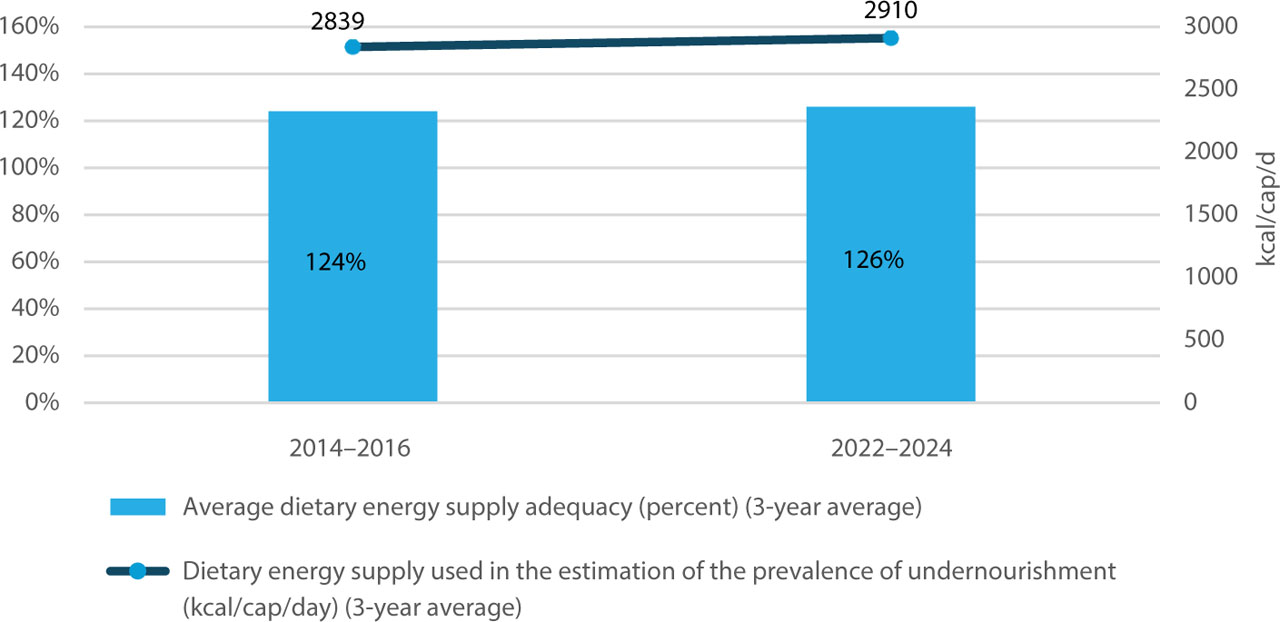
Fig. 4.
Average dietary energy supply adequacy and dietary energy supply in Indonesia (3-year average) in 2014–2016 and 2022–2024
Source: FAO, 2025.
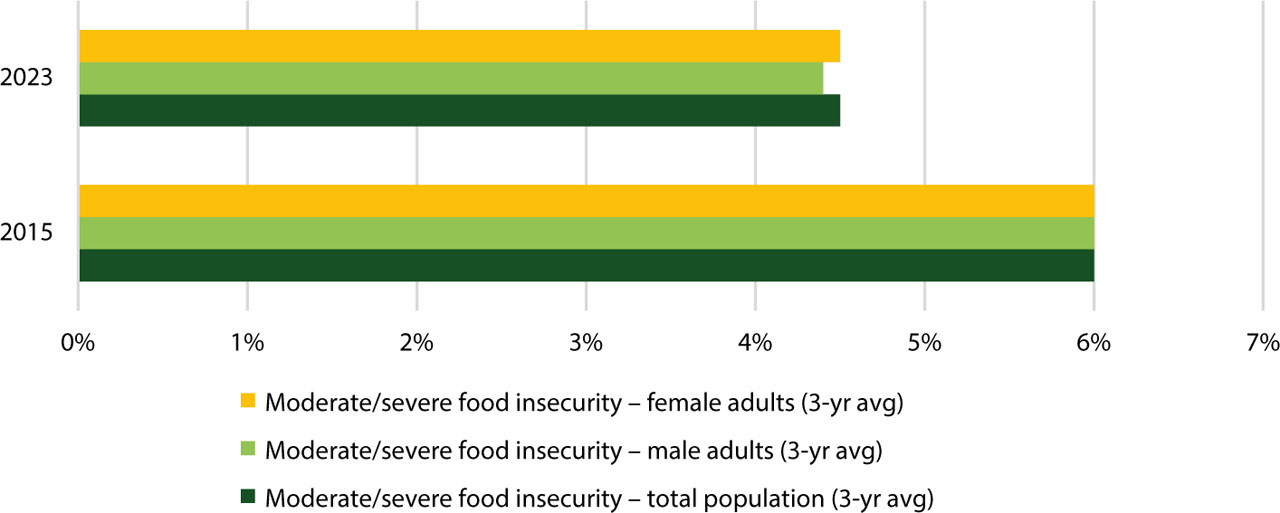
Fig. 5.
Prevalence of moderate or severe food insecurity by sex and total population (3-year average) of Indonesia in 2015 and 2023
Source: FAO, 2025.
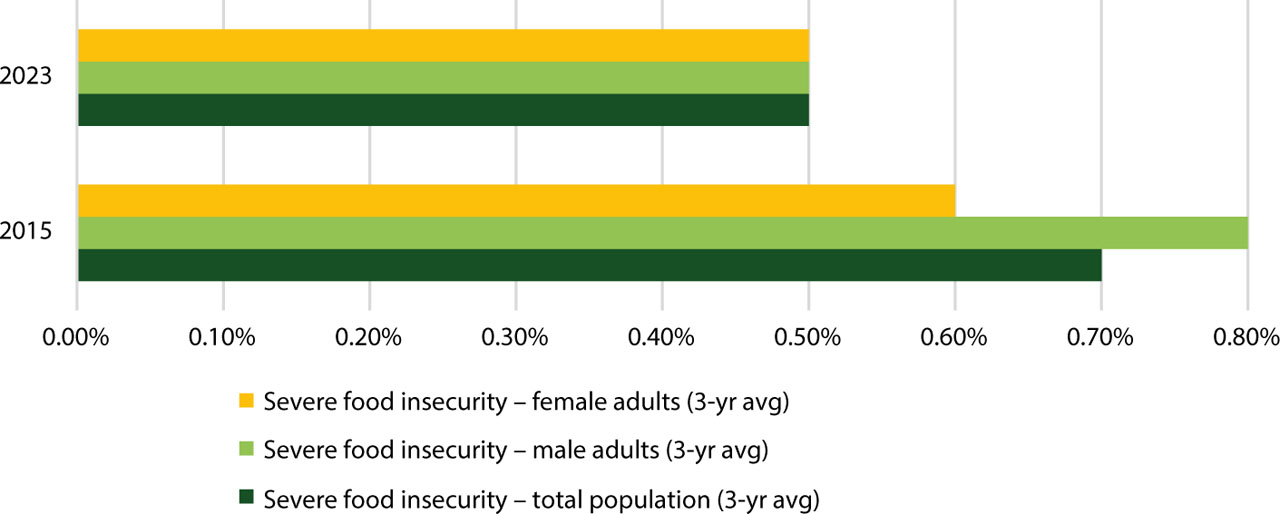
Fig. 6.
Prevalence of severe food insecurity by sex and total population (3-year average) of Indonesia in 2015 and 2023
Source: FAO, 2025.
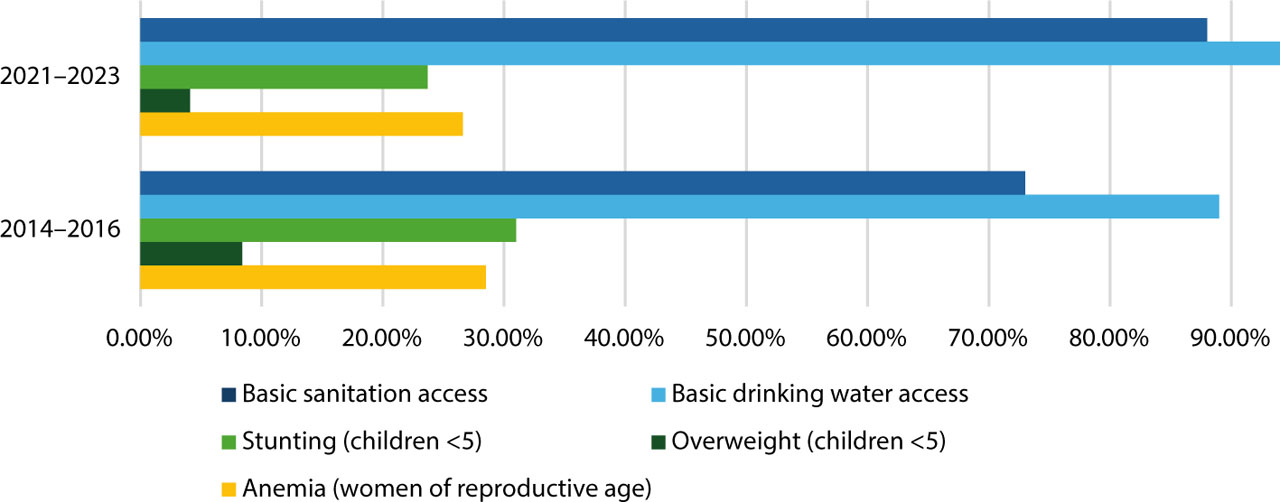
Fig. 7.
Selected food utilization indicators in Indonesia (3-year average)
Source: FAO, 2025.
Table 1.
Selected food stability indicators in Indonesia
| Category | 2014–2016 | 2021–2023 |
|---|---|---|
| Cereal import dependency ratio (%)* | 14.20 | 15.70 |
| Percent of arable land equipped for irrigation (%)* | 3.60 | 3.60 |
| Political stability and absence of violence/terrorism (index) | –0.62 | –0.55 |
| Per capita day food supply variability (kcal/cap) | 21 | 52 |
Source: FAO, 2025.