
Table 1.
Distribution of respondents
| Stratum | Point of sale | Frequency | Percentage |
|---|---|---|---|
| Central districts | Adawlato Grand Market, FAO Local Products Shop | 67 | 26.8 |
| Tokoin (RamCO Supermarket, Champion) | 63 | 25.2 | |
| Peripheral popular districts | Agoe (Agoe Assiyeye Market, Artisanal kiosks | 57 | 22.8 |
| Bè (Bè Market, Suprmarket, Kiosks) | 63 | 25.2 | |
| Total | 250 | 100 |
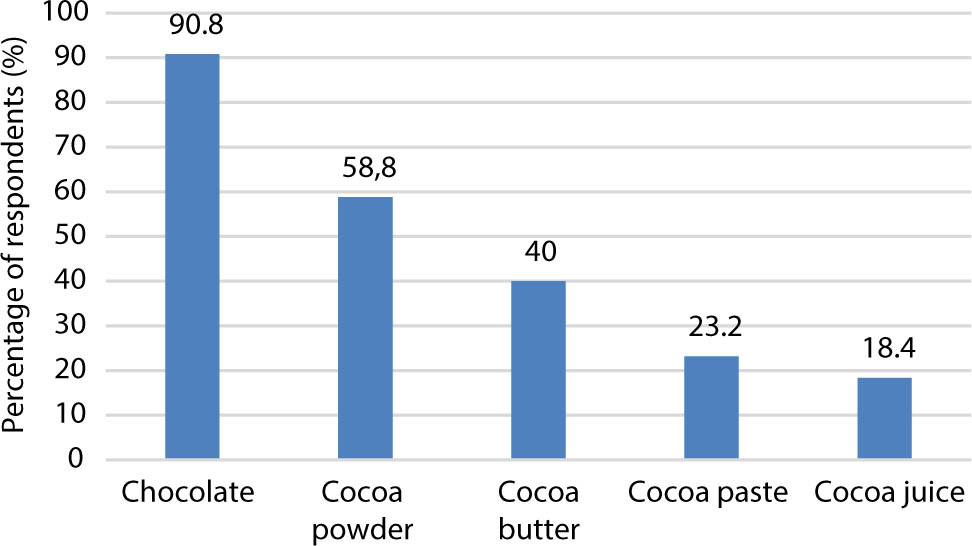
Fig. 1.
Locally processed cocoa-derived products consumed
Source: own elaboration.
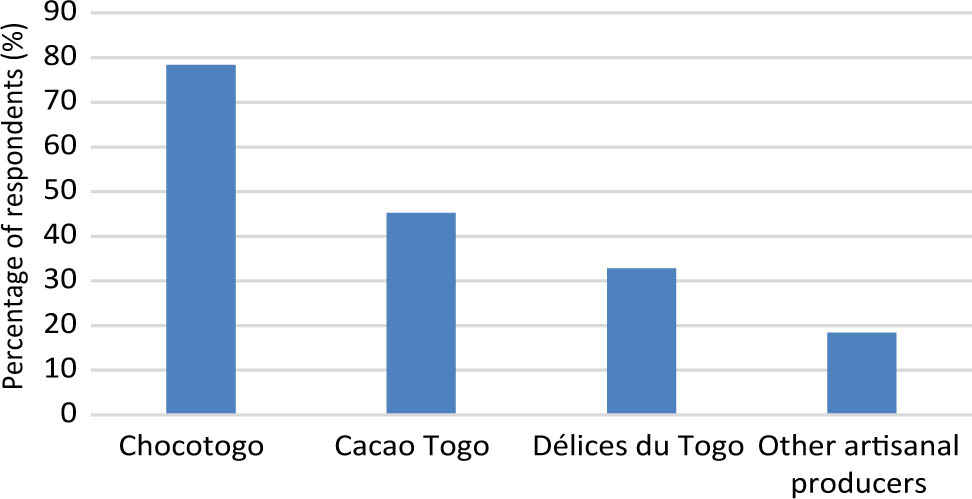
Fig. 2.
Enterprises producing cocoa-derived products
Source: own elaboration.
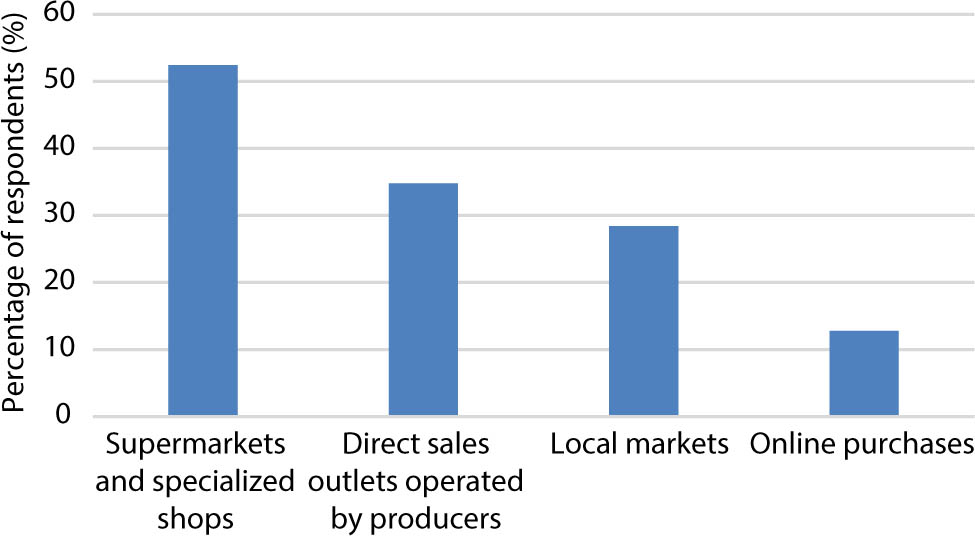
Fig. 3.
Preferred supply channels among consumers
Source: own elaboration.
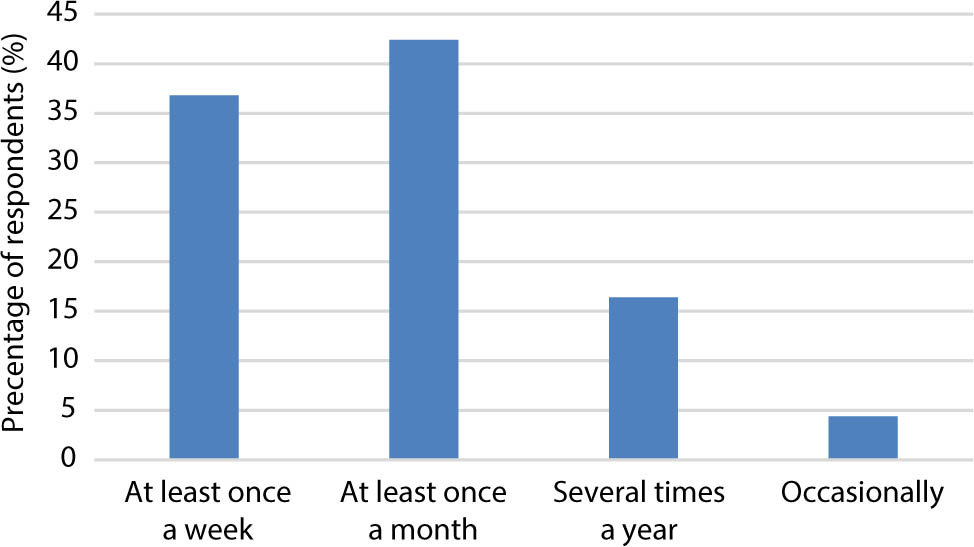
Fig. 4.
Frequency of purchase of locally processed cocoa-derived products
Source: own elaboration.
Table 2.
Rotated component matrix of purchase motivation items
| Motivation items | Factor 1 | Factor 2 | Factor 3 |
|---|---|---|---|
| Natural quality without additives | 0.812 | 0.142 | 0.089 |
| Pleasant and authentic taste | 0.798 | 0.156 | 0.112 |
| Attractive packaging | 0.756 | 0.201 | 0.134 |
| Advertising and communication | 0.723 | 0.189 | 0.167 |
| Availability at points of sale | 0.701 | 0.234 | 0.145 |
| Geographical accessibility | 0.689 | 0.256 | 0.123 |
| Personal pleasure and satisfaction | 0.134 | 0.834 | 0.178 |
| Mood improvement | 0.156 | 0.812 | 0.145 |
| Personal reward | 0.189 | 0.789 | 0.167 |
| Pleasing the family | 0.201 | 0.767 | 0.234 |
| Pleasing others (friends, guests) | 0.178 | 0.745 | 0.256 |
| Valorization of local products | 0.234 | 0.189 | 0.823 |
| Support for the national economy | 0.256 | 0.167 | 0.801 |
| Perception of luxury and prestige | 0.267 | 0.234 | 0.779 |
| Affordable price | 0.645 | 0.123 | 0.289 |
[i] Note: The three extracted factors explained a cumulative variance of 68.7%, with Factor 1 accounting for 32.4%, Factor 2 for 21.8%, and Factor 3 for 14.5%. Internal consistency was satisfactory for all factors, with Cronbach's alpha coefficients of 0.86 for Factor 1, 0.83 for Factor 2, and 0.79 for Factor 3, exceeding the recommended threshold of 0.70 (Nunnally and Bernstein, 1994).
Table 3.
Consumer profiles identified by cluster analysis
| Cluster | Frequency | Percentage | Factor 1 | Factor 2 | Factor 3 |
|---|---|---|---|---|---|
| Cluster 1: Altruists | 95 | 38.0 % | 0.42 | 1.23 | 0.38 |
| Cluster 2: Status-oriented consumers | 125 | 50.0 % | 0.68 | 0.45 | 1.45 |
| Cluster 3: Individualistes | 30 | 12.0 % | 1.12 | −0.89 | −0.76 |
| Total | 250 | 100.0 % |
Table 4.
Sociodemographic characteristics of the clusters – altruists (38%), status-oriented (50%), individualists (12%)
| Characteristics | Altruistes (38%) | Status-oriented (50%) | Individualistes (12%) | χ2 / F | p |
|---|---|---|---|---|---|
| Sex (% women) | 64.2 % | 56.8 % | 46.7 % | χ2 = 3.12 | 0.210 |
| Average age (years) | 33.8 | 36.4 | 38.2 | F = 2.45 | 0.088 |
| Higher education level (%) | 62.1 % | 72.8 % | 70.0 % | χ2 = 4.56 | 0.102 |
| Average monthly income (FCFA) | 185 000 | 245 000 | 210 000 | F = 8.34 | < 0.001 |
| Weekly purchase frequency (%) | 42.1 % | 38.4 % | 23.3 % | χ2 = 5.67 | 0.059 |