
Table 1.
Summary of empirical studies reviewed
| Author(s) & year | Study context / Location | Methods | Key findings | Identified gaps |
|---|---|---|---|---|
| 1 | 2 | 3 | 4 | 5 |
| Najimovich (2023) | Poultry enterprises, Southeast Asia | Secondary financial statement analysis | Transparency in financial reporting improves stakeholder trust and reinvestment rates | Focused on large commercial farms; excludes informal small-holder operations |
| Buckel et al. (2024) | Biosecurity adoption, smallholder farms, Ghana | COM-B model; Theoretical Domains Framework; qualitative | Capability, opportunity, and motivation shape biosecurity adoption; knowledge and resource access are key | No financial/economic quantification of biosecurity practices or profitability impact |
| Ouma et al. (2023) | Poultry health constraints, Northern Ghana and Tanzania | Veterinary/epidemiological survey | Newcastle disease and poor vaccination cause 30–50% mortality in unvaccinated flocks | Does not monetise disease losses or integrate them into financial framework |
| Andam et al. (2017) | Poultry feed sector, Ghana | Supply chain analysis; secondary data | 70%+ feed inputs are imported; 20% maize price rise causes 14% feed cost increase | Macro-level focus; no primary data from small-scale farmers; no farm-level financial analysis |
| Kusi et al. (2025) | Supply chain integration, poultry businesses, Ghana | Structural equation modelling | Stronger supply chain integration improves operational efficiency; supply risks reduce performance | No direct profitability/ROI measures; skewed toward semi-commercial enterprises |
| Chibanda et al. (2022) | Broiler production economics and import impact, Ghana | Partial budgeting; enterprise analysis | Frozen imports (~40% domestic consumption) depress local prices 25–30%; producers need 15–20% premium | Focuses on pricing/market distortion; limited on internal cost structures |
| Etuah et al. (2020) | Cost inefficiency, broiler farms, Ashanti Region, Ghana | Stochastic frontier production function | Mean technical inefficiency 34%; feed wastage and poor housing are key drivers | Purely technical analysis; no financial indicators (NPV, BCR, break-even); no monetary valuations |
| Omondi (2019) | Small-scale poultry, Kenyan medium-sized cities | Descriptive survey | Documents flock sizes, cycles, and revenue patterns; important for food security | No profitability indicators; no inferential analysis; limited financial utility |
| Anang & Kabore (2021) | Credit access, small-holder poultry farmers, Sunyani West, Ghana | Logistic regression | Education, experience, and FBO membership increase formal credit access likelihood | No link between credit access and financial performance outcomes |
| Folajinmi & Peter (2020) | Financial management practices, poultry farmers, Ogun State, Nigeria | Survey; correlation analysis | Record-keeping, budgeting, and expense monitoring positively correlate with profitability | Small sample (n=120); self-reported data; no control for disease or price shocks |
| Etuah et al. (2021) | Financial viability of broiler processing, Ashanti Region, Ghana | NPV, BCR, IRR, sensitivity analysis | BCR = 1.38; enterprise profitable but sensitive to feed cost and output price changes | Post-farm gate processing focus; findings less applicable to primary production smallholders |
| Agyemang et al. (2020) | Microcredit impact on poultry production, Ghana | Propensity score matching | Microcredit recipients achieve higher production levels and better input access | No long-term financial sustainability assessment; no repayment/debt burden analysis |
| Adams et al. (2022) | Vertical integration, commercial poultry production, Ghana | Count data (negative binomial) modelling | Integration reduces transaction costs and improves supply chain coordination | Excludes small-scale farmers entirely; findings not transferable to smallholder context |
| Acheampong (2019) | Investment climate constraints, small commercial farms, Ghana | Mixed methods; survival analysis | Policy inconsistency, high interest rates, and weak import regulation threaten farm survival | Survival used as proxy; no actual financial returns or profitability measured |
| Yevu and Onumah (2021) | Profit efficiency of layer producers, Ghana | Stochastic frontier analysis | Mean profit efficiency 68%; significant room for improvement in financial performance | No identification of specific practices to close efficiency gap; no credit/feed/disease linkage |
| Aboah et al. (2025) | Systemic problems in Ghana’s poultry value chain | Group model building (participatory) | Feed cost volatility, disease, and import competition identified as systemic interdependencies | Qualitative only; cannot inform investment decisions or cost-benefit analysis |
| Bannor et al. (2023) | Agricultural insurance willingness-to-pay, poultry farmers, Ghana | Discrete choice experiment | Farmers prefer index-based insurance with low premiums and quick payouts | No evaluation of how insurance adoption affects actual financial performance over time |
| Wongnaa et al. (2023) | Feed choice profitability (commercial vs. own-prepared), poultry farmers, Ghana | Enterprise analysis; cost comparison | Own-prepared feed reduces costs but lowers weight gain, resulting in reduced net returns | Limited to feed choice; no comprehensive assessment of overall farm financial viability |
[i] Note: Studies reviewed but not discussed in detail in the main text are marked in the Identified Gaps column; the four studies discussed in this section are: Andam et al., 2017; Chibanda et al., 2022; Etuah et al., 2021; Yevu and Onumah, 2021.
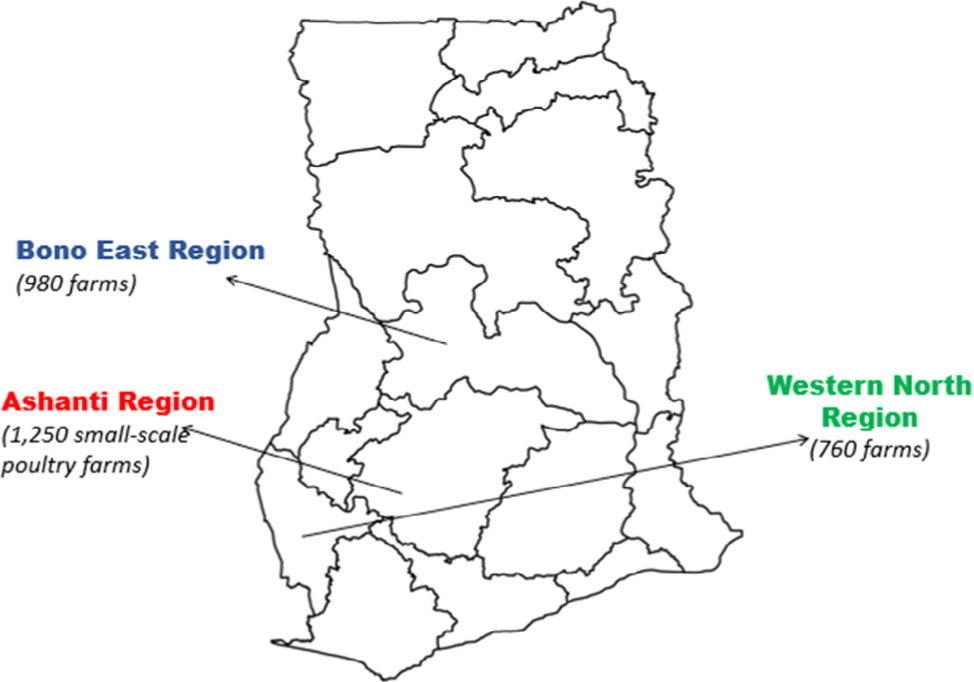
Fig. 1.
Map of Ashanti, Western North & Bono East Regions
Source: own construction using GSS (2023) boundary data and field research (2026).
| T-Bill Rate (364-day bill) | 13.25% |
| Ghana Reference Rate | 19.67% |
| Average Lending Rate | 25% |
| Interbank Interest Rates | 24.12% |
Table 2.
Initial cost outlay of a 5,000-layer capacity poultry business
| Item | Unit cost | No of units | Battery cage | Deep litter |
|---|---|---|---|---|
| Total amount (GH₵) | ||||
| Buildings and facilities | ||||
| Land | 50,000.00 | 50,000.00 | ||
| Poultry pens (layers) | 6500 per 160 birds | 32 | 208,000.00 | 0.00 |
| Farmhouse and Warehouse | 550,000.00 | 1 | 550,000.00 | 550,000.00 |
| Furniture, fittings and computers | 150,000.00 | 150,000.00 | 150,000.00 | |
| Subtotal (GH₵) | 958,000.00 | 750,000.00 | ||
| Machinery and equipment | ||||
| Sorting machines | 50,000.00 | 1 | 50,000.00 | 50,000.00 |
| Subtotal | 50,000.00 | 50,000.00 | ||
| Vehicles | ||||
| Delivery trucks | 250,000.00 | 1 | 250,000.00 | 250,000.00 |
| Subtotal (GH₵) | 250,000.00 | 250,000.00 | ||
| Working capital | 459,085.40 | 452,714.81 | ||
| Subtotal (GH₵) | 459,085.40 | 452,714.81 | ||
| Grand total (GH₵) | 1,717,085.40 | 1,452,714.81 | ||
[i] Notes: (1) Working Capital refers to the short-term funds required to cover day-to-day operational expenses before revenue is generated, including day-old chicks, feed, medications, utilities, and labour for the first production cycle. The higher figure for the battery cage system (GH₵459,085.40 vs. GH₵452,714.81) reflects greater maintenance requirements and system-specific operational inputs. (2) Poultry Pens (layers): In the deep litter system, birds are housed on wood-shaving-covered floors within the standard farmhouse structure, the cost of which is already captured under “Farmhouse and Warehouse” (GH₵550,000). No additional cage structures are required; hence GH₵0.00. In the battery cage system, 32 multi-tier metal cage units at GH₵6,500 each (GH₵208,000 total) replace the floor-based housing arrangement and are therefore listed separately.
Table 3.
Revenue analysis for deep litter system
| Total expected revenue | Moratorium period | Year 1 | Year 2 | Year 3 | Year 4 | Year 5 |
|---|---|---|---|---|---|---|
| 302,648 | 1,758,239 | 1,846,151 | 1,938,458 | 2,035,381 | 2,137,150 | |
| Expected selling price GH₵ | ||||||
| Eggs | 57.00 | 57.00 | 59.85 | 62.84 | 65.98 | 69.28 |
| Spent layers | 100.00 | 100.00 | 105.00 | 110.25 | 115.76 | 121.55 |
| Expected sales | ||||||
| Eggs (crates) | 5,310 | 26,548 | 26,548 | 26,548 | 26,548 | 26,548 |
| Spent layers | 0 | 2,450 | 2,450 | 2,450 | 2,450 | 2,450 |
| Expected production & purchase | ||||||
| Expected layers – 1st generation | 2,500 | 2,500 | 2,500 | 2,500 | 2,500 | 2,500 |
| Expected layers – 2nd generation | 0 | 2,500 | 2,500 | 2,500 | 2,500 | 2,500 |
| Expected egg production per year (crates) | 5,418 | 27,090 | 27,090 | 27,090 | 27,090 | 27,090 |
| Egg production efficiency | 75% | 75% | 75% | 75% | 75% | 75% |
| Feed (kilogram) | 34,219 | 88,969 | 88,969 | 88,969 | 88,969 | 88,969 |
Table 4.
Revenue analysis for battery cage system
| Total expected revenue | Moratorium period | Year 1 | Year 2 | Year 3 | Year 4 | Year 5 |
|---|---|---|---|---|---|---|
| 363,177 | 2,060,886 | 2,163,931 | 2,272,127 | 2,385,734 | 2,505,020 | |
| Expected selling price GH₵ | ||||||
| Eggs | 57.00 | 57.00 | 59.85 | 62.84 | 65.98 | 69.28 |
| Spent layers | 100.00 | 100.00 | 105.00 | 110.25 | 115.76 | 121.55 |
| Expected sales | ||||||
| Eggs (crates) | 6,372 | 31,858 | 31,858 | 31,858 | 31,858 | 31,858 |
| Spent layers | 0 | 2,450 | 2,450 | 2,450 | 2,450 | 2,450 |
| Expected production & purchase | ||||||
| Expected layers – 1st generation | 2,500 | 2,500 | 2,500 | 2,500 | 2,500 | 2,500 |
| Expected layers – 2nd generation | 0 | 2,500 | 2,500 | 2,500 | 2,500 | 2,500 |
| Expected egg production per year (crates) | 6,502 | 32,508 | 32,508 | 32,508 | 32,508 | 32,508 |
| Egg production efficiency | 90% | 90% | 90% | 90% | 90% | 90% |
| Feed (kilogram) | 34,219 | 88,969 | 88,969 | 88,969 | 88,969 | 88,969 |
Table 5.
Profit projections for deep litter system (GH₵)
| Income from operation | Moratorium period | Year 1 | Year 2 | Year 3 | Year 4 | Year 5 |
|---|---|---|---|---|---|---|
| 302,648 | 1,758,239 | 1,846,151 | 1,938,458 | 2,035,381 | 2,137,150 | |
| Cost of production | ||||||
| Purchases of DOC | 65,000 | 72,800 | 81,536 | 91,320 | 102,279 | 114,552 |
| Purchases of finished feed | 181,359 | 471,534 | 471,534 | 471,534 | 471,534 | 471,534 |
| Farm overhead | 6,053 | 35,165 | 36,923 | 38,769 | 40,708 | 42,743 |
| Direct wages | 80,811 | 120,678 | 135,159 | 151,378 | 169,544 | 189,889 |
| Water | 5,400 | 8,280 | 9,522 | 10,950 | 12,593 | 14,482 |
| Electricity | 7,200 | 9,660 | 11,109 | 12,775 | 14,692 | 16,895 |
| Depreciation | 23,000 | 23,000 | 23,000 | 23,000 | 23,000 | 23,000 |
| Insurance | 10,500 | 10,500 | 10,500 | 10,500 | 10,500 | 10,500 |
| Maintenance charge | 10,500 | 12,075 | 13,886 | 15,969 | 18,365 | 21,119 |
| Total cost of production | 389,823 | 763,692 | 793,170 | 826,197 | 863,213 | 904,715 |
| Administration expenses | ||||||
| Cost of additional admin staff. | 68,634 | 91,512 | 105,239 | 121,025 | 139,178 | 160,055 |
| Depreciation | 72,500 | 72,500 | 72,500 | 72,500 | 72,500 | 72,500 |
| General admin expenses | 18,257 | 20,996 | 24,146 | 27,767 | 31,932 | 36,722 |
| Total admin expenses | 159,391 | 185,008 | 201,884 | 221,292 | 243,611 | 269,277 |
| Net profit before interest | –246,567 | 809,539 | 851,097 | 890,969 | 928,557 | 963,158 |
| Interest charges/service charge | 370,697 | 431,453 | 372,900 | 297,909 | 201,866 | 78,861 |
| Net profit (loss) before tax | –617,264 | 378,085 | 478,196 | 593,060 | 726,691 | 884,297 |
| Tax | – | – | – | – | – | – |
| Net profit after tax | –617,264 | 378,085 | 478,196 | 593,060 | 726,691 | 884,297 |
| Net profit margin (%) | 22% | 26% | 31% | 36% | 41% |
Table 6.
Profit projections for battery cage system (GH₵)
| Income from operation | Moratorium period | Year 1 | Year 2 | Year 3 | Year 4 | Year 5 |
|---|---|---|---|---|---|---|
| 363,177 | 2,060,886 | 2,163,931 | 2,272,127 | 2,385,734 | 2,505,020 | |
| Cost of production | ||||||
| Purchases of DOC | 65,000 | 72,800 | 81,536 | 91,320 | 102,279 | 114,552 |
| Purchases of finished feed | 181,359 | 471,534 | 471,534 | 471,534 | 471,534 | 471,534 |
| Farm overhead | 7,264 | 41,218 | 43,279 | 45,443 | 47,715 | 50,100 |
| Direct wages | 80,811 | 120,678 | 135,159 | 151,378 | 169,544 | 189,889 |
| Water | 5,400 | 8,280 | 9,522 | 10,950 | 12,593 | 14,482 |
| Electricity | 7,200 | 9,660 | 11,109 | 12,775 | 14,692 | 16,895 |
| Depreciation | 29,240 | 29,240 | 29,240 | 29,240 | 29,240 | 29,240 |
| Insurance | 12,580 | 12,580 | 12,580 | 12,580 | 12,580 | 12,580 |
| Maintenance charge | 12,580 | 14,467 | 16,637 | 19,133 | 22,002 | 25,303 |
| Total cost of production | 401,434 | 780,457 | 810,596 | 844,354 | 882,178 | 924,576 |
| Administration expenses | ||||||
| Cost of additional admin staff. | 68,634 | 91,512 | 105,239 | 121,025 | 139,178 | 160,055 |
| Depreciation | 72,500 | 72,500 | 72,500 | 72,500 | 72,500 | 72,500 |
| General admin expenses | 18,257 | 20,996 | 24,146 | 27,767 | 31,932 | 36,722 |
| Total admin expenses | 159,391 | 185,008 | 201,884 | 221,292 | 243,611 | 269,277 |
| Net profit before interest | –197,648 | 1,095,421 | 1,151,450 | 1,206,482 | 1,259,945 | 1,311,167 |
| Interest charges/service charge | 425,107 | 494,780 | 427,633 | 341,635 | 231,496 | 90,436 |
| Net profit (loss) before tax | –622,755 | 600,641 | 723,817 | 864,846 | 1,028,449 | 1,220,731 |
| Tax | – | – | – | – | – | – |
| Net profit after tax | –622,755 | 600,641 | 723,817 | 864,846 | 1,028,449 | 1,220,731 |
| Net profit margin (%) | 29% | 33% | 38% | 43% | 49% |