
INTRODUCTION
Poultry farming plays a pivotal role in Ghana’s agricultural economy, contributing significantly to food security, employment generation, and rural livelihoods. The sector has experienced steady growth over the past decade, driven by increasing domestic demand for animal protein and government support programmes aimed at reducing reliance on imported poultry products. According to the Ministry of Food and Agriculture (MoFA, 2022), small-scale poultry farming, as a critical component of the livestock subsector, serves as a vital source of income for over 70% of rural households engaged in agriculture. Recent statistics from the Ghana Statistical Service (GSS, 2023) indicate that poultry contributes approximately 38% of total meat production in the country, with an estimated annual growth rate of 5.2% between 2015 and 2022. Despite this progress, the majority of small-scale poultry enterprises operate below optimal capacity, which is due to financial constraints, poor access to credit, and high input costs, factors that undermine long-term sustainability and profitability.
Despite its socioeconomic importance, the financial viability of small-scale poultry farming in Ghana remains understudied, particularly in terms of cost structures, revenue streams, and return on investment. The existing literature has largely focused on technical production efficiencies or disease management, leaving a critical gap in understanding the financial dynamics that determine farm-level profitability. A robust financial analysis is essential for informing policy, improving access to finance, and guiding investment decisions by farmers and stakeholders along the value chain. For instance, Etuah et al. (2020) found that cost inefficiencies among small-scale broiler farms in the Ashanti Region ranged from 20% to 45%, primarily due to suboptimal feed utilisation and lack of financial record-keeping. Similarly, Yevu and Onumah (2021) reported a mean profit efficiency of only 68% among layer producers, suggesting significant room for improvement through better financial management practices. These findings underscore the need for a comprehensive financial assessment tailored specifically to small-scale operations.
The persistent challenges facing small-scale poultry farmers, including high mortality rates, volatile feed prices, and competition from cheap frozen chicken imports, further exacerbate financial instability. In this regard, financial instability refers to the inability of poultry enterprises to consistently cover their operating costs, service debt obligations, and maintain positive cash flow across production cycles (Etuah et al., 2021). This instability manifests through four compounding pathways: firstly, rising feed costs driven by imported maize and soybean prices directly compress profit margins, since feed constitutes 60–70% of total production costs; secondly, exchange rate depreciation raises the cost of imported inputs and veterinary products; thirdly, competition from low-priced frozen chicken imports depresses farmgate prices and squeezes revenues; and finally, disease outbreaks such as Newcastle disease cause sudden flock losses, eliminating revenue streams, all the time while fixed costs persist. External shocks such as inflation, currency depreciation, and fluctuating global maize and soybean prices have directly impacted feed costs, which account for up to 70% of total production expenses. Given that over 80% of commercial feed in Ghana relies on imported raw materials, local producers are highly vulnerable to exchange rate fluctuations and supply chain disruptions (Andam et al., 2017). Chibanda et al. (2022) revealed that the importation of frozen chicken, which accounted for nearly 40% of domestic poultry consumption in 2021, has depressed local prices and reduced profit margins for smallholder producers by as much as 30%. Additionally, Buckel et al. (2024) highlighted how biosecurity lapses, often due to limited financial resources, lead to recurrent disease outbreaks, further eroding farm profitability.
Access to credit and formal financial services remains a key determinant of financial performance among small-scale poultry farmers, yet institutional barriers continue to limit financial inclusion. Despite various microfinance and agricultural lending initiatives, less than 25% of small-scale poultry farmers in Ghana have access to formal credit, according to the Bank of Ghana (BOG, 2023). Without adequate capital, farmers cannot invest in improved housing, quality dayold chicks, vaccines, or automated feeding systems—critical inputs that enhance productivity and reduce risk. Anang and Kabore (2021) found that only 28% of poultry farmers in the Sunyani West District accessed formal credit, citing high interest rates (averaging 22% per annum), stringent collateral requirements, and lack of financial literacy as major impediments. Agyemang et al. (2020) further demonstrated that microcredit recipients achieved production output 15–20% higher than non-recipients, thus reinforcing the positive correlation between financial access and operational performance.
PROBLEM STATEMENT
Despite the critical role of small-scale poultry farming in enhancing food security, generating employment, and supporting rural livelihoods in Ghana, the sector continues to face significant financial and operational challenges that undermine its long-term sustainability and growth potential. A growing body of evidence indicates that while demand for poultry products has risen steadily, driven by population growth, urbanisation, and changing dietary preferences (GSS, 2023; MoFA, 2022), the majority of small-scale poultry enterprises operate at suboptimal levels of profitability and efficiency. This discrepancy between market potential and farm-level performance points to systemic weaknesses in the financial viability of smallholder poultry production, which remain poorly understood and inadequately addressed in both policy and practice.
One of the central challenges facing small-scale poultry farmers is the high cost of production, particularly feed, which accounts for approximately 60–70% of their total variable costs (Andam et al., 2017; Chibanda et al., 2022). Given that a large proportion of poultry feed ingredients, such as maize and soybean, are either imported or subject to price volatility in domestic markets, farmers are highly exposed to macroeconomic fluctuations and supply chain disruptions. This exposure is exacerbated by limited access to affordable credit, with less than 25% of small-scale poultry farmers able to secure formal financing due to stringent collateral requirements, high interest rates, and low financial literacy (Anang and Kabore, 2021; Agyemang et al., 2020). Without sufficient working capital, farmers are unable to invest in improved breeds, biosecurity measures, or mechanisation, all of which are essential for reducing mortality rates and improving productivity (Buckel et al., 2024; Etuah et al., 2020).
Moreover, the sector faces intense competition from imported frozen chicken, which has significantly distorted local markets. Data from Chibanda et al. (2022) reveal that frozen poultry imports accounted for nearly 40% of domestic consumption in 2021, forcing down local prices and eroding domestic producers’ profit margins by an estimated 25–30%. This import pressure, combined with recurrent disease outbreaks like Newcastle disease and avian influenza, further destabilises farm incomes and discourages investment in the sector (Ouma et al., 2023; Buckel et al., 2024). The absence of reliable financial records and poor cost accounting practices among smallholders also hampers accurate assessment of profitability and return on investment, limiting the ability of farmers and financial institutions to make informed decisions (Folajinmi and Peter, 2020; Etuah et al., 2021).
While several studies have examined specific aspects of poultry farming in Ghana, including disease management (Ouma et al., 2023), biosecurity adoption (Buckel et al., 2024), supply chain integration (Kusi et al., 2025), credit access (Anang and Kabore, 2021), and cost inefficiency (Etuah et al., 2020), there remains a paucity of rigorous, farm-level financial analyses that systematically evaluate the cost structure, profitability, and economic efficiency of small-scale poultry enterprises. Most existing studies rely on technical efficiency models or qualitative assessments, often neglecting key financial indicators such as net present value (NPV), benefit-cost ratio (BCR), and break-even analysis, which are essential for investment appraisal and policy design (Adams et al., 2022; Etuah et al., 2021). For instance, Yevu and Onumah (2021) assessed profit efficiency among layer producers using stochastic frontier analysis. However, they did not provide a comprehensive cost-benefit analysis, whereas Acheampong (2019) examined institutional constraints affecting farm survival without quantifying financial returns. Similarly, Adams et al. (2022) modelled vertical integration in commercial poultry systems but excluded small-scale operators, whose financial realities differ significantly from those of large agribusinesses.
Furthermore, despite the growing relevance of risk management strategies, only limited empirical research has assessed how financial instruments such as agricultural insurance influence the economic resilience of small-scale poultry farmers (Bannor et al., 2023). The lack of integrated financial assessments that combine cost structures, revenue patterns, and risk exposure limits the development of evidence-based interventions. This gap in empirical knowledge impedes the formulation of targeted policies, restricts access to finance, and undermines efforts to promote inclusive agricultural transformation.
A key but underexplored dimension of this problem is how the choice of production system, specifically battery cage versus deep litter housing, influences financial viability. The production system directly determines capital requirements, egg output efficiency, feed conversion rates, disease exposure, and labour demands. While battery cage systems achieve egg production efficiencies of approximately 90%, they require substantially higher initial investment. Deep litter systems have lower entry costs but operate at around 75% efficiency, rendering them more financially vulnerable to input cost shocks. The choice of system is therefore not merely a technical decision, it is fundamentally a financial one with long-term consequences for profitability and resilience. Yet rigorous empirical evidence quantifying this system-to-finance relationship is absent from the Ghanaian literature. This study addresses this critical gap by providing a comprehensive comparative financial assessment of both systems, with implications for investment decisions, credit policy, and agricultural development in Ghana.
LITERATURE REVIEW
Definition of key concepts
Small-scale poultry farming
Small-scale poultry farming refers to a low-input, labour-intensive system of raising chickens, primarily for meat (broilers) or egg production (layers) that is typically managed by individual households or small enterprises with limited capital, technology, and market access. According to Omondi (2019), small-scale poultry enterprises are characterised by flock sizes ranging from 50 to 1,000 birds, operations in rural or peri-urban areas, and reliance on family labour with minimal mechanisation or commercial inputs. These farms often function within semi-scavenging or deep-litter housing systems and are integral to local food systems, income generation, and poverty alleviation, particularly in low- and middle-income countries such as Ghana.
This form of production is distinct from commercial or industrial poultry operations, which involve high capital investment, vertically integrated supply chains, and large-scale mechanisation (Singh et al., 2025). In contrast, small-scale poultry farming is marked by fragmented production processes, limited access to veterinary services, poor biosecurity measures, and weak integration into formal markets (Chah et al., 2022; Chiekezie et al., 2022). As noted by Wilson (2021), these systems are commonly found in resource-poor settings, where they serve as a critical source of animal protein, household nutrition, and emergency income, especially for women and youth. In Ghana, small-scale poultry farming contributes significantly to national poultry output, accounting for over 70% of domestic chicken meat and eggs (MoFA, 2022).
The significance of small-scale poultry farming extends beyond subsistence; it plays a strategic role in enhancing food security and promoting rural economic development. Wong et al. (2017) emphasise that in low-income, food-deficient countries, small-scale poultry production acts as a “living refrigerator”, providing on-demand nutrition and a buffer against economic shocks. Furthermore, Rahman et al. (2021) highlight its resilience and adaptability during crises such as the COVID-19 pandemic, where disruptions in formal supply chains elevated the importance of localized, smallholder-based food production systems.
Despite its socioeconomic importance, small-scale poultry farming faces numerous constraints, including high mortality rates from disease outbreaks (e.g., Newcastle disease), limited access to quality day-old chicks, fluctuating feed prices, and limited access to financial services (Omondi, 2019; Chiekezie et al., 2022). These challenges are compounded by inadequate extension services and weak policy support, which hinder productivity improvements and market competitiveness. Therefore, defining small-scale poultry farming within the Ghanaian context requires not only consideration of operational scale and input intensity but also recognition of the structural, financial, and institutional barriers that shape its performance.
This conceptual understanding of small-scale poultry farming provides the foundational basis for the study’s analytical framework, particularly in assessing financial viability, cost structure, and profitability. By anchoring the definition in empirical literature from sub-Saharan Africa and similar agro-ecological zones, the study ensures conceptual clarity and contextual relevance, enabling accurate interpretation of financial performance indicators and their determinants among smallholder producers in Ghana.
Financial viability
Financial viability refers to the capacity of a farming enterprise to generate sufficient revenue to cover all operational costs, both fixed and variable, over time, while yielding a positive return on investment and sustaining long-term operations without external financial support. In the context of small-scale poultry farming, financial viability is a critical measure of economic sustainability, indicating whether the business can survive market fluctuations, absorb production risks, and provide a reliable income stream for the household (Etuah et al., 2021; Soumya & Reddy, 2021). A financially viable poultry enterprise not only breaks even but also generates surplus income that can be reinvested into improved inputs, infrastructure, or expansion, thereby enhancing productivity and resilience.
The assessment of financial viability typically involves using key economic indicators such as net profit, gross margin, benefit-cost ratio (BCR), return on investment (ROI), payback period, and break-even point. These metrics allow researchers and stakeholders to evaluate the profitability and economic efficiency of poultry operations. For instance, Etuah et al. (2021) conducted a financial analysis of broiler processing in Ghana. They found that while the enterprise was profitable (with a BCR of 1.38 and positive NPV), its viability was highly sensitive to changes in output prices and feed costs, highlighting the precarious nature of profitability in smallholder systems. Similarly, Soumya and Reddy (2021) analysed layer farms in Chittoor District, India. They reported that 68% of the farms were financially viable, with an average ROI of 24.5%, underscoring the potential for profitability when sound management practices are applied.
Effective financial management practices significantly influence financial viability. Folajinmi and Peter (2020) demonstrated that small- and medium-scale poultry farmers in Ogun State, Nigeria, who maintained proper financial records, budgeted for inputs, and monitored expenses achieved higher performance and profitability than those without such practices. This suggests that financial literacy and record-keeping are not merely administrative tasks but essential components of economic viability. Moreover, Singh et al. (2025) emphasised that while industrial poultry farms achieve economies of scale, many small-scale operations remain viable due to lower overhead costs, localised market access, and reduced transportation expenses, provided they manage inputs efficiently and minimise losses from disease and mortality.
Investment thresholds and capital adequacy also play pivotal roles in determining financial viability. Sanou, Liverpool-Tasie, and Kerr (2020) found that commercial poultry farms in Nigeria required a minimum investment threshold to achieve viability, below which operations were prone to failure due to the inability to absorb shocks or maintain consistent production cycles. This implies that undercapitalization, a common issue among small-scale poultry farmers in Ghana (Anang & Kabore, 2021) can severely undermine financial sustainability. Additionally, Valdokhina and Roiter (2020) argue that traceability systems, although often associated with large-scale operations, enhance economic viability by improving quality control, reducing waste, and increasing consumer trust, factors that can translate into premium pricing and market stability.
In the Ghanaian context, where small-scale poultry farmers face high feed costs, disease outbreaks, and competition from imported frozen chicken (Chibanda et al., 2022; Buckel et al., 2024), assessing financial viability is not merely a matter of profitability but also one of survival. Many farmers operate on thin margins, and minor disruptions in input supply or output prices can push them into loss-making territory. Therefore, understanding the determinants of financial viability, such as cost efficiency, pricing strategy, access to credit, and risk management, is essential for designing interventions that strengthen the economic foundation of small-holder poultry enterprises.
This conceptualisation of financial viability, grounded in empirical studies from sub-Saharan Africa and South Asia, provides a robust framework for analysing the economic performance of small-scale poultry farms in Ghana. It informs the selection of financial indicators used in this study. It supports the development of a comprehensive conceptual model linking management practices, input utilisation, and external factors to overall farm profitability and sustainability.
Empirical review
Eighteen empirical studies relevant to this research were reviewed and are summarised in Appendix A (Table 1), which presents each study’s context, methodology, key findings, and identified gaps. The four studies that most directly inform this study’s analytical framework are discussed below; all remaining studies are referenced in the Table 1.
Table 1.
Summary of empirical studies reviewed
| Author(s) & year | Study context / Location | Methods | Key findings | Identified gaps |
|---|---|---|---|---|
| 1 | 2 | 3 | 4 | 5 |
| Najimovich (2023) | Poultry enterprises, Southeast Asia | Secondary financial statement analysis | Transparency in financial reporting improves stakeholder trust and reinvestment rates | Focused on large commercial farms; excludes informal small-holder operations |
| Buckel et al. (2024) | Biosecurity adoption, smallholder farms, Ghana | COM-B model; Theoretical Domains Framework; qualitative | Capability, opportunity, and motivation shape biosecurity adoption; knowledge and resource access are key | No financial/economic quantification of biosecurity practices or profitability impact |
| Ouma et al. (2023) | Poultry health constraints, Northern Ghana and Tanzania | Veterinary/epidemiological survey | Newcastle disease and poor vaccination cause 30–50% mortality in unvaccinated flocks | Does not monetise disease losses or integrate them into financial framework |
| Andam et al. (2017) | Poultry feed sector, Ghana | Supply chain analysis; secondary data | 70%+ feed inputs are imported; 20% maize price rise causes 14% feed cost increase | Macro-level focus; no primary data from small-scale farmers; no farm-level financial analysis |
| Kusi et al. (2025) | Supply chain integration, poultry businesses, Ghana | Structural equation modelling | Stronger supply chain integration improves operational efficiency; supply risks reduce performance | No direct profitability/ROI measures; skewed toward semi-commercial enterprises |
| Chibanda et al. (2022) | Broiler production economics and import impact, Ghana | Partial budgeting; enterprise analysis | Frozen imports (~40% domestic consumption) depress local prices 25–30%; producers need 15–20% premium | Focuses on pricing/market distortion; limited on internal cost structures |
| Etuah et al. (2020) | Cost inefficiency, broiler farms, Ashanti Region, Ghana | Stochastic frontier production function | Mean technical inefficiency 34%; feed wastage and poor housing are key drivers | Purely technical analysis; no financial indicators (NPV, BCR, break-even); no monetary valuations |
| Omondi (2019) | Small-scale poultry, Kenyan medium-sized cities | Descriptive survey | Documents flock sizes, cycles, and revenue patterns; important for food security | No profitability indicators; no inferential analysis; limited financial utility |
| Anang & Kabore (2021) | Credit access, small-holder poultry farmers, Sunyani West, Ghana | Logistic regression | Education, experience, and FBO membership increase formal credit access likelihood | No link between credit access and financial performance outcomes |
| Folajinmi & Peter (2020) | Financial management practices, poultry farmers, Ogun State, Nigeria | Survey; correlation analysis | Record-keeping, budgeting, and expense monitoring positively correlate with profitability | Small sample (n=120); self-reported data; no control for disease or price shocks |
| Etuah et al. (2021) | Financial viability of broiler processing, Ashanti Region, Ghana | NPV, BCR, IRR, sensitivity analysis | BCR = 1.38; enterprise profitable but sensitive to feed cost and output price changes | Post-farm gate processing focus; findings less applicable to primary production smallholders |
| Agyemang et al. (2020) | Microcredit impact on poultry production, Ghana | Propensity score matching | Microcredit recipients achieve higher production levels and better input access | No long-term financial sustainability assessment; no repayment/debt burden analysis |
| Adams et al. (2022) | Vertical integration, commercial poultry production, Ghana | Count data (negative binomial) modelling | Integration reduces transaction costs and improves supply chain coordination | Excludes small-scale farmers entirely; findings not transferable to smallholder context |
| Acheampong (2019) | Investment climate constraints, small commercial farms, Ghana | Mixed methods; survival analysis | Policy inconsistency, high interest rates, and weak import regulation threaten farm survival | Survival used as proxy; no actual financial returns or profitability measured |
| Yevu and Onumah (2021) | Profit efficiency of layer producers, Ghana | Stochastic frontier analysis | Mean profit efficiency 68%; significant room for improvement in financial performance | No identification of specific practices to close efficiency gap; no credit/feed/disease linkage |
| Aboah et al. (2025) | Systemic problems in Ghana’s poultry value chain | Group model building (participatory) | Feed cost volatility, disease, and import competition identified as systemic interdependencies | Qualitative only; cannot inform investment decisions or cost-benefit analysis |
| Bannor et al. (2023) | Agricultural insurance willingness-to-pay, poultry farmers, Ghana | Discrete choice experiment | Farmers prefer index-based insurance with low premiums and quick payouts | No evaluation of how insurance adoption affects actual financial performance over time |
| Wongnaa et al. (2023) | Feed choice profitability (commercial vs. own-prepared), poultry farmers, Ghana | Enterprise analysis; cost comparison | Own-prepared feed reduces costs but lowers weight gain, resulting in reduced net returns | Limited to feed choice; no comprehensive assessment of overall farm financial viability |
[i] Note: Studies reviewed but not discussed in detail in the main text are marked in the Identified Gaps column; the four studies discussed in this section are: Andam et al., 2017; Chibanda et al., 2022; Etuah et al., 2021; Yevu and Onumah, 2021.
Andam et al. (2017) analysed Ghana’s poultry feed sector and found that over 70% of feed ingredients are imported or exposed to volatile domestic prices, with a 20% maize price rise generating a 14% increase in feed costs. This study directly contextualises the feed cost volatility assumptions and sensitivity analysis scenarios used in the present research, though its macro-level focus on supply chains rather than farm-level financial management leaves a gap this study addresses.
Chibanda et al. (2022) examined the economics of broiler production in Ghana and documented that frozen chicken imports representing nearly 40% of domestic consumption depressed local prices by 25–30%, requiring producers to secure a 15–20% price premium to remain viable. This evidence of market-level revenue pressure informs the revenue assumptions and financial viability assessment in the present study, though its focus on pricing distortion rather than internal cost structures and system-level efficiency leaves the gap this study fills.
Etuah et al. (2021) assessed the financial viability of broiler processing in the Ashanti Region using NPV, BCR, and IRR, finding the enterprise profitable (BCR = 1.38) but highly vulnerable to feed cost and output price changes. This is the closest methodological precedent for the present study and informs the selection of financial appraisal indicators used; however, its post-farm gate focus makes its findings less applicable to the primary production systems which this study directly examines.
Yevu and Onumah (2021) measured profit efficiency among layer producers in Ghana at a mean of 68% using stochastic frontier analysis, establishing an important profitability benchmark for the sector. While this study identifies the scope for improvement, it does not examine how production system design, specifically the choice between battery cage and deep litter housing, drives efficiency differences, which is the central contribution of the present analysis.
The reviewed studies collectively highlight the critical challenges facing small-scale poultry farming in Ghana, including high feed costs, disease burden, limited access to credit, and competition from imports. However, most studies suffer from one or more of the following weaknesses: narrow focus on single aspects (e.g., credit, disease, or feed) without integrating financial performance; lack of comprehensive financial indicators such as BCR, ROI, NPV, or break-even analysis; exclusion of small-scale farmers in favour of commercial or semi-commercial operations; overreliance on qualitative or technical efficiency models without monetary valuation of losses or gains; and failure to link input factors (e.g., credit, biosecurity) to actual financial outcomes.
Notably, no single study has conducted a holistic financial analysis of small-scale poultry farming in Ghana that integrates cost structure, revenue patterns, profitability indicators, and determinants of economic performance using robust primary data. This research fills that gap by applying a comprehensive financial appraisal framework inspired by Adams et al. (2022) to analyse mango chip processing and evaluate the economic viability of small-scale poultry enterprises across multiple regions in Ghana. The study augments the existing literature by quantifying financial returns, identifying key cost drivers, and assessing the impact of credit, disease, and market factors on profitability, thereby providing actionable insights for farmers, financial institutions, and policymakers.
MATERIALS AND METHODS
Description of study area
The study was conducted across three regions of Ghana: the Ashanti Region (Forest Zone), Bono Region (Transitional Zone), and Western North Region (Coastal Savannah Zone). These regions were purposively selected because they collectively account for approximately 48% of national poultry output (MoFA, 2022), host over 65% of Ghana’s small-scale poultry producers (GSS, 2023), and represent the diverse agro-ecological and socioeconomic conditions under which smallholder layer farming operates in Ghana. Key districts studied include Kumasi Metropolis and Ejura-Sekyedumase (Ashanti), Sunyani West and Dormaa East (Bono), and Sefwi Wiawso and Juaboso (Western North). These areas are situated within 200 km of major urban markets, have relatively functional input supply chains, and include both peri-urban and rural production contexts, making them suitable for a representative financial analysis. The selected regions also offer practical advantages for poultry farming. Being located within maize- and soybean-producing belts facilitates local feed sourcing at reduced costs (Andam et al., 2017). Feeder road networks and mobile connectivity support market access and veterinary service delivery (Kusi et al., 2025). Figure 1 presents a map of Ghana showing the three study regions and the distribution of small-scale poultry farms across them.
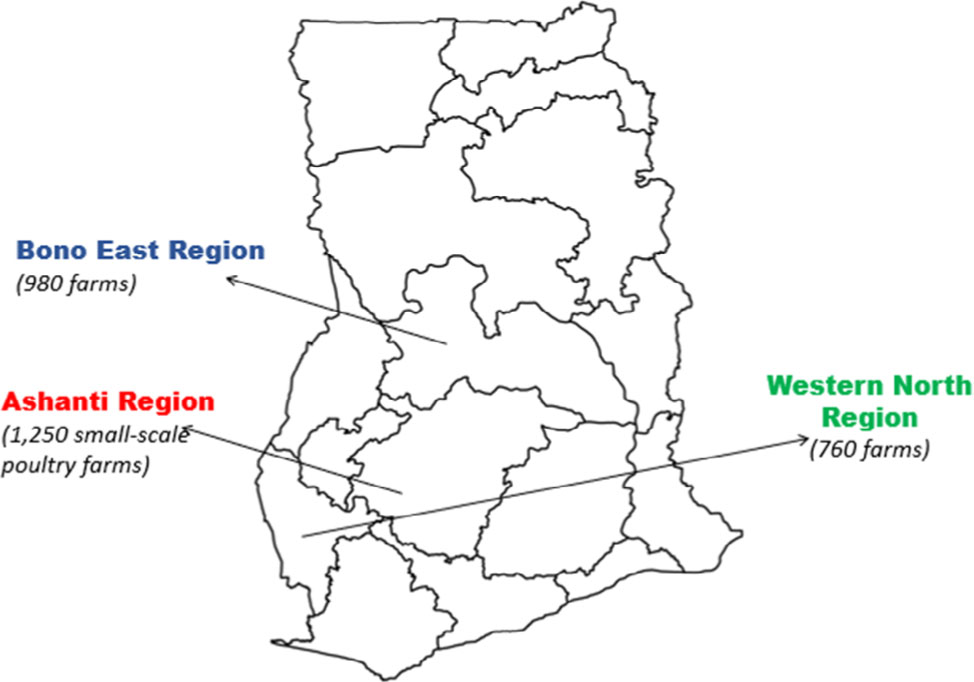
Fig. 1.
Map of Ashanti, Western North & Bono East Regions
Source: own construction using GSS (2023) boundary data and field research (2026).
Methods of data collection
This study employed a mixed-methods research design, following the framework of Creswell and Plano Clark (2018), to integrate quantitative and qualitative approaches within a single study. This enables findings to be triangulated and provides both statistical generalisability and contextual depth. Quantitative data were collected through structured questionnaires administered to 240 small-scale poultry farmers, enabling the computation of financial indicators such as NPV, IRR, gross margin, and return on investment. Qualitative data were gathered through key informant interviews (KIIs) and focus group discussions (FGDs) to contextualise the financial findings and capture farmer perspectives, institutional challenges, and market dynamics. In addition, secondary data from MoFA, GSS, and the Bank of Ghana were used to validate prices, contextualise trends, and cross-check field data. The methodology was designed to capture detailed, farm-level financial information while situating findings within broader socioeconomic, institutional, and market dynamics.
Primary data were collected through structured questionnaires, key informant interviews (KIIs), and focus group discussions (FGDs) across three major poultry-producing regions: Ashanti, Bono, and Western North. A structured questionnaire, adapted from financial analysis frameworks used in agribusiness studies (Adams et al., 2022), served as the main instrument for quantitative data collection. The questionnaire was designed to gather information on production inputs, cost structure, revenue generation, access to credit, and profitability indicators, including gross margin, net profit, and break-even point. It was augmented by sections on farmers’ demographic characteristics, flock management practices, feed sourcing, disease incidence, and marketing channels.
Prior to full-scale administration, the questionnaire was pre-tested with 15 small-scale poultry farmers in a non-sample district to assess clarity, consistency, and reliability of responses. Based on feedback, adjustments were made to improve phrasing, simplify financial recall periods (e.g., per production cycle), and standardise units of measurement (e.g., converting feed quantities into kilograms). Data were collected by trained enumerators, who had undergone a five-day workshop on ethical research practices, questionnaire administration, and accurate recording of financial data.
A multistage sampling technique was used to select 240 respondents. First, the three study regions were purposively selected based on their significance in national poultry production and representation of diverse agro-ecological zones. Within each region, two districts were randomly selected: Kumasi Metropolis and Ejura-Sekyedumase in Ashanti; Sunyani West and Dormaa East in Bono; Sefwi Wiawso and Juaboso in Western North. From each district, 40 small-scale poultry farmers were randomly sampled using the proportional allocation method, resulting in a total sample size of 240. This sample size was determined using the Cochran formula for finite populations at a 95% confidence level and 5% margin of error, ensuring statistical reliability.
In addition to household surveys, ten key informant interviews (KIIs) were conducted with stakeholders, including agricultural extension officers (n = 4), feed and veterinary input suppliers (n = 3), and representatives of farmer-based organisations (FBOs) (n = 3). These interviews provided valuable insights into systemic challenges, including feed price volatility, access to day-old chicks, disease outbreaks, and the effectiveness of government support programmes. The KIIs helped validate and enrich the quantitative findings, particularly in areas where farmer-level data might be incomplete or biased due to recall limitations.
Three focus group discussions (FGDs), one in each region, were also conducted with groups of 6–8 farmers per session. The FGDs explored shared experiences and collective strategies related to financial management, risk mitigation, and responses to market shocks such as feed cost increases or disease outbreaks. Discussions were conducted in local languages (Twi, Bono, and Sefwi), audio-recorded with consent, transcribed, and thematically analysed to identify recurring patterns and community-level insights. Survey Administration and Data Verification: All structured questionnaires were administered by a team of six trained enumerators recruited from the study regions, who were fluent in the relevant local languages (Twi, Bono, and Sefwi). Interviews were conducted face-to-face in the respondent’s preferred language. The lead researcher directly supervised at least 15% of all interviews to ensure that the protocol was adhered to. Enumerators were instructed to request available written records (purchase receipts, sales records, health logs) and to extract financial data directly from these where possible. Where no records existed, farmers recalled costs and revenues on a per-production-cycle basis, cross-checked against corroborating evidence from input suppliers and independently obtained market price benchmarks. All data were subjected to logical consistency checks upon entry; implausible values were flagged and verified through follow-up visits or calls. The reliance on farmer recall data, wherever written records were absent, is acknowledged as a study limitation that may affect the precision of individual farm-level estimates; however, the use of averaged values across 240 respondents and triangulation with secondary data sources helps mitigate systematic bias.
Secondary data were drawn from a variety of authoritative sources to complement and contextualise the primary findings. These included reports from the Ghana Statistical Service (GSS), Ministry of Food and Agriculture (MoFA), Bank of Ghana, and Agricultural Development Bank (ADB). Secondary data were particularly useful in validating input and output prices, analysing trends in frozen chicken imports (Chibanda et al., 2022), and understanding the macroeconomic factors affecting feed costs (Andam et al., 2017). Linking Survey Data to the Model Farm: The financial projections in this study are based on a hypothetical but empirically grounded model farm of 5,000 layers. This scale was selected because it represents the modal flock size among respondents operating at full commercial capacity and corresponds to the minimum viable scale for profitable egg production identified in the literature (Sanou et al., 2020). While individual surveyed farms ranged from 200 to 800 birds, the 5,000-layer model represents the aspirational commercial scale supported by government poultry development programmes ( MoFA, 2022). Survey data from 240 farmers were used to derive key model parameters as follows: input prices (feed, day-old chicks, medications, utilities) were obtained from farmer records and local market surveys; revenue parameters (egg price, spent layer price) were derived from farmer-reported transaction prices cross-validated with market data; egg production efficiency rates (90% battery cage; 75% deep litter) were computed from farmer-reported actual output relative to theoretical maximum; and labour cost structures were benchmarked from farmer interviews and scaled to 5,000-layer capacity. Parameters not directly observed from surveys, including the discount rate, loan terms, and depreciation schedules, were set using institutional data (BOG, 2023; MoFA, 2022). These are explicitly stated below in the Assumptions section.
Analytical procedure
The financial performance of small-scale poultry farming in Ghana will be analysed using a combination of financial and statistical methods. Data on costs, revenues, and farm characteristics from 240 smallholder farmers will be used to compute key indicators such as gross margin, net profit, benefit-cost ratio (BCR), return on investment (ROI), and break-even point. Discounted cash flow techniques, including net present value (NPV) and internal rate of return (IRR), will be applied over five years using a 25% discount rate to assess long-term viability. A sensitivity analysis will examine the impact of ±10% and ±20% changes in feed costs and output prices on profitability.
Partial budgeting and cost-return analysis
To evaluate the financial structure of small-scale poultry farming, a partial budgeting approach will be employed. This method enables a systematic breakdown of all production-related costs and revenues, providing a clear understanding of the enterprise’s economic performance. Costs are categorised into variable and fixed components, while revenue is derived from the sale of live birds, dressed chicken, and eggs. This analysis forms the foundation for all subsequent financial indicators.
Total Variable Cost (TVC) = Feed Cost + Day-old Chicks + Labour + Medication + Utilities + Transport
Total Fixed Cost (TFC) = Depreciation + Interest on Capital + Land Rent
Total Cost = TVC + TFC
Total Revenue (TR) = Quantity Sold × Selling Price per Unit
Decision Rule: A positive difference between revenue and total cost indicates the potential for profitability, while a negative difference signals financial loss. Depreciation Method: Fixed assets were depreciated using the straight-line method, calculated as: Annual Depreciation = (Cost of Asset − Salvage Value) ÷ Useful Life. A salvage value of zero was assumed for all assets. Estimated useful lives are: poultry housing and farmhouse structures, 20 years; battery cage units and sorting machinery, 10 years; delivery trucks, 5 years; furniture, fittings, and computers, 5 years. The straight-line method was selected for its simplicity and widespread use in agribusiness financial appraisal (Adams et al., 2022; Etuah et al., 2021).
Net profit
Net profit is a direct measure of financial performance, representing the income remaining after all production and capital costs have been deducted from total revenue. It reflects the actual economic gain to the farmer and is essential for assessing the sustainability of the enterprise over time.
Net Profit = Total Revenue − Total Cost
Decision Rule: A positive net profit indicates that the poultry enterprise is profitable; conversely, a negative value implies that costs exceed earnings, rendering the business unsustainable without intervention.
Return on Investment (ROI)
Return on investment (ROI) measures the efficiency of capital utilisation in poultry farming by expressing net profit as a percentage of total investment. This indicator is particularly useful for comparing the profitability of poultry farming with alternative income-generating activities or investments, such as savings or crop farming.
Decision Rule: An ROI greater than zero indicates profitability. The higher the ROI, the more efficient the use of capital. It is typically benchmarked against prevailing interest rates or returns from other agricultural ventures.
Net Present Value (NPV)
Net present value (NPV) accounts for the time value of money by discounting future cash flows to their present value. Given that poultry farming involves upfront capital investment in housing, equipment, and chicks, NPV provides a long-term perspective on profitability over a five-year period, aligned with the lifespan of major fixed assets.
where r = 0.25 (25% discount rate, reflecting the average commercial bank lending rate in Ghana as of 2024/2025, per Bank of Ghana, 2023; see Assumptions section below).Decision Rule:
NPV > 0 – the investment is financially viable and should be accepted.
NPV = 0 – the project breaks even.
NPV < 0 – the investment is not economically justified.
Internal Rate of Return (IRR)
The internal rate of return (IRR) is the discount rate at which the net present value of an investment equals zero. It represents the annualised rate of return on capital invested in poultry farming and is useful for comparing the attractiveness of this enterprise with other investment opportunities.
Decision Rule:
IRR > 25% (cost of capital): The investment is profitable and acceptable.
IRR < 25%: The return does not justify the risk and cost of financing.
IRR = 25%: The investment breaks even in economic terms.
Payback period
The payback period measures the time required to recover the initial investment from net cash inflows. For small-scale farmers who often operate with limited capital and high liquidity constraints, a short payback period is crucial for financial resilience and reinvestment capacity.
For uneven cash flows, cumulative cash inflows are tracked until the initial cost is fully recovered.
Decision Rule: A shorter payback period is preferred. Projects with a payback period of less than 3–4 years are generally considered acceptable for smallholder agribusinesses.
Sensitivity analysis
Sensitivity analysis evaluates how changes in key variables, particularly those subject to volatility such as feed cost and output price, affect the financial outcomes of poultry farming. Given the exposure of small-scale producers to input price shocks and competition from imported frozen chicken, this analysis assesses the robustness of the enterprise under adverse conditions.
Variables tested: ±10% and ±20% changes in feed cost and output price.
Procedure: Recalculate NPV, BCR, and break-even points under each scenario.
Decision Rule:
If NPV remains positive under all scenarios, the enterprise is resilient.
If small changes cause NPV to turn negative, the farm is highly vulnerable, indicating a need for risk mitigation strategies such as feed substitution or contract farming.
Ranging from partial budgeting to discounted cash flow analysis, the analytical techniques employed in this study are widely recognised and extensively applied in agricultural economics and agribusiness research for evaluating the financial performance of small-scale enterprises. These methods were carefully selected based on their relevance, simplicity, and practicality for assessing the economic viability of smallholder poultry farming under the resource-constrained and risk-prone conditions prevalent in Ghana.
Partial budgeting, net profit, and gross margin analyses provide a straightforward yet comprehensive picture of cost structures and profitability, making them particularly suitable for small-scale farmers who often lack formal accounting systems. These non-discounted measures are intuitive and easily interpretable, allowing both farmers and extension agents to understand the financial health of the enterprise without requiring advanced technical skills.
The inclusion of return on investment (ROI) enables a comparative assessment of poultry farming against alternative livelihood activities such as crop farming or informal trading. This ratio is especially useful for farmers making investment decisions with limited capital, as it highlights the efficiency of resource use and the relative attractiveness of poultry production.
Discounted cash flow techniques, including net present value (NPV) and internal rate of return (IRR), were employed to evaluate the long-term investment potential, taking into account the time value of money over five years. This is critical because poultry farming involves significant upfront capital in housing, equipment, and day-old chicks. Using a discount rate of 25%, consistent with the prevailing average commercial lending rate in Ghana (BOG, 2023), as stated in Assumptions section below, ensures that the analysis reflects the actual cost of capital faced by smallholder investors.
The payback period was included as a liquidity-focused indicator, recognising that many small-scale farmers prioritise quick recovery of capital due to limited financial buffers and high exposure to shocks such as disease outbreaks or market gluts.
Finally, a sensitivity analysis was conducted to assess the robustness of financial outcomes under varying scenarios, specifically with ±10% and ±20% changes in feed cost and output price. This is essential in the Ghanaian context, where macroeconomic instability, exchange rate fluctuations, and import competition create significant uncertainty for local producers (Andam et al., 2017).
Together, these techniques form a comprehensive, transparent, and policy-relevant analytical framework that balances academic rigour with practical utility. They not only enable an assessment of current profitability but also an evaluation of investment potential and resilience, making them ideal for informing farmers, financial institutions, and policymakers on strategies to enhance the sustainability of small-scale poultry farming in Ghana.
The analysis of data in this study was conducted in two complementary stages: quantitative financial appraisal and descriptive-inferential interpretation. This ensures both depth and clarity in assessing the financial performance of small-scale poultry farming in Ghana.
The core of the analysis focused on financial performance evaluation using the key financial indicators. These included gross margin, net profit, return on investment (ROI), net present value (NPV), internal rate of return (IRR), and payback period. All calculations were based on annualised data from the 2024/2025 farm cycle and were computed separately for broiler and layer enterprises to capture differences in profitability and cost structure. Sensitivity analysis was performed by simulating ±10% and ±20% changes in key variables, particularly feed cost and output price, to assess the resilience of the enterprise under adverse market conditions.
To enhance the reliability and validity of the findings, the results from the financial models were triangulated with qualitative insights obtained from key informant interviews (KIIs) and focus group discussions (FGDs). For instance, reasons for high feed costs, challenges with disease outbreaks, and difficulties in accessing credit, which were identified during interviews with extension officers, input suppliers, and farmer-based organisations, were used to interpret the quantitative outcomes and provide context to the observed profitability trends.
All financial estimates were expressed in Ghanaian cedis (GH₵) and adjusted for inflation using the Consumer Price Index (CPI) from the Ghana Statistical Service (GSS, 2023) to ensure consistency in valuation. Where applicable, costs and returns were projected over a five-year period to reflect the economic lifespan of major fixed assets such as poultry houses, feeders, and processing equipment.
The final analysis was presented using tables, graphs, and narrative interpretation to highlight key findings, regional variations, and policy implications. By integrating financial modelling with descriptive and sensitivity analysis, this method provided a robust, transparent, and actionable assessment of the economic viability of small-scale poultry farming in Ghana, offering valuable insights for farmers, financial institutions, and agricultural development agencies.
Assumptions
The financial analysis of small-scale poultry farming in this study was based on a set of realistic and context-specific assumptions necessary to standardise calculations, project financial indicators, and ensure consistency across farms with varying management practices. These assumptions were derived from field observations, farmer interviews, and existing literature on poultry production in Ghana (e.g., Etuah et al., 2020; Chibanda et al., 2022; Wongnaa et al., 2023), and are outlined below:
All the amounts are quoted in Ghana Cedi (GH₵) and are based on 2024 price levels. The base prices for the 2024/2025 production and marketing season were used for the study.
The cost of capital is 25%. This is based on the review of several investment returns and the average lending rates offered by commercial banks in Ghana, as shown below as of August 2025 in Ghana. It is assumed that producers may use a mix of equity and borrowed funds to establish and operate the production facility.
It was assumed that broiler farmers maintain a standard production cycle of six weeks per flock, with no major interruptions due to disease or feed shortages. Layer farms were assumed to operate continuously over 12 months, with steady egg production once the point of lay has been achieved (around 18–20 weeks of age).
The analysis assumed that poultry houses and equipment operated at full functional capacity. For example, if a farmer reported a housing capacity of 500 birds, it was assumed that each production cycle utilised approximately 80–90% of this capacity, accounting for minor mortality and management gaps.
While prices of feed, day-old chicks, and live birds fluctuate seasonally, the analysis used average prices for the 2024/2025 production cycle obtained from farmer records and local markets. These prices were assumed to increase by 5% per annum after Year 2 to project financial indicators over the five years.
The financial projections assumed that farmers implemented basic biosecurity measures and did not experience catastrophic disease outbreaks (e.g., Newcastle disease) during the reference period. However, average mortality rates, i.e. 5% for layers, were incorporated into cost calculations based on farmer reports and past research (Samkange, et al., 2020).
Fixed assets, such as housing structures, feeders, drinkers and generators, were depreciated using the straight-line method over their estimated useful lives (e.g., 10 years for equipment, 20 years for housing), with no salvage value assumed.
Access to Inputs and Markets: It was assumed that farmers had consistent access to key inputs (day-old chicks, feed, vaccines) and could sell their products at prevailing market prices in nearby urban centres such as Kumasi, Sunyani, and Takoradi. Transportation and marketing costs were included but assumed to remain relatively stable.
All discounted cash flow analyses (NPV, IRR) were projected over a five-year period, reflecting the average lifespan of major farm assets and aligning with investment appraisal standards in agricultural projects.
The analysis excluded any direct government subsidies or donor-funded inputs, as most small-scale poultry farmers in the study areas operate without formal support programmes. All costs and revenues reflect market-based transactions.
The analysis assumes a mix of equity and debt financing for the project, with the majority of debt funding as the prevailing average lending rate.
The analysis is based on revenue and cost of the expected 5,000 layers for both the battery cages and deep litter system.
Only relevant costs and revenues are used in the investment appraisal.
Interest on the proposed loan is assumed at 25% per annum.
A service charge of 1.5% of the loan amount is expected.
A moratorium period of 12 months is expected for the facility of such nature in Ghana.
Source of repayment is assumed to be profits accruing from the company’s operations.
Repayment period for the loan is assumed to be five (5) years.
Loan repayment has been calculated using the reducing balance method.
Due to the nature of the period, loan repayment is expected to be on a monthly basis.
Financial analysis is computed in GH₵.
The dollar value was converted to Ghana Cedis at a rate of GH₵11.00/dollar.
RESULTS AND DISCUSSIONS
Cost of set-up – comparative analysis
The initial capital requirements for a 5,000-layer capacity poultry enterprise were assessed for two housing systems: the deep litter system and the battery cage system. The cost components analysed included buildings and facilities, machinery and equipment, vehicles, and working capital.
For the deep litter system, the largest cost component was buildings and facilities, which totalled GH₵700,000.00. This comprised GH₵550,000.00 for the farmhouse and warehouse, and GH₵150,000.00 for furniture, fittings, and computers. Machinery and equipment costs were relatively low, with sorting machines accounting for GH₵50,000.00. A delivery truck was required for transportation, costing GH₵250,000.00. Working capital needs were estimated at GH₵452,714.81. The total initial investment for the deep litter system amounted to GH₵1,452,714.81.
In contrast, the battery cage system had a different cost structure, which was due to the specialised housing required. Thirty-two battery cages, each accommodating 160 birds, were installed at a cost of GH₵6,500.00 per unit, resulting in a total of GH₵208,000.00. Combined with the farmhouse and warehouse (GH₵550,000.00) and furniture, fittings, and computers (GH₵150,000.00), the subtotal for buildings and facilities reached GH₵908,000.00. Machinery and equipment costs remained unchanged at GH₵50,000.00, and the delivery truck cost was identical at GH₵250,000.00. However, the working capital requirement was higher, and was estimated at GH₵458,085.40, due to increased maintenance and operational inputs. As a result, the total initial investment for the battery cage system was GH₵1,717,085.40.
Comparatively, the battery cage system required GH₵264,370.59 (18.2%) more in initial capital outlay than the deep litter system. This additional cost was primarily attributable to the purchase of battery cages and higher working capital needs, particularly for maintenance. While the deep litter system offered a lower entry cost, the battery cage system’s higher capital intensity was partially offset by potential gains in production efficiency and increased stocking density, as discussed in subsequent sections.
The findings confirm that the battery cage system is significantly more capital-intensive than the deep litter system, with a 14.7% higher initial investment. This aligns with global trends in commercial poultry production, where specialised housing systems entail higher upfront costs but are designed to maximise long-term efficiency (Singh et al., 2025). The primary driver of the cost difference is the purchase of battery cages, a fixed asset not required in deep litter systems. Additionally, the higher working capital needs for the battery cage system reflect greater operational demands, particularly in maintenance and system-specific inputs.
Table 2.
Initial cost outlay of a 5,000-layer capacity poultry business
| Item | Unit cost | No of units | Battery cage | Deep litter |
|---|---|---|---|---|
| Total amount (GH₵) | ||||
| Buildings and facilities | ||||
| Land | 50,000.00 | 50,000.00 | ||
| Poultry pens (layers) | 6500 per 160 birds | 32 | 208,000.00 | 0.00 |
| Farmhouse and Warehouse | 550,000.00 | 1 | 550,000.00 | 550,000.00 |
| Furniture, fittings and computers | 150,000.00 | 150,000.00 | 150,000.00 | |
| Subtotal (GH₵) | 958,000.00 | 750,000.00 | ||
| Machinery and equipment | ||||
| Sorting machines | 50,000.00 | 1 | 50,000.00 | 50,000.00 |
| Subtotal | 50,000.00 | 50,000.00 | ||
| Vehicles | ||||
| Delivery trucks | 250,000.00 | 1 | 250,000.00 | 250,000.00 |
| Subtotal (GH₵) | 250,000.00 | 250,000.00 | ||
| Working capital | 459,085.40 | 452,714.81 | ||
| Subtotal (GH₵) | 459,085.40 | 452,714.81 | ||
| Grand total (GH₵) | 1,717,085.40 | 1,452,714.81 | ||
[i] Notes: (1) Working Capital refers to the short-term funds required to cover day-to-day operational expenses before revenue is generated, including day-old chicks, feed, medications, utilities, and labour for the first production cycle. The higher figure for the battery cage system (GH₵459,085.40 vs. GH₵452,714.81) reflects greater maintenance requirements and system-specific operational inputs. (2) Poultry Pens (layers): In the deep litter system, birds are housed on wood-shaving-covered floors within the standard farmhouse structure, the cost of which is already captured under “Farmhouse and Warehouse” (GH₵550,000). No additional cage structures are required; hence GH₵0.00. In the battery cage system, 32 multi-tier metal cage units at GH₵6,500 each (GH₵208,000 total) replace the floor-based housing arrangement and are therefore listed separately.
While the deep litter system offers a lower barrier to entry, making it more accessible to small-scale farmers with limited capital, the battery cage system’s design suggests a long-term investment strategy aimed at scalability and operational control. This cost structure underscores a fundamental trade-off: lower initial cost versus higher long-term efficiency. Therefore, the financial viability of each system cannot be judged solely on start-up costs but must be evaluated in conjunction with revenue generation, production efficiency, and risk resilience, factors that are explored in the following sections.
These results also highlight the importance of access to credit for farmers considering the battery cage system. Given the substantial capital requirement, most smallholders would require financing, which remains a major constraint in Ghana, where less than 25% of poultry farmers access formal credit (Anang and Kabore, 2021). This suggests that policy interventions such as targeted loan schemes or input financing could play a crucial role in enabling the adoption of more efficient but capital-intensive technologies.
Revenue analysis
Eggs are in high demand in Ghana, with the average household incorporating them into multiple meals weekly. Despite this widespread consumption, domestic egg production fails to meet existing demand due to various production and management challenges. These constraints have prompted the current government to promote a poultry rearing system tailored for small businesses (Oduro-Mensah, 2025). During field interviews, a poultry farmer in Swedru highlighted the strong market pull:
“The egg sellers come to my farm daily and take the eggs as they are produced. Due to the low supply of eggs, some sellers even make an advance payment for the eggs to be produced in the next couple of days. The major problem with the business is not the demand but operational efficiency.”
On pricing, the farmer noted:
“The prices are usually agreed by the Poultry Farmers’ Association. Once the price is agreed, we all use it. Mostly, the agreed prices are based on the sizes and grades of the eggs. But for my farm, in order to sell quickly, we do not sort and grade the eggs, but sell all at the medium-sized price. The egg sellers then spend time sorting them out and preparing them for selling. They can charge higher for the larger size eggs and lower for the smaller sizes.”
Table 3.
Revenue analysis for deep litter system
| Total expected revenue | Moratorium period | Year 1 | Year 2 | Year 3 | Year 4 | Year 5 |
|---|---|---|---|---|---|---|
| 302,648 | 1,758,239 | 1,846,151 | 1,938,458 | 2,035,381 | 2,137,150 | |
| Expected selling price GH₵ | ||||||
| Eggs | 57.00 | 57.00 | 59.85 | 62.84 | 65.98 | 69.28 |
| Spent layers | 100.00 | 100.00 | 105.00 | 110.25 | 115.76 | 121.55 |
| Expected sales | ||||||
| Eggs (crates) | 5,310 | 26,548 | 26,548 | 26,548 | 26,548 | 26,548 |
| Spent layers | 0 | 2,450 | 2,450 | 2,450 | 2,450 | 2,450 |
| Expected production & purchase | ||||||
| Expected layers – 1st generation | 2,500 | 2,500 | 2,500 | 2,500 | 2,500 | 2,500 |
| Expected layers – 2nd generation | 0 | 2,500 | 2,500 | 2,500 | 2,500 | 2,500 |
| Expected egg production per year (crates) | 5,418 | 27,090 | 27,090 | 27,090 | 27,090 | 27,090 |
| Egg production efficiency | 75% | 75% | 75% | 75% | 75% | 75% |
| Feed (kilogram) | 34,219 | 88,969 | 88,969 | 88,969 | 88,969 | 88,969 |
The projected revenue streams for a 5,000-layer capacity poultry enterprise were analysed for two distinct production systems: the battery cage and deep litter systems. Revenue was derived from the sale of eggs and spent layers, with projections spanning five years.
For the battery cage system, revenue during the establishment phase (pre-production) was estimated at GH₵363,177. In Year 1, once full operational capacity was reached, revenue increased sharply to GH₵2,060,886. Subsequent years showed steady growth: GH₵2,163,931 (Year 2), GH₵2,272,127 (Year 3), GH₵2,385,734 (Year 4), and GH₵2,505,020 (Year 5). This upward trend was attributed to annual 5% increases in selling prices and a consistent egg production efficiency of 90%. Egg production efficiency (EPE) is computed as: EPE (%) = (Actual Eggs Produced ÷ Maximum Possible Eggs) × 100, where maximum possible eggs = number of layers × number of active laying days per year. For a 5,000-layer enterprise with 300 active laying days annually, the theoretical maximum is 1,500,000 eggs (~31,250 crates). At 90% EPE (battery cage system), actual output is approximately 28,125 crates per year; at 75% EPE (deep litter system), it is approximately 23,438 crates per year. These efficiency rates were derived from farmer surveys and validated against published benchmarks (Ouma et al., 2023; Singh et al., 2025).
The deep litter system followed a similar revenue trajectory but at a lower level. Establishment-phase revenue was projected at GH₵302,648, rising to GH₵1,758,239 in Year 1. Revenues in subsequent years were GH₵1,846,151 (Year 2), GH₵1,938,458 (Year 3), GH₵2,035,381 (Year 4), and GH₵2,137,150 (Year 5). The lower performance was primarily due to a reduced egg production efficiency of 75%, resulting in fewer crates of eggs sold annually.
Across the five-year period, the battery cage system consistently outperformed the deep litter system in revenue generation. The annual revenue differential grew from GH₵60,529 in the establishment phase to GH₵367,870 in Year 5. On average, the battery cage system generated 15–18% more revenue annually. This aligns with studies that have documented significant efficiency differences between the two systems (Singh et al., 2025).
Table 4.
Revenue analysis for battery cage system
| Total expected revenue | Moratorium period | Year 1 | Year 2 | Year 3 | Year 4 | Year 5 |
|---|---|---|---|---|---|---|
| 363,177 | 2,060,886 | 2,163,931 | 2,272,127 | 2,385,734 | 2,505,020 | |
| Expected selling price GH₵ | ||||||
| Eggs | 57.00 | 57.00 | 59.85 | 62.84 | 65.98 | 69.28 |
| Spent layers | 100.00 | 100.00 | 105.00 | 110.25 | 115.76 | 121.55 |
| Expected sales | ||||||
| Eggs (crates) | 6,372 | 31,858 | 31,858 | 31,858 | 31,858 | 31,858 |
| Spent layers | 0 | 2,450 | 2,450 | 2,450 | 2,450 | 2,450 |
| Expected production & purchase | ||||||
| Expected layers – 1st generation | 2,500 | 2,500 | 2,500 | 2,500 | 2,500 | 2,500 |
| Expected layers – 2nd generation | 0 | 2,500 | 2,500 | 2,500 | 2,500 | 2,500 |
| Expected egg production per year (crates) | 6,502 | 32,508 | 32,508 | 32,508 | 32,508 | 32,508 |
| Egg production efficiency | 90% | 90% | 90% | 90% | 90% | 90% |
| Feed (kilogram) | 34,219 | 88,969 | 88,969 | 88,969 | 88,969 | 88,969 |
The revenue analysis confirms that market demand for eggs in Ghana is strong and reliable, as evidenced by direct farmer accounts of daily sales and advance payments. This aligns with national consumption trends and supports the sector’s potential for growth (GSS, 2023). However, the primary constraint is not demand, but supply-side inefficiencies, particularly in production and post-harvest handling.
The battery cage system’s superior revenue performance, averaging 15–18% higher annually, was directly linked to its 90% egg production efficiency, which is 15 percentage points higher than the 75% efficiency in the deep litter system. This efficiency gap translates into approximately 5,400 additional crates of eggs sold per year, significantly boosting gross revenue without a proportional increase in fixed costs. This finding is consistent with Singh et al. (2025), who attributed higher output in caged systems to reduced egg breakage, improved collection rates, and better feed conversion.
The pricing mechanism, governed by the Poultry Farmers’ Association, ensures market stability but also reveals a trade-off between convenience and revenue optimisation. By selling all eggs at the medium-size price, farmers forgo potential premium income from larger eggs. This practice, while expedient, highlights a gap in on-farm value addition and suggests that investments in grading and packaging infrastructure could further enhance profitability, particularly for larger operations.
The steady annual revenue growth in both systems (driven by 5% price increases) reflects inflationary pressures and market dynamics; however, it also underscores the importance of price predictability in financial planning. The battery cage system’s ability to capitalise more fully on this growth, due to higher output, demonstrates the compounding effect of production efficiency on long-term revenue.
These results reinforce the argument that financial success in layer farming is not solely dependent on market access, but critically on on-farm productivity and system design. While the deep litter system benefits from lower initial costs, its revenue limitations make it less attractive for investors seeking scalable returns. The battery cage system, despite its higher capital intensity, offers a clear revenue advantage that strengthens its case as a viable model for SMEs with access to financing
Profitability analysis
The profitability projections for a 5,000-layer poultry enterprise were assessed over five years using data from field research, with separate models for the battery cage and deep litter systems. The analysis incorporated revenues from egg and spent layer sales, production and administrative costs, and also financing charges, culminating in net profit estimates and net profit margins for each year.
In the deep litter system, the analysis showed a net loss of GH₵617,264 in the moratorium period, reflecting the high initial operating and financing costs during the moratorium period. However, the investment is expected to turn a profit in Year 1, with net profit rising to GH₵378,085 and continuing to improve to GH₵884,297 by Year 5. Over the five years, the net profit margin expanded steadily from 22% in Year 1 to 41% in Year 5, indicating improved operational efficiency and cost management as the farm stabilised.
The battery cage system demonstrated much stronger profitability performance. Although it incurred a bigger loss in the moratorium period of (GH₵622,755) due to start-up expenses and financing costs, it also turned a profit in Year 1 of GH₵600,641 compared to the deep litter system. This profitability advantage widened in subsequent years, with net profit reaching GH₵1,220,731 by Year 5. Correspondingly, the net profit margin rose from 29% in Year 1 to 49% in Year 5, driven by higher egg production efficiency (90% versus 75% for deep litter) and greater revenue generation from similar flock sizes.
Across all profitable years (Years 1–5), the battery cage system consistently outperformed the deep litter system in terms of both absolute net profit and profit margin. By Year 5, the battery cage system’s net profit exceeded that of the deep litter system by GH₵336,434, representing a 38% profitability advantage.
During our field research, the farmers indicated that the battery cage system is expected to generate more profit than the deep litter system. This superior performance is attributable to:
Higher laying efficiency: The 90% efficiency rate in the battery cage system yielded a significantly higher volume of crates of eggs sold per year, directly boosting gross revenue without proportionally raising fixed costs.
One farmer in Adenta who has both systems explained that:
“In the battery cage, the birds do not crack their eggs. They also do not require debeaking to prevent cracking. Debeaking affects the birds as they grow, and so the battery cage system can ensure adequate growth without the stress of debeaking. Also, the feed does not get mixed up with faeces, so the chances of diseases are lower.”
Table 5.
Profit projections for deep litter system (GH₵)
| Income from operation | Moratorium period | Year 1 | Year 2 | Year 3 | Year 4 | Year 5 |
|---|---|---|---|---|---|---|
| 302,648 | 1,758,239 | 1,846,151 | 1,938,458 | 2,035,381 | 2,137,150 | |
| Cost of production | ||||||
| Purchases of DOC | 65,000 | 72,800 | 81,536 | 91,320 | 102,279 | 114,552 |
| Purchases of finished feed | 181,359 | 471,534 | 471,534 | 471,534 | 471,534 | 471,534 |
| Farm overhead | 6,053 | 35,165 | 36,923 | 38,769 | 40,708 | 42,743 |
| Direct wages | 80,811 | 120,678 | 135,159 | 151,378 | 169,544 | 189,889 |
| Water | 5,400 | 8,280 | 9,522 | 10,950 | 12,593 | 14,482 |
| Electricity | 7,200 | 9,660 | 11,109 | 12,775 | 14,692 | 16,895 |
| Depreciation | 23,000 | 23,000 | 23,000 | 23,000 | 23,000 | 23,000 |
| Insurance | 10,500 | 10,500 | 10,500 | 10,500 | 10,500 | 10,500 |
| Maintenance charge | 10,500 | 12,075 | 13,886 | 15,969 | 18,365 | 21,119 |
| Total cost of production | 389,823 | 763,692 | 793,170 | 826,197 | 863,213 | 904,715 |
| Administration expenses | ||||||
| Cost of additional admin staff. | 68,634 | 91,512 | 105,239 | 121,025 | 139,178 | 160,055 |
| Depreciation | 72,500 | 72,500 | 72,500 | 72,500 | 72,500 | 72,500 |
| General admin expenses | 18,257 | 20,996 | 24,146 | 27,767 | 31,932 | 36,722 |
| Total admin expenses | 159,391 | 185,008 | 201,884 | 221,292 | 243,611 | 269,277 |
| Net profit before interest | –246,567 | 809,539 | 851,097 | 890,969 | 928,557 | 963,158 |
| Interest charges/service charge | 370,697 | 431,453 | 372,900 | 297,909 | 201,866 | 78,861 |
| Net profit (loss) before tax | –617,264 | 378,085 | 478,196 | 593,060 | 726,691 | 884,297 |
| Tax | – | – | – | – | – | – |
| Net profit after tax | –617,264 | 378,085 | 478,196 | 593,060 | 726,691 | 884,297 |
| Net profit margin (%) | 22% | 26% | 31% | 36% | 41% |
Optimised resource utilisation: Controlled feeding and reduced egg breakage in the battery cage setup contributed to a better feed-to-output conversion and lower wastage. Economies of scale in overhead absorption–similar fixed costs (administrative and depreciation)–were spread over a higher revenue base, boosting margins. From the perspective of an SME investment in Ghana, the findings suggest that while both systems achieve profitability after the first year of operations, the battery cage system offers superior returns, justifying its higher capital outlay. However, this profitability advantage is closely tied to maintaining high production efficiency and effective operational management.
The profitability analysis confirms that the battery cage system generates significantly higher net profits than the deep litter system, with a 38% higher net profit by Year 5. This aligns with the revenue analysis, where the battery cage system’s 90% production efficiency translated into greater output and income. The widening gap in profitability over time underscores the compounding effect of efficiency on long-term financial performance.
Table 6.
Profit projections for battery cage system (GH₵)
| Income from operation | Moratorium period | Year 1 | Year 2 | Year 3 | Year 4 | Year 5 |
|---|---|---|---|---|---|---|
| 363,177 | 2,060,886 | 2,163,931 | 2,272,127 | 2,385,734 | 2,505,020 | |
| Cost of production | ||||||
| Purchases of DOC | 65,000 | 72,800 | 81,536 | 91,320 | 102,279 | 114,552 |
| Purchases of finished feed | 181,359 | 471,534 | 471,534 | 471,534 | 471,534 | 471,534 |
| Farm overhead | 7,264 | 41,218 | 43,279 | 45,443 | 47,715 | 50,100 |
| Direct wages | 80,811 | 120,678 | 135,159 | 151,378 | 169,544 | 189,889 |
| Water | 5,400 | 8,280 | 9,522 | 10,950 | 12,593 | 14,482 |
| Electricity | 7,200 | 9,660 | 11,109 | 12,775 | 14,692 | 16,895 |
| Depreciation | 29,240 | 29,240 | 29,240 | 29,240 | 29,240 | 29,240 |
| Insurance | 12,580 | 12,580 | 12,580 | 12,580 | 12,580 | 12,580 |
| Maintenance charge | 12,580 | 14,467 | 16,637 | 19,133 | 22,002 | 25,303 |
| Total cost of production | 401,434 | 780,457 | 810,596 | 844,354 | 882,178 | 924,576 |
| Administration expenses | ||||||
| Cost of additional admin staff. | 68,634 | 91,512 | 105,239 | 121,025 | 139,178 | 160,055 |
| Depreciation | 72,500 | 72,500 | 72,500 | 72,500 | 72,500 | 72,500 |
| General admin expenses | 18,257 | 20,996 | 24,146 | 27,767 | 31,932 | 36,722 |
| Total admin expenses | 159,391 | 185,008 | 201,884 | 221,292 | 243,611 | 269,277 |
| Net profit before interest | –197,648 | 1,095,421 | 1,151,450 | 1,206,482 | 1,259,945 | 1,311,167 |
| Interest charges/service charge | 425,107 | 494,780 | 427,633 | 341,635 | 231,496 | 90,436 |
| Net profit (loss) before tax | –622,755 | 600,641 | 723,817 | 864,846 | 1,028,449 | 1,220,731 |
| Tax | – | – | – | – | – | – |
| Net profit after tax | –622,755 | 600,641 | 723,817 | 864,846 | 1,028,449 | 1,220,731 |
| Net profit margin (%) | 29% | 33% | 38% | 43% | 49% |
The initial losses in both systems during the establishment phase are typical of capital-intensive agribusiness ventures, where financing costs and pre-production expenses outweigh early revenue. However, the faster recovery and steeper profit growth in the battery cage system highlight its superior cash flow generation potential, a critical factor for small and medium enterprises (SMEs) with limited liquidity.
The net profit margin, rising from 29% to 49% for the battery cage system and 22% to 41% for the deep litter system, demonstrates how fixed costs are more efficiently absorbed in the higher-output system. This shift reflects the principle of economies of scale in revenue, where higher sales volume spreads fixed overheads over more units, thereby increasing margins (Singh et al., 2025).
The qualitative insights from farmers reinforce the operational advantages of the battery cage system. Reduced egg breakage, better feed utilisation, and lower disease risk due to separation of birds from droppings directly contribute to cost efficiency and profitability. These findings support Buckel et al.’s conclusions (2024), who identified biosecurity and hygiene as key determinants of financial performance in smallholder poultry systems.
However, the profitability advantage is contingent on effective management. As one farmer noted, the benefits of the battery cage system, such as reduced labour and disease risk, are only realised with proper maintenance and technical oversight. This suggests that training and extension support are essential for sustaining high efficiency, particularly for farmers transitioning from deep litter to caged systems.
Furthermore, the reliance on debt financing (evident in the high interest charges) makes profitability sensitive to interest rates. While the battery cage system can absorb these costs due to higher revenue, the deep litter system operates on a narrower margin, making it more vulnerable to changes in lending conditions. This reinforces the findings of Anang and Kabore (2021) and Agyemang et al. (2020) on the critical role of affordable credit in enhancing farm-level profitability.
In conclusion, the battery cage system offers a clear profitability advantage, driven by higher efficiency, better resource utilisation, and economies of scale. However, this financial superiority must be balanced against the higher capital requirements and technical demands, which may limit accessibility for resource-constrained farmers.
Liquidity analysis
A liquidity analysis was conducted using the current ratio and acid test ratio to assess the short-term financial health of the poultry enterprise under both the battery cage and deep litter systems. The current ratio evaluates a business’s ability to meet its short-term obligations using all current assets, while the acid test ratio (or quick ratio) provides a more conservative assessment by excluding inventory such as eggs and feed stock from current assets, thereby focusing on the most liquid resources.
For both systems, the current ratio remained well above the standard industry benchmark of 1.0 throughout the analysis period, indicating that current assets consistently exceeded current liabilities. The average current ratio was 19.6:1 for the deep litter system and 30.0:1 for the battery cage system. This significant surplus reflects strong cash flow generation and efficient receivables management, particularly in the battery cage system, which recorded higher revenue and faster turnover.
Similarly, the acid test ratio, although lower than the current ratio due to the exclusion of inventory, remained robust for both systems. The average acid test ratio was 18.3:1 for the deep litter system and 28.4:1 for the battery cage system. These high values indicate that both systems were capable of meeting their short-term liabilities without relying on the sale of inventory, underscoring their strong liquidity positions and low risk of short-term financial distress.
The liquidity analysis reveals that both the battery cage and deep litter systems exhibit exceptional short-term financial health, with current and acid test ratios far exceeding the conventional benchmark of 1.0. This suggests a very low risk of liquidity constraints during the operational phase, which is a positive signal for financial sustainability and creditworthiness.
The superior liquidity metrics of the battery cage system, with its average current ratio of 30.0:1 and acid test ratio of 28.4:1, can be attributed to its higher revenue generation, faster cash inflows, and greater operational efficiency. The system’s 90% egg production efficiency translates into more frequent and predictable sales, enhancing working capital turnover and reducing the time between production and revenue realization. This aligns with the findings of Kusi et al. (2025), who identified cash flow velocity as a key determinant of operational resilience in agribusinesses.
The deep litter system, while less liquid than the battery cage system, still demonstrated a strong liquidity position (current ratio: 19.6:1; acid test ratio: 18.3:1). This indicates that even with lower revenue, the system maintains sufficient liquid assets to cover its short-term obligations. However, the relatively lower ratios suggest a greater reliance on inventory conversion and potentially slower receivables collection, which could present risks during periods of market disruption or delayed payments.
The exceptionally high ratios for both systems reflect the conservative financial structure of the model, particularly its limited short-term debt, strong projected egg revenues, and absence of delayed receivables. In practice, such ratios are uncommon in smallholder agriculture and should be interpreted as an optimistic modelling outcome rather than a reflection of typical field conditions. In real operating environments, where farmers face payment deferrals from egg buyers, higher working capital loans, and irregular cash inflows, actual liquidity ratios would be substantially lower. This is acknowledged as a modelling limitation. As noted by Agyemang et al. (2020), limited credit access often results in underinvestment; paradoxically, while the conservative debt structure here suggests high liquidity, it may also understate the working capital pressures most smallholders actually face.
Nonetheless, the liquidity strength of both systems enhances their resilience to operational shocks, such as feed price spikes or temporary market closures. It also boosts their attractiveness to financial institutions, as strong liquidity reduces perceived risk and increases the likelihood of loan approval. This finding supports Anang and Kabore (2021), who emphasized that financial stability is a prerequisite for accessing formal credit in Ghana’s agricultural sector.
In conclusion, both housing systems demonstrate robust short-term financial health, with the battery cage system showing a clear advantage due to its higher revenue and faster cash conversion cycle. These results reinforce the financial viability of layer farming in Ghana and suggest that with improved access to finance, both systems could scale up operations without compromising liquidity.
Financial viability
The financial viability of the poultry investment was evaluated using the net present value (NPV) and internal rate of return (IRR) for both the deep litter and battery cage systems. A discount rate of 25% was applied to reflect the opportunity cost of capital and the high-risk environment typical of small and medium enterprise (SME) agribusiness ventures in Ghana.
The deep litter system yielded a net present value (NPV) of GH₵67,956 and an internal rate of return (IRR) of 27% at the 25% discount rate. The positive NPV indicated that the project was expected to generate value above the cost of capital, albeit with a narrow margin. The IRR, while slightly exceeding the hurdle rate, suggested a modest risk-adjusted return. However, the minimal surplus highlighted the system’s sensitivity to fluctuations in key variables such as feed prices, egg market prices, and production efficiency.
In contrast, the battery cage system demonstrated substantially stronger financial viability, with an NPV of GH₵777,486 and an IRR of 41% under the same discount rate. The large positive NPV indicated that the project would generate significant value over and above the investment cost, while the IRR 16 percentage points above the discount rate signalled a robust capacity to deliver high returns relative to the risk profile. This performance advantage was attributable to the system’s higher egg production efficiency (90% vs. 75%) and greater revenue potential, which amplified the benefits of economies of scale in both production and fixed cost absorption.
When compared, the battery cage system’s NPV was over 11 times greater than that of the deep litter system, while its IRR was 14 percentage points higher. This substantial difference underscores the impact of higher productivity on cash flow generation and investment returns. For SME investors in Ghana’s poultry sector, these metrics indicate that while both systems were financially viable under the study’s assumptions, the battery cage system offered a far more attractive return profile and a greater buffer against operational and market risks.
The financial viability analysis confirms that while both housing systems are economically feasible, the battery cage system is significantly more attractive from an investment perspective. The deep litter system’s marginal NPV (GH₵67,956) and IRR (27%) suggest it operates on a thin financial margin, making it vulnerable to external shocks. This aligns with the findings of Chibanda et al. (2022) and Etuah et al. (2020), who identified smallholder poultry farms as highly sensitive to input cost volatility and market competition. The narrow surplus over the 25% hurdle rate implies that even a small increase in feed costs or a decline in egg prices could render the system unviable, as confirmed in the sensitivity analysis.
In contrast, the battery cage system’s NPV of GH₵777,486 and IRR of 41% indicate a strong, resilient investment with substantial value creation potential. The high IRR suggests that the system not only compensates for the high cost of capital but also offers a significant risk premium, making it more appealing to both self-financing entrepreneurs and financial institutions. This finding aligns with that of Singh et al. (2025), who argue that capital-intensive but efficient systems can outperform low-input alternatives in the long run, particularly when market demand is stable.
The primary driver of this financial superiority is the 90% egg production efficiency in the battery cage system, which translates into higher annual revenues and better absorption of fixed costs. As Yevu and Onumah (2021) noted, profit efficiency in layer farming is closely tied to output consistency and waste minimization, both of which are optimized in caged systems. The battery cage system’s ability to maintain a high IRR even under adverse conditions (as shown in sensitivity analysis) further enhances its investment security, which is a critical factor in a sector characterized by high uncertainty.
However, the high initial capital requirement (GH₵1.72 million) remains a major barrier to entry for most small-scale farmers. This reinforces the findings of Anang and Kabore (2021) and Agyemang et al. (2020) on the critical role of credit access in enabling the adoption of productive technologies. Without affordable financing, the financial advantages of the battery cage system will remain inaccessible to the majority of smallholders.
Moreover, the use of a 25% discount rate based on average lending rates in Ghana highlights the distorted financial environment for agribusiness. In many developed economies, agricultural projects are evaluated at much lower rates, improving their apparent viability. The high hurdle rate in Ghana, however, reflects systemic financial exclusion and perceived sector risk, which in turn discourages investment.
In conclusion, while both systems are financially viable, the battery cage system offers a superior investment proposition due to its higher returns, greater resilience, and stronger cash flow generation. However, realizing these benefits requires improved access to capital, technical training, and risk management support to ensure that farmers can sustain the high efficiency levels on which the financial performance depends.
Sensitivity analysis
Feed is a major component of poultry production, and over the years, price volatility and supply shortages have disrupted operations for many small-scale farmers (Adu, 2024). As part of this study, the impact of feed cost increases on the NPV and IRR of both the deep litter and battery cage systems was analysed.
The results showed that a 10% increase in feed prices led to a significant drop in financial viability for the deep litter system. Its NPV declined from a positive GH₵67,956 to a negative GH₵436,091, rendering the investment financially unviable. Similarly, the IRR fell from 27% to approximately 12%, well below the 25% discount rate, indicating a marked increase in financial risk.
In contrast, the battery cage system demonstrated greater resilience. Despite a 10% rise in feed costs reducing its NPV from GH₵777,486 to GH₵273,438, the project remained positive. The IRR declined from 41% to 31%, still exceeding the cost of capital and indicating a robust return profile.
A 20% increase in feed prices negatively affected both systems. The battery cage system’s NPV turned negative at GH₵365,337, while the deep litter system’s NPV plummeted to GH₵1,074,866. The corresponding IRRs fell to 15% and −26%, respectively. This indicates that under severe cost shocks, even the more efficient system would face financial distress.
The sensitivity analysis revealed that the deep litter system is significantly more vulnerable to feed price volatility. A sustained 20% increase in feed costs would erode its financial viability entirely. In contrast, the battery cage system maintained a stronger financial position under adverse conditions, a resilience attributed to its higher production efficiency, which cushions the per-unit impact of rising input costs.
The sensitivity analysis underscores the critical vulnerability of small-scale poultry farming to feed price fluctuations, a finding consistent with the broader literature on agribusiness risk in sub-Saharan Africa (Andam et al., 2017; Chibanda et al., 2022). Feed accounts for 60–70% of total production costs, making it the most significant cost driver and a primary source of financial instability. The results confirm that even moderate increases in feed prices can render otherwise viable enterprises unprofitable, particularly for systems with lower production efficiency.
The deep litter system’s high sensitivity to a 10% feed cost increase, swinging from marginal profitability to deep unviability, highlights its thin financial buffer and limited capacity to absorb shocks. This aligns with the findings of Etuah et al. (2020) and Yevu and Onumah (2021), who identified cost inefficiency and poor financial resilience as key constraints in Ghana’s layer sector. The drop in IRR to 12% suggests that investors would achieve lower returns than alternative risk-free investments, making the enterprise unattractive under such conditions.
In contrast, the battery cage system’s resilience to a 10% feed price increase, maintaining a positive NPV and IRR above the hurdle rate demonstrates the protective effect of higher production efficiency. The 90% egg production rate allows for greater revenue generation, which helps absorb cost increases without immediate financial collapse. This supports Singh et al. (2025), who argue that capital-intensive but efficient systems offer superior risk-adjusted returns in volatile markets.
However, even the battery cage system becomes financially unviable under a 20% feed cost shock, with NPV turning negative and IRR falling to 15%. This outcome highlights the systemic risk posed by Ghana’s dependence on imported maize and soybean, which are subject to exchange rate fluctuations and global market dynamics (Andam et al., 2017). As Bannor et al. (2023) note, such volatility necessitates the development of risk mitigation strategies, including agricultural insurance, local feed substitution, and government price stabilization mechanisms.
The stark difference in sensitivity between the two systems reinforces the importance of efficiency in financial resilience. While the deep litter system has lower initial costs, its vulnerability to input shocks makes it a riskier long-term investment. The battery cage system, despite its higher capital intensity, offers a stronger financial buffer, making it more suitable for investors seeking stability in a high-risk environment.
These findings have important implications for policy and financial support. They suggest that interventions aimed at stabilizing feed prices, promoting local feed production, or providing input subsidies would disproportionately benefit the deep litter system. For the battery cage system, support should focus on access to credit and technical training to maintain high efficiency levels, since these are critical to its financial resilience.
In conclusion, while feed cost volatility poses a major threat to the financial sustainability of both systems, the battery cage system is better positioned to withstand moderate shocks due to its higher efficiency and economies of scale. This underscores the need for integrated risk management strategies that combine financial planning, production optimization, and policy intervention to enhance the long-term viability of small-scale poultry farming in Ghana
Non-financial considerations
The choice between the two poultry housing systems extends beyond financial metrics and involves critical non-financial factors that influence long-term sustainability, social acceptability, and operational feasibility. As part of this study, farmers were consulted on key non-financial decision points shaping their investment choices.
Firstly, the deep litter system allows birds greater freedom of movement and opportunities to express natural behaviours such as scratching, dust-bathing, and wing-stretching. This aligns more closely with international animal welfare standards and may appeal to ethically conscious consumers and retailers. In contrast, the battery cage system restricts bird mobility, which has attracted criticism from animal rights advocates and led to regulatory restrictions in several countries. The European Union, including the UK, banned conventional battery cages in 2012. Other nations with bans or phase-outs include Switzerland, Germany, Norway, Bhutan, India, and New Zealand (Appleby, 2003; Singh et al., 2025).
Secondly, battery cage systems are more mechanised and structured, reducing the physical labour required for egg collection, feeding, and cleaning. This lowers labour fatigue and reduces dependency on unskilled workers, though it demands higher technical skills for operation and maintenance. Conversely, the deep litter system is more labour-intensive, which can be an advantage in rural areas with high labour availability but limited access to technical expertise. A farmer in Swedru noted:
“If I were using a fully automated battery cage system, I could probably handle the 4,000 birds myself with little help from my family. But with the deep-litter system, I have to employ three people, which increases the cost. I have to house all these employees and pay for their utilities. This increases my cost of operations, although not substantially.”
In addition, the battery cage system offers superior disease control due to reduced direct contact between birds and faecal matter. The separation of droppings from the birds minimises the spread of infections such as coccidiosis and Newcastle disease. In contrast, the floor-based environment of the deep litter system increases exposure to pathogens, in turn necessitating stricter sanitation protocols and biosecurity measures.
Lastly, as the battery cage system requires less floor space per bird, higher stocking densities and lower land requirements are possible. This is particularly advantageous in peri-urban areas, where land prices are high. The deep litter system, by comparison, requires more land for the same flock size, which can be a factor limiting expansion near urban centres.
The findings highlight that non-financial considerations play a pivotal role in the selection of poultry housing systems, often influencing decisions independently of profitability. While the battery cage system demonstrated superior financial performance, the deep litter system offers distinct advantages in animal welfare and social responsibility, which are increasingly important in evolving consumer markets. Its alignment with natural bird behaviour supports humane production principles, potentially serving as a differentiation strategy in premium or niche markets, a trend observed globally in response to growing public concern over industrial farming practices (Singh et al., 2025).
The labour dynamics associated with each system present a trade-off between efficiency and employment. The battery cage system’s automation reduces reliance on manual labour, streamlining management and lowering operational complexity. However, this comes at the expense of job creation, a significant consideration in rural Ghana, where agriculture remains a primary source of livelihood. The deep litter system’s labour intensity, while increasing the management burden, contributes to local employment generation, which is consistent with the broader development goals of poverty reduction and inclusive growth (Omondi, 2019). As one farmer acknowledged, while employing workers raised costs marginally, it also strengthened community ties and provided income security for others.
From a biosecurity and health management perspective, the battery cage system clearly outperforms the deep litter system. By minimizing bird-to-droppings contact, it significantly reduces the risk of faecal-oral transmission of diseases like coccidiosis and Newcastle disease, major constraints in smallholder poultry production (Ouma et al., 2023; Buckel et al., 2024). This structural advantage enhances farm resilience and reduces losses, indirectly supporting financial stability. In contrast, the deep litter system requires more rigorous hygiene protocols, including regular litter turning, disinfection, and pest control. This places a higher cognitive and managerial load on farmers.
The battery cage system’s land-use efficiency makes it better suited for peri-urban and land-constrained environments. With rising land values around cities like Kumasi and Sunyani, the ability to achieve higher stocking density without expanding an operation’s physical footprint is a major benefit. For investors with limited land access, this factor may outweigh concerns about animal welfare, especially if market demand prioritises volume over ethical production.
However, the global trend toward phasing out conventional battery cages driven by EU regulations and corporate sourcing policies raises questions about the long-term policy and reputational risks associated with this system. As Ghana seeks to integrate into regional and international value chains, producers adopting battery cages may face future compliance challenges or a consumer backlash. This highlights the need for innovation in enriched cage systems or semi-intensive free-range models that balance productivity with welfare standards.
In conclusion, while financial returns favour the battery cage system, non-financial factors such as animal welfare, labour use, disease control, and land efficiency introduce a complex layer of decision-making. For policymakers, these insights suggest that support should not focus solely on profitability but also promote sustainable, socially responsible, and context-appropriate technologies that align with both economic and ethical dimensions of agricultural development.
Discussion of findings
This study provides a comprehensive financial and operational evaluation of two dominant layer housing systems in Ghana: the battery cage and deep litter systems. The findings reveal a clear dichotomy between financial performance and non-financial sustainability, offering critical insights for investors, policymakers, and development practitioners seeking to bolster the smallholder poultry sector.
The battery cage system demonstrated superior financial performance across all key indicators. With a net present value (NPV) of GH₵777,486 and an internal rate of return (IRR) of 41%, it significantly outperformed the deep litter system, which recorded a marginal NPV of GH₵67,956 and an IRR of 27%. This financial advantage is primarily attributable to its 90% egg production efficiency, which is 15 percentage points higher than the 75% efficiency in the deep litter system. As a result, the battery cage system generated a 15–18% higher annual revenue, translating into greater economies of scale in fixed cost absorption and larger net profit margins, rising from 29% in Year 1 to 49% in Year 5. These findings align with those of Singh et al. (2025), who documented the productivity benefits of caged systems due to reduced egg breakage, improved feed conversion, and better flock management.
The sensitivity analysis further highlighted the resilience of the battery cage system to feed price volatility, a major risk factor in Ghana’s poultry sector. A 10% increase in feed costs, a realistic scenario given the country’s reliance on imported maize and soybean (Andam et al., 2017), rendered the deep litter system financially unviable (NPV turning negative). On the other hand, the battery cage system maintained a positive NPV of GH₵273,438 and an IRR above the 25% hurdle rate. This resilience underscores the protective role of high production efficiency in buffering against input cost shocks, a finding consistent with the study by Chibanda et al. (2022), who identified cost inefficiency as a key constraint for local producers.
However, the non-financial trade-offs complicate a purely economic decision. The deep litter system allows birds greater freedom of movement and opportunities for natural behaviours such as scratching and dust-bathing, aligning more closely with international animal welfare standards. This ethical advantage may serve as a marketing differentiator in premium markets, particularly as global consumers increasingly demand humane production practices (Appleby, 2003). In contrast, due to welfare concerns, the battery cage system restricts movement and has been phased out in several countries, including the EU, Switzerland, and India. As Ghana seeks to integrate into regional and international value chains, producers adopting conventional battery cages face long-term regulatory and reputational risks.
From a labour and rural development perspective, the deep litter system is more labour-intensive, which can be advantageous in rural areas with high unemployment. A farmer in Swedru noted that his deep litter operation required three employees, contributing to local income generation. While this increases operational costs marginally, it supports inclusive rural employment, itself a critical development goal (Omondi, 2019). Conversely, the automation of the battery cage system reduces labour demand but requires higher technical skills for maintenance and biosecurity, potentially excluding less-educated farmers.
The biosecurity advantage of the battery cage system is another critical factor. By separating birds from droppings, it minimizes the spread of diseases such as coccidiosis and Newcastle disease, major causes of mortality and financial loss (Ouma et al., 2023; Buckel et al., 2024). By contrast, the deep litter system, with its floor-based environment, requires more rigorous sanitation protocols, placing a higher managerial burden on farmers. This structural difference enhances the risk resilience of the battery cage system, indirectly supporting financial stability.
Furthermore, the land-use efficiency of the battery cage system makes it better suited for peri-urban areas where land prices are rising. Its higher stocking density allows for greater output per unit area, reducing land acquisition costs, a significant advantage in expanding urban markets like Kumasi and Sunyani. For investors with limited land access, this factor may outweigh welfare concerns.
Despite its financial superiority, the battery cage system’s high initial investment (GH₵1.72 million) is 14.7% greater than the deep litter system and remains a major barrier to entry for most small-scale farmers. This reinforces the findings of Anang and Kabore (2021) and Agyemang et al. (2020) on the critical role of credit access in enabling the adoption of productive technologies. Without affordable financing, the financial advantages of the battery cage system will remain inaccessible to the majority of smallholders.
Moreover, the use of a 25% discount rate reflecting the high cost of capital in Ghana highlights the distorted financial environment for agribusiness. In many developed economies, agricultural projects are evaluated at far lower rates, improving their apparent viability. The high hurdle rate in Ghana reflects systemic financial exclusion and perceived sector risk, which in turn discourages investment.
In conclusion, while both systems are financially viable, the battery cage system offers a superior investment proposition due to its higher returns, greater resilience, and stronger cash flow generation. However, realizing these benefits requires improved access to capital, technical training, and risk management support to ensure that farmers can sustain the high efficiency levels on which the financial performance depends.
For policymakers, these findings suggest a need for balanced interventions that promote productivity while safeguarding animal welfare and rural employment. This could include: targeted credit schemes for small-holders to adopt efficient but capital-intensive technologies; support for local feed production to reduce import dependency and stabilize input costs; promotion of enriched cage systems or semi-intensive free-range models that balance efficiency with welfare; and strengthening of extension services to improve financial literacy and biosecurity practices.
For investors, the battery cage system presents a robust opportunity for scalable returns, provided operational efficiency is maintained. For smallholder farmers, the deep litter system remains a viable option, particularly in rural areas with abundant labour and land, but its long-term sustainability depends on mitigating financial risks through collective action and improved market integration.
This study fills a critical gap by providing a holistic financial appraisal of small-scale layer farming in Ghana, moving beyond technical efficiency to assess real-world profitability and investment potential. It confirms that financial viability is not solely a function of market demand or input access, but is deeply intertwined with production system design, efficiency, and risk management.
CONCLUSION
This study provides a comprehensive financial and operational comparison of deep litter and battery cage layer systems in Ghana. While both systems are financially viable, the battery cage system demonstrates superior profitability and resilience. With a 14.7% higher initial investment (GH₵1.72 million), it achieves a net present value (NPV) of GH₵777,486 and an internal rate of return (IRR) of 41%. In so doing, it significantly outperforming the deep litter system (NPV: GH₵67,956; IRR: 27%) under a 25% discount rate. This advantage is driven by a 90% egg production efficiency, 15 percentage points higher than the deep litter system, which leads to superior revenue generation and economies of scale in cost absorption.
The battery cage system also exhibits stronger resilience to feed price volatility, maintaining positive NPV under a 10% feed cost increase, whereas the deep litter system becomes financially unviable. However, non-financial factors temper this financial advantage. The deep litter system fosters animal welfare through increased bird mobility and allowing natural behaviours, points which align with international standards and potential consumer preferences. It is also more labour-intensive, which may boost rural employment, although it requires more land and poses greater challenges in disease control.
For SME investors, the battery cage system offers a more attractive return on investment, provided operational efficiency is maintained. For policymakers, these findings highlight the need to strike a balance between economic viability, sustainability, and animal welfare in poultry development strategies. Future interventions should promote access to finance, feed self-sufficiency, and innovation in semi-intensive, welfare-conscious systems that integrate profitability with responsible production practices. It is important to note that all findings and policy recommendations in this study are grounded in the modelling assumptions (detailed in Assumptions section), specifically: a 5,000-layer model farm scale; a 25% cost of capital reflecting average commercial lending rates; feed and output prices based on 2024/2025 market data; and efficiency rates derived from farmer surveys in three Ghanaian regions. These conclusions are not intended as universal prescriptions; investors and policymakers are advised to conduct site-specific financial appraisals, adjusting model parameters to reflect their local capital costs, farm scale, and market conditions before making investment decisions.