
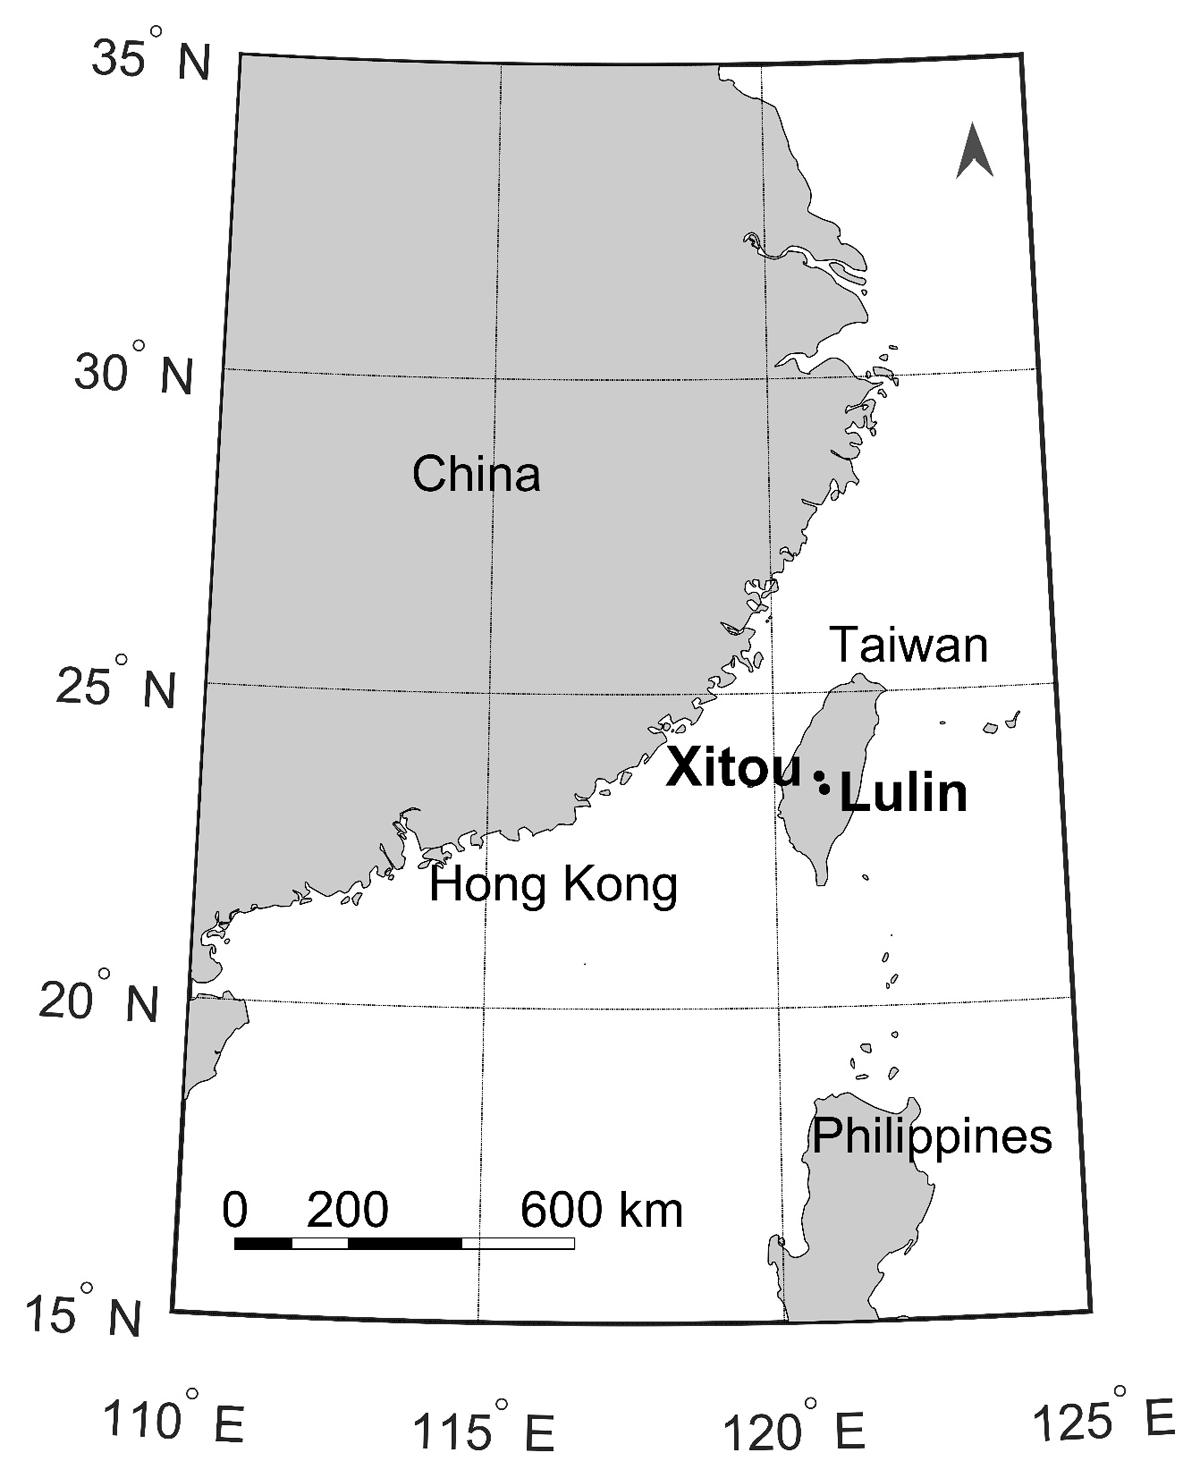
Figure 1
Map of the two study sites Xitou and Lulin in central Taiwan.
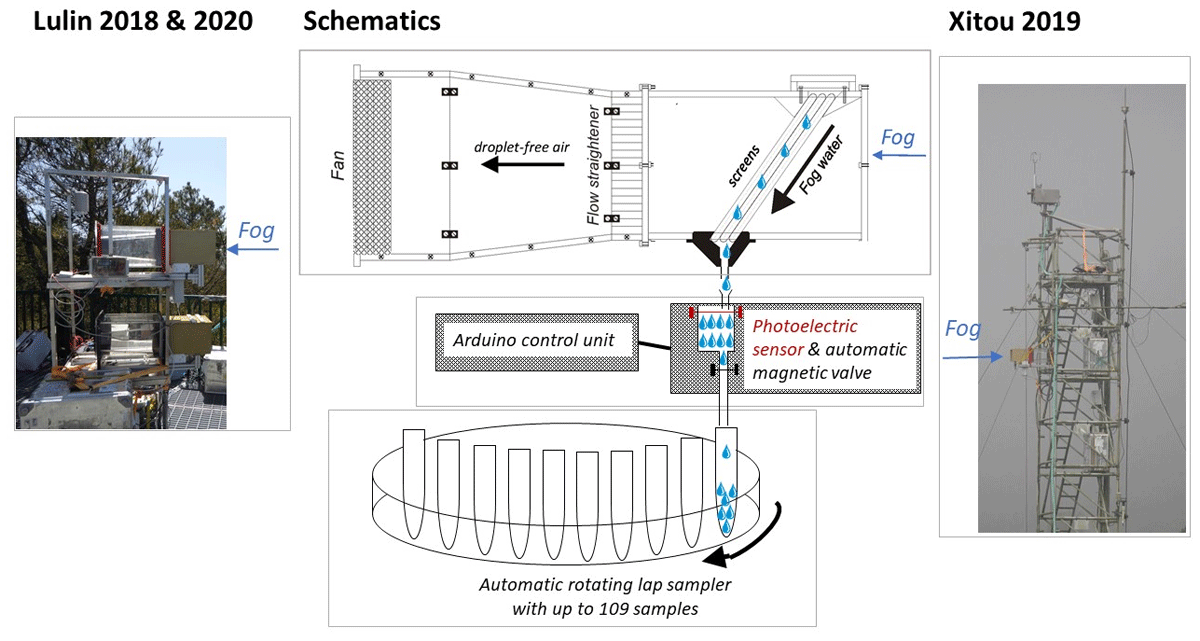
Figure 2
Photograph of the set-up at Lulin (left photograph), schematic sketch of the instrumentation (not to scale) and photograph of the setup at Xitou (right photograph: note the changed flow direction).
Table 1
Overview of the tree IOPs with statistical information of the fog water samples. Long events include a minimum of 8 subsequent samples. Lab samples are those selected for ion analysis in the laboratory.
| LOCATION | MEASURING PERIOD | DATA LOSSES | FOG FREQUENCY | NUMBER OF SAMPLES | NUMBER OF LAB SAMPLES | LONG EVENTS |
|---|---|---|---|---|---|---|
| Lulin | 16.08.2018 to 04.09.2018 (19 days) | 37% | 38% | 622 | 181 samples from 3 events | 12 |
| Xitou | 26.07.2019 to 20.08.2019 (25 days). | 27% | 11% | 98 | 98 samples from 7 events | 6 |
| Lulin | 08.03.2020 to 18.03.2020 (10 days) | <1% | 39% | 498 | 184 samples from 4 events | 6 |
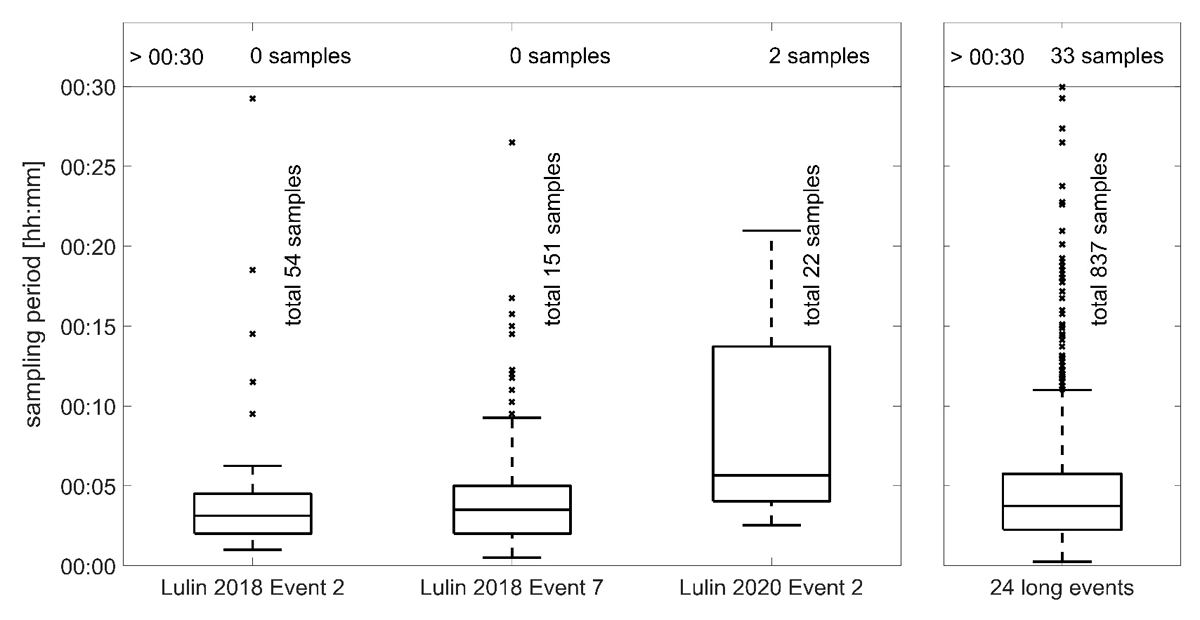
Figure 3
Boxplots of sampling periods of three longer events later discussed in detail, and of all samples of the 24 long events.
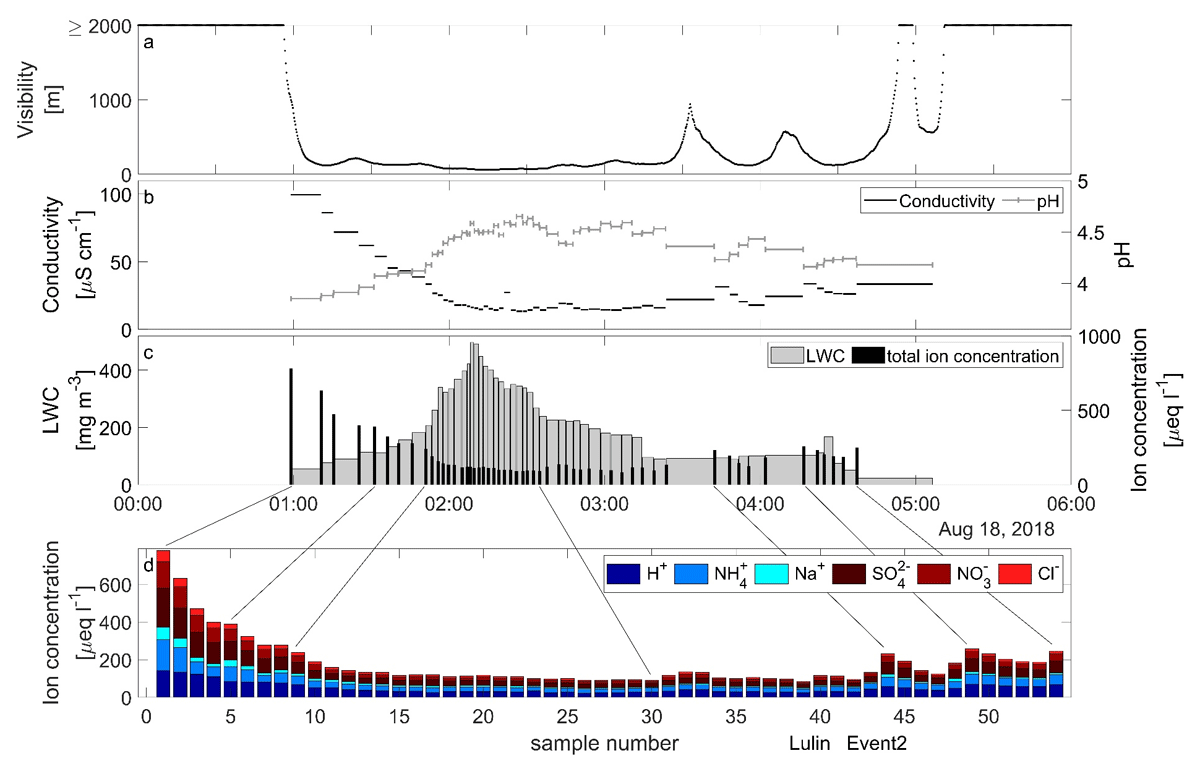
Figure 4
Time series of the fog event on the 18th of August 2018 at Lulin, showing (a) the visibility, (b) the conductivity and pH, (c) the LWC, and (d) ion concentrations.
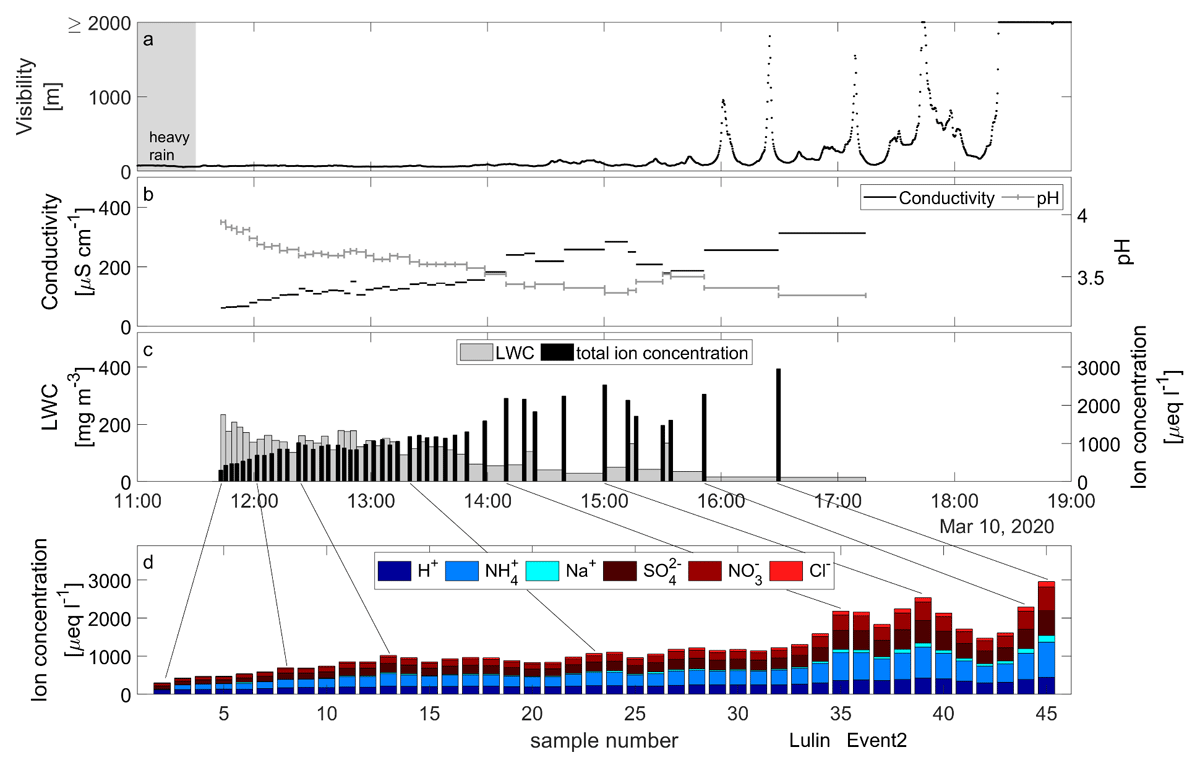
Figure 5
Time series of the fog event on the 2nd of March 2020 at Lulin showing (a) the visibility, (b) the conductivity and pH, (c) the LWC, and (d) ion concentrations.
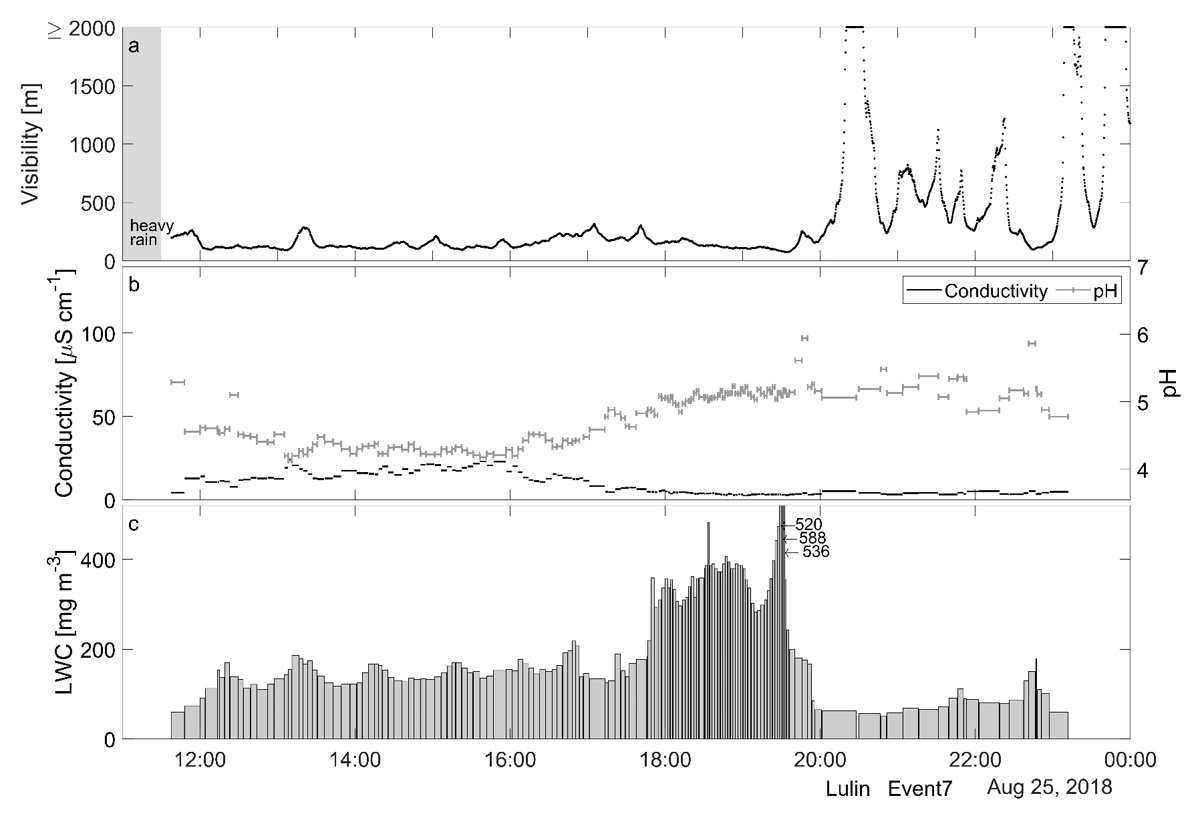
Figure 6
Time series of the fog event on the 25th of August 2018 at Lulin showing (a) the visibility, (b) the conductivity and pH, and (c) the LWC.
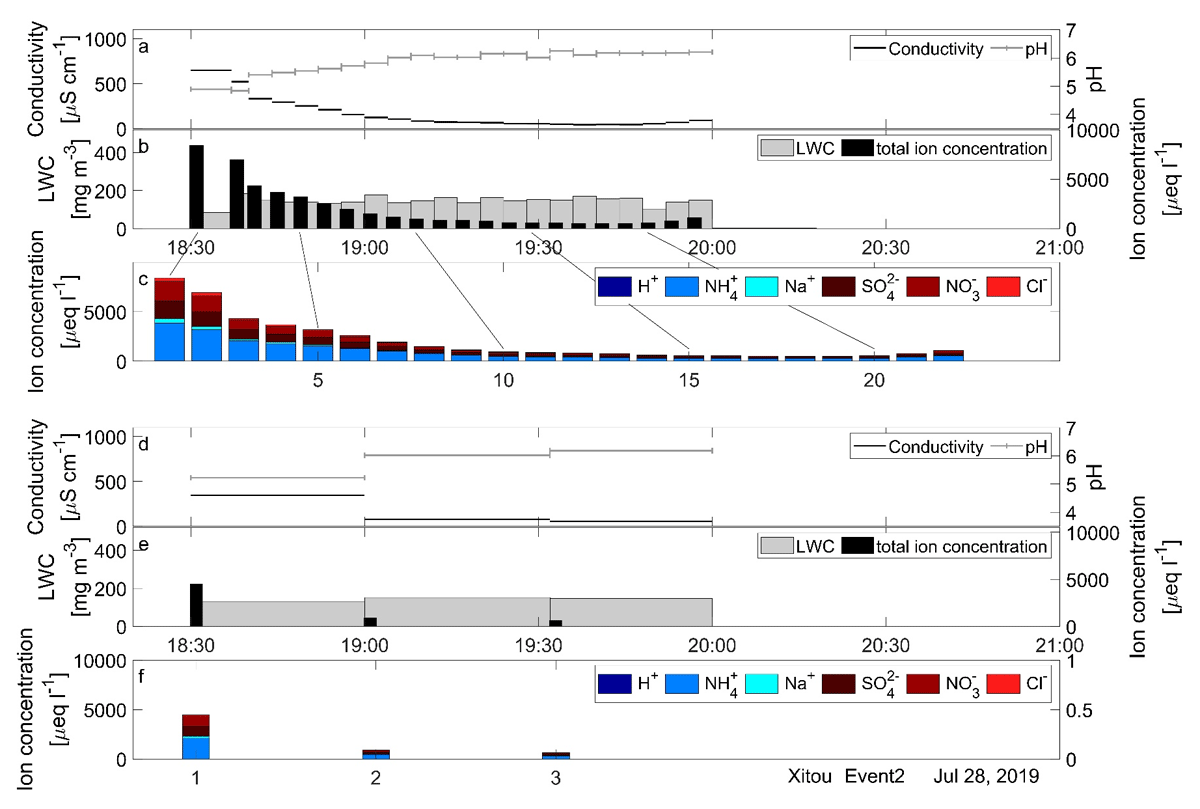
Figure 7
Time series of the fog event on the 28th of July 2019 at Xitou, showing the original samples in the upper panels for (a) conductivity and pH, (b) the LWC and total ion concentration, and (c) the ion concentrations. Averaged samples to approximate a traditional sampling procedure are shown in the lower panels for (d) conductivity and pH and (e) the LWC and total ion concentration, and (f) the ion concentrations.
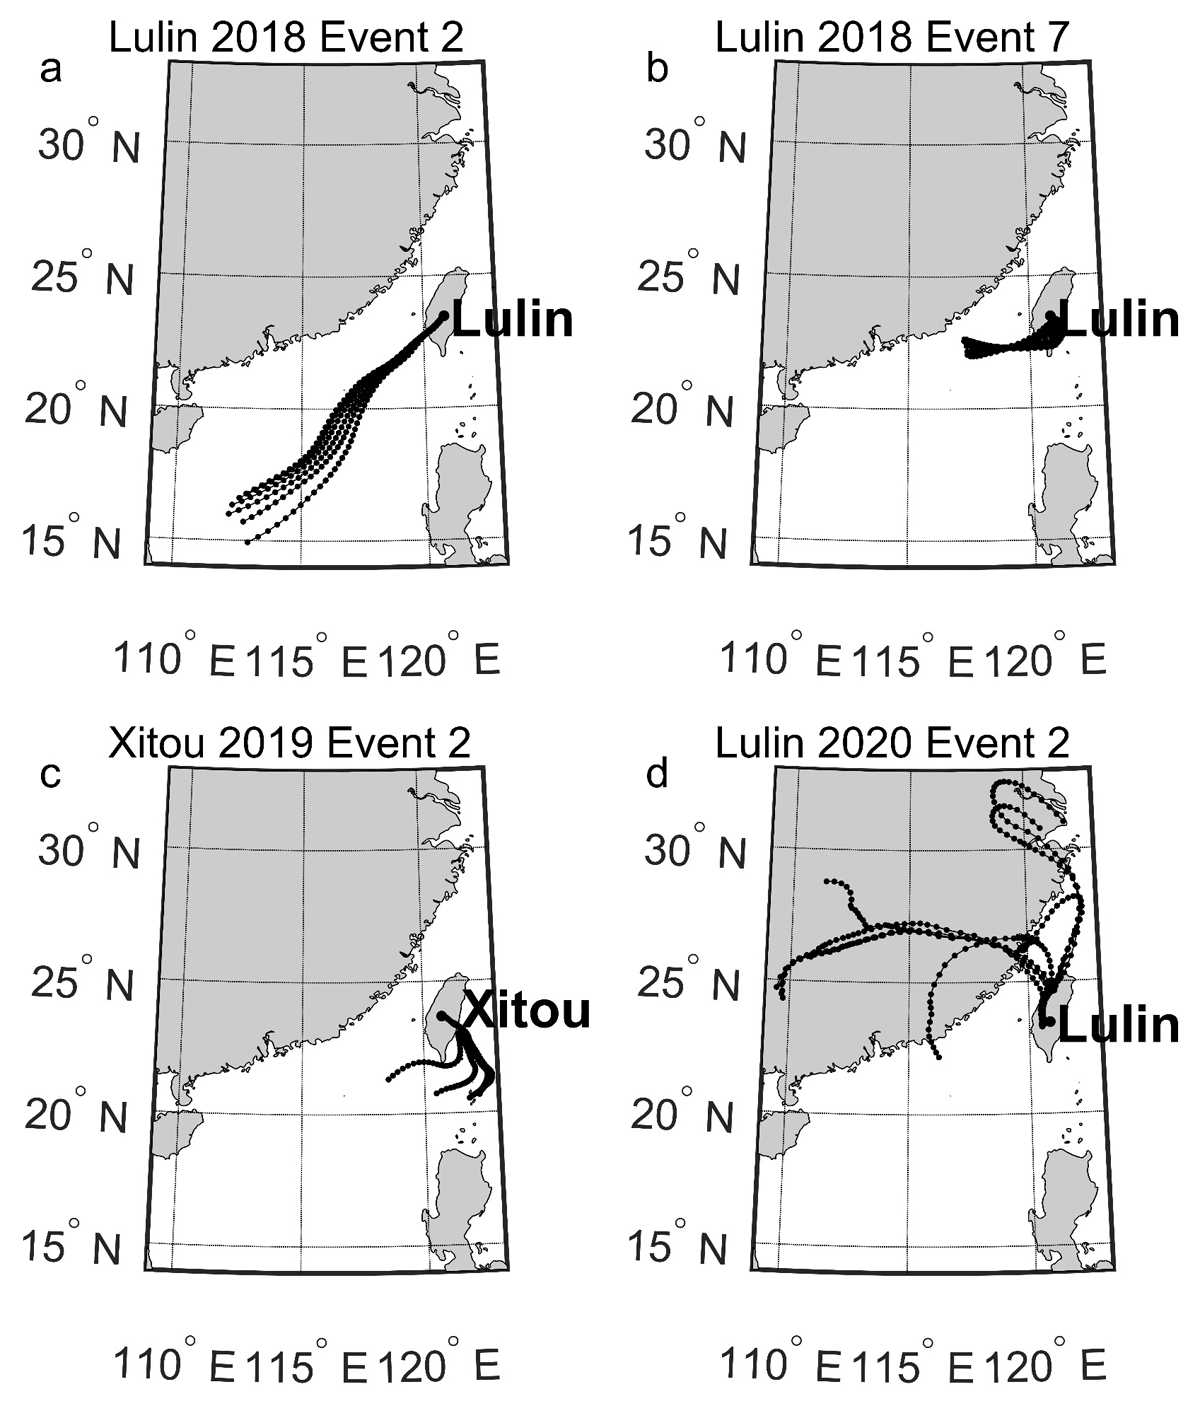
Figure 8
Backward trajectories of the last 48 hours before arrival at the study sites for the full time of the fog events at (a) Lulin, 18th of August 2018, Lulin, (b) 25th of August 2018, (c) Xitou, 28th of July 2019 and (d) Lulin, 2nd of March 2020.