
Table 1
Simulated observing platforms for the Previous (2015) and Updated (2020) GMAO NWP OSSE frameworks.
| INSTRUMENT | PLATFORM | 2015 | 2020 | ALL-SKY | CORRELATED ERRORS |
|---|---|---|---|---|---|
| AIRS | Aqua | X | X | Channel | |
| AMSR2 | GCOM W1 | X | 2020 | ||
| AMSU-A | Aqua | X | Horizontal | ||
| AMSU-A | NOAA-15 | X | X | Horizontal | |
| AMSU-A | NOAA-18 | X | X | Horizontal | |
| AMSU-A | NOAA-19 | X | X | Horizontal | |
| AMSU-A | METOP-A | X | X | Horizontal | |
| AMSU-A | METOP-B | X | X | Horizontal | |
| AMSU-A | METOP-C | X | Horizontal | ||
| ATMS | NOAA-20 | X | Horizontal | ||
| ATMS | NPP | X | X | Horizontal | |
| CrIS | NPP | X | Channel | ||
| CrIS-FSR | NPP | X | Channel | ||
| CrIS-FSR | NOAA-20 | X | Channel | ||
| GMI | GPM | X | 2020 | ||
| HIRS4 | METOP-A | X | Horizontal | ||
| IASI | METOP-A | X | X | Channel | |
| IASI | METOP-B | X | X | Channel | |
| MHS | NOAA-18 | X | Horizontal | ||
| MHS | METOP-A | X | Horizontal | ||
| MHS | METOP-B | X | X | 2020 | Horizontal |
| MHS | METOP-C | X | 2020 | Horizontal | |
| SSMIS | F17 | X | X | Horizontal | |
| Surface conventional | X | X | |||
| AMV | X | X | Horizontal, Vertical | ||
| Aircraft | X | X | |||
| Scatterometer | X | X | |||
| RAOB | X | X | Vertical | ||
| GNSS-RO | X | X | Vertical |
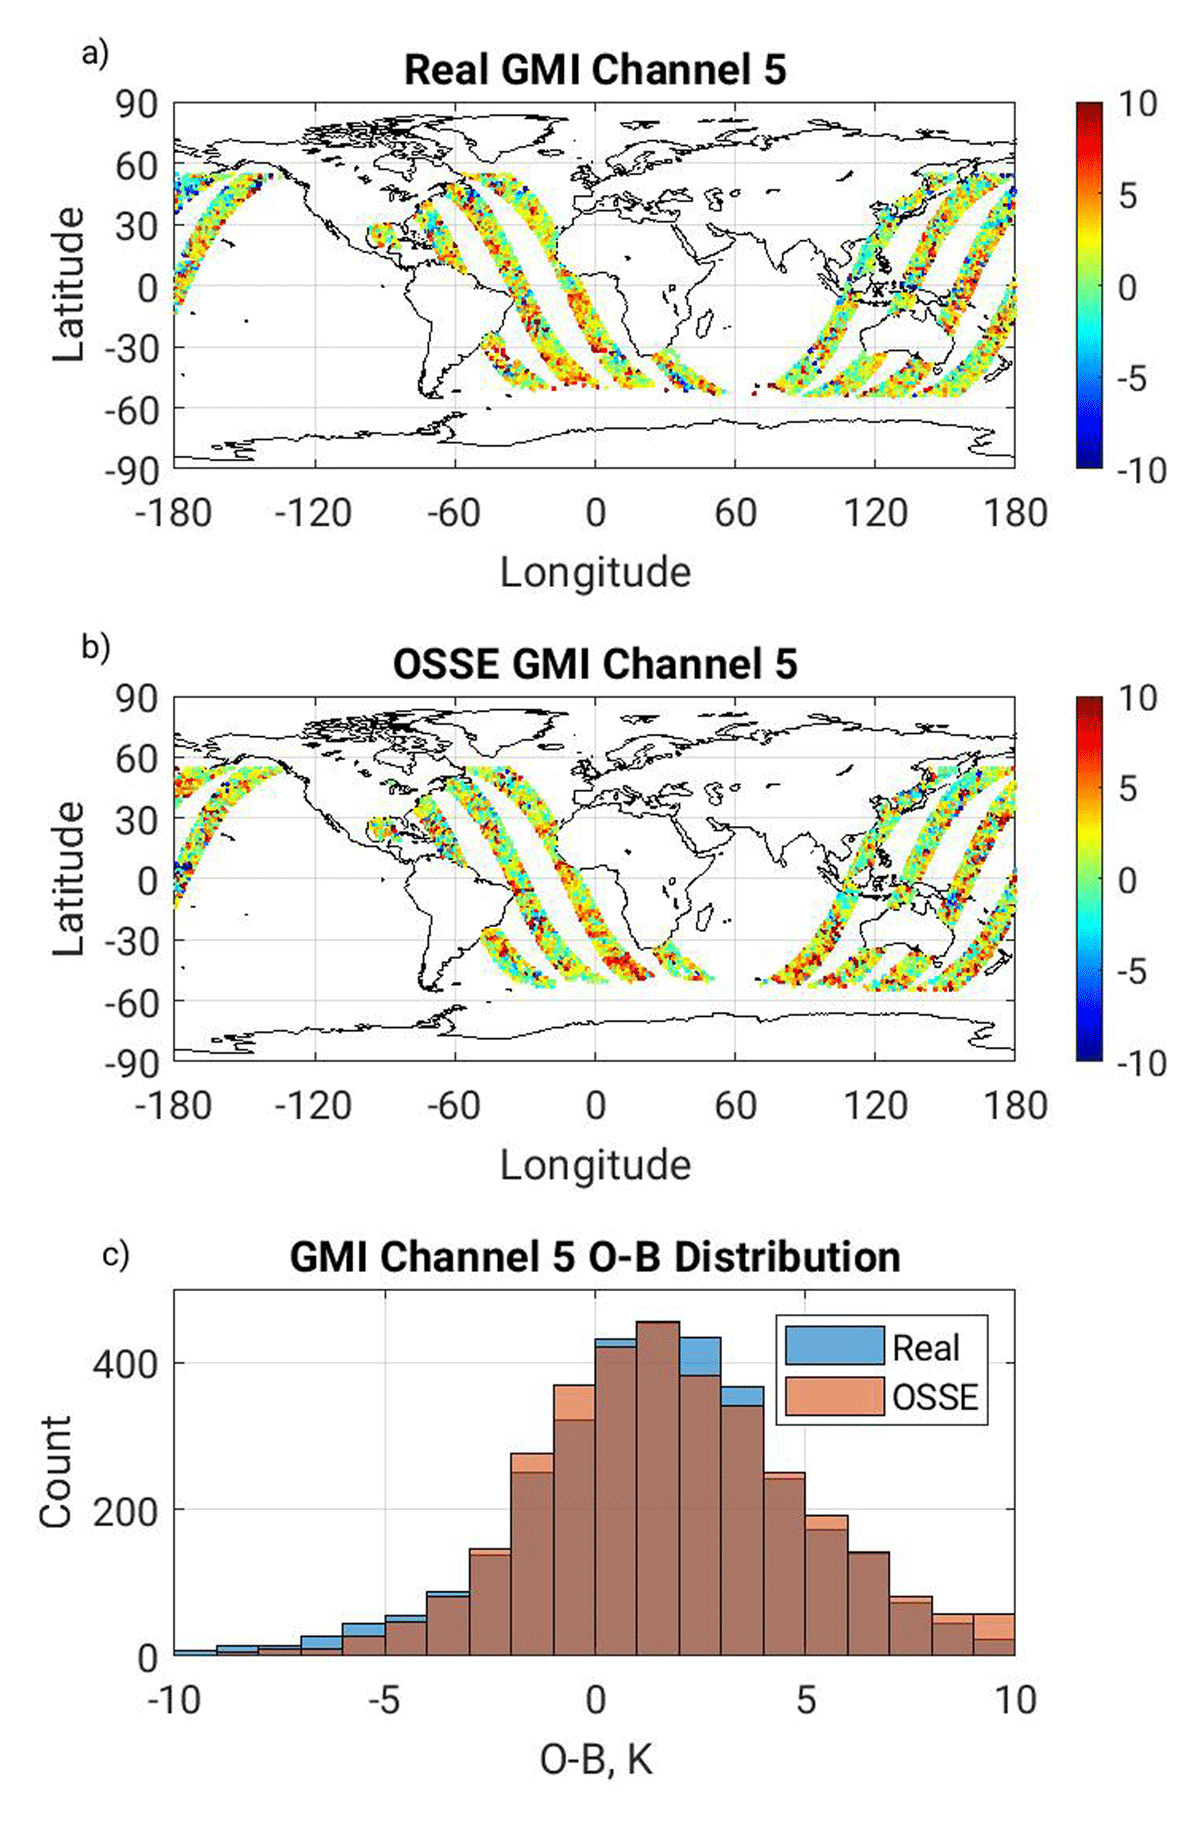
Figure 1
Comparison of real and simulated GMI observations for channel 5 on 10 July 00z in the Updated OSSE framework. a) Real GMI with brightness temperature O-B in color, K. b) Simulated GMI with brightness temperature O-B in color, K. c) histogram of brightness temperature O-B for Real and simulated GMI observations.
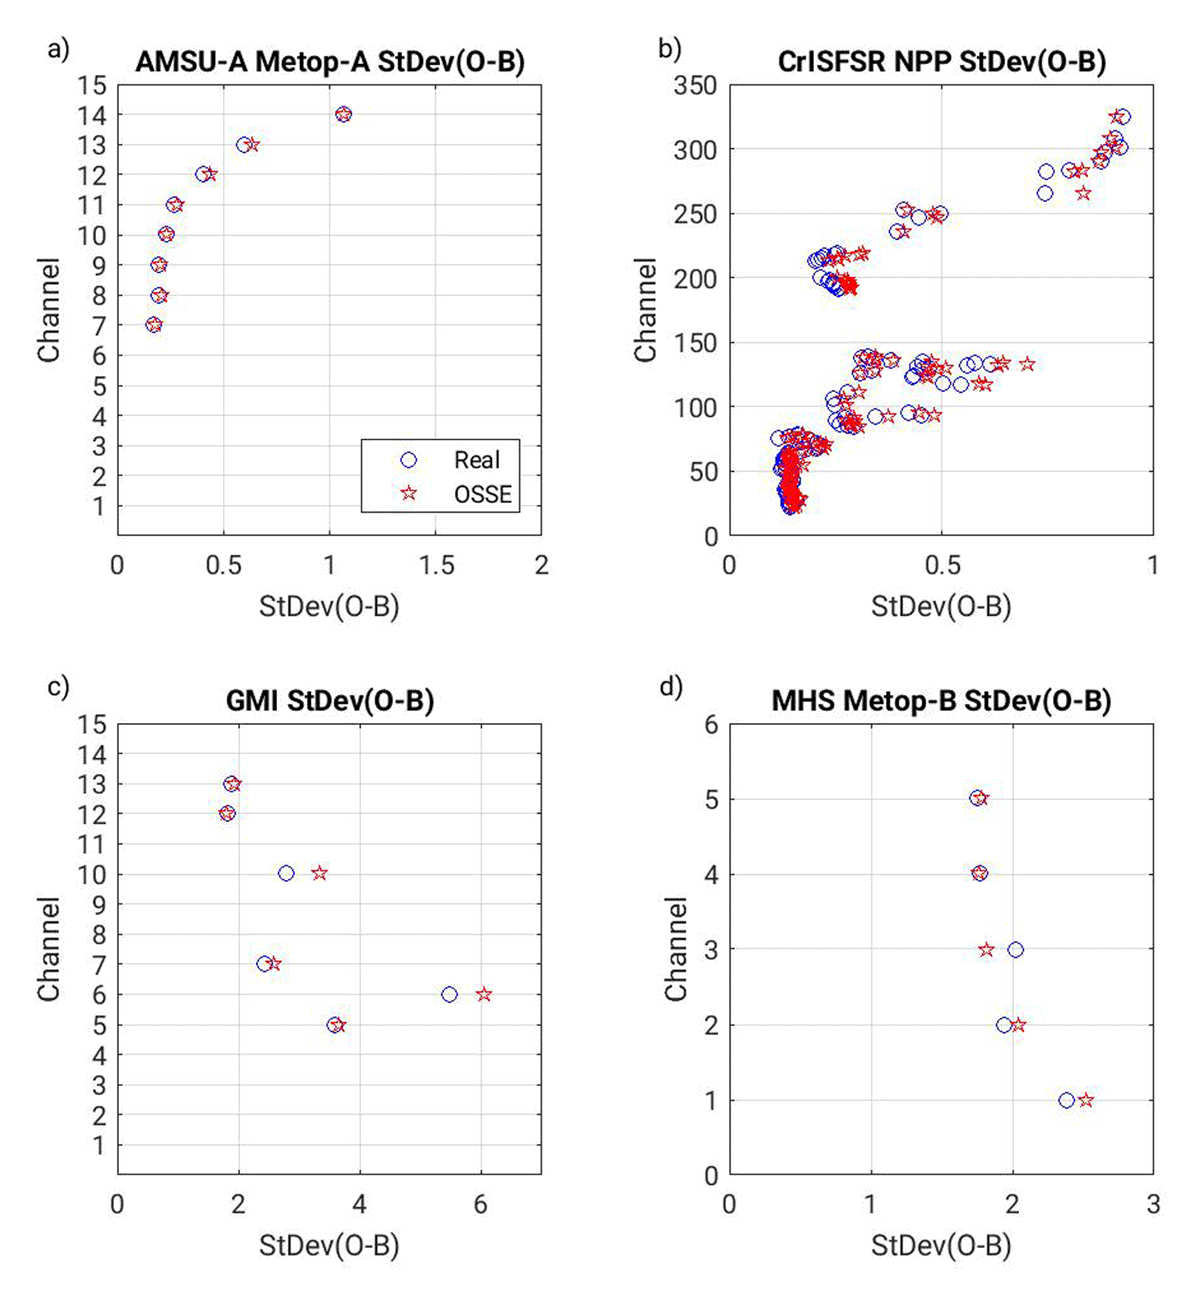
Figure 2
Comparison of standard deviation of real and simulated brightness temperature observation innovations for the month of July in the Updated OSSE framework. Blue circles, Real case; red starts, OSSE Control. a) AMSU-A Metop-A; b) CrIS NPP; c) GMI GPM; d) MHS Metop-B.
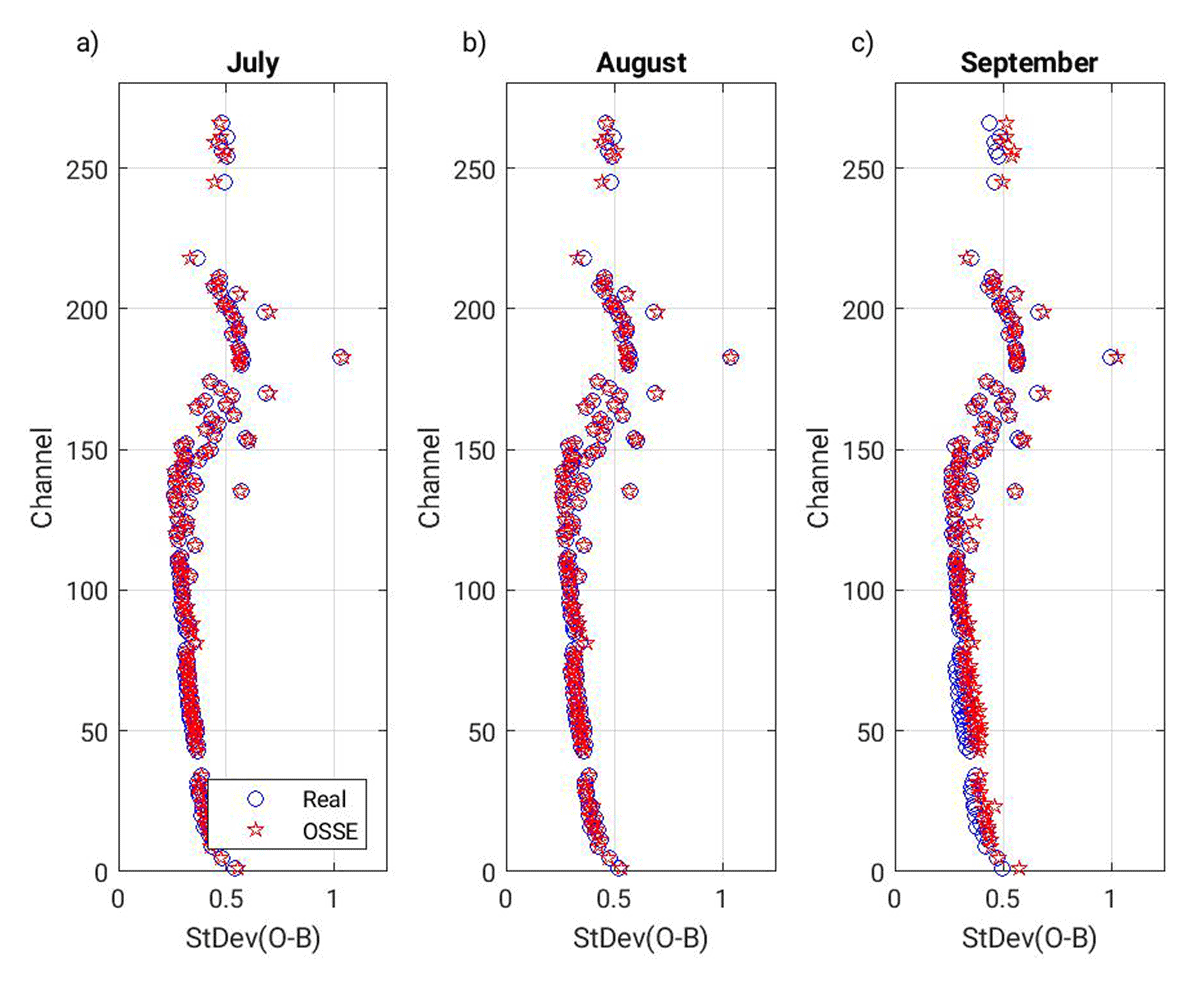
Figure 3
Comparison of standard deviation of real and simulated observation innovations for IASI Metop-A in the Updated OSSE framework. Blue circles, Real case; red starts, OSSE Control. a) July; b) August c) September.
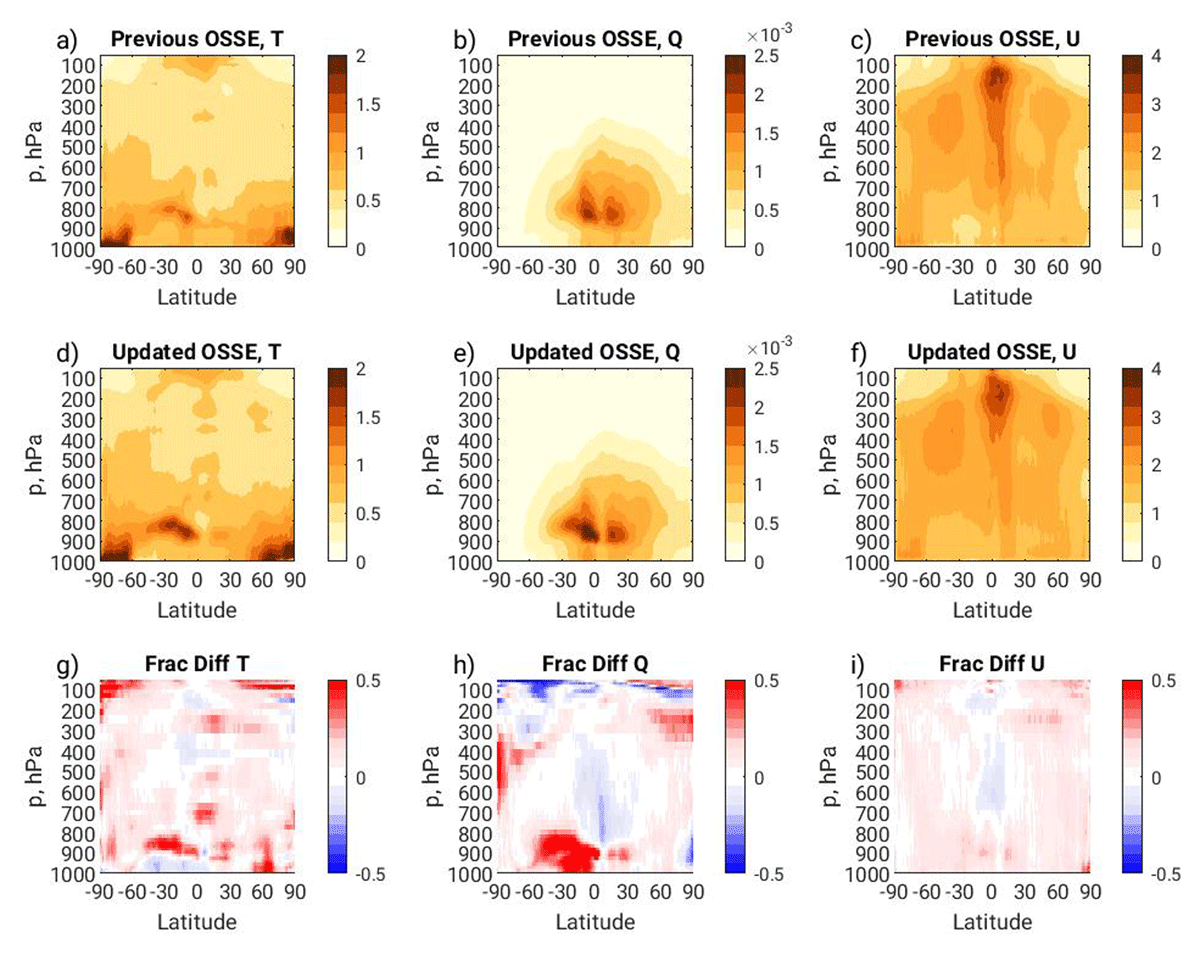
Figure 4
Zonal mean RTMS background error for the OSSE Control for the month of July, four times daily data. a,b,c) Previous OSSE framework; d,e,f) Updated OSSE framework; g,h,i) Fractional RTMS difference between frameworks, (Updated-Previous)/Previous. a,d,g) Temperature, K; b,e,h) specific humidity Q, kg kg–1; c,f,i) zonal wind, m s–1.
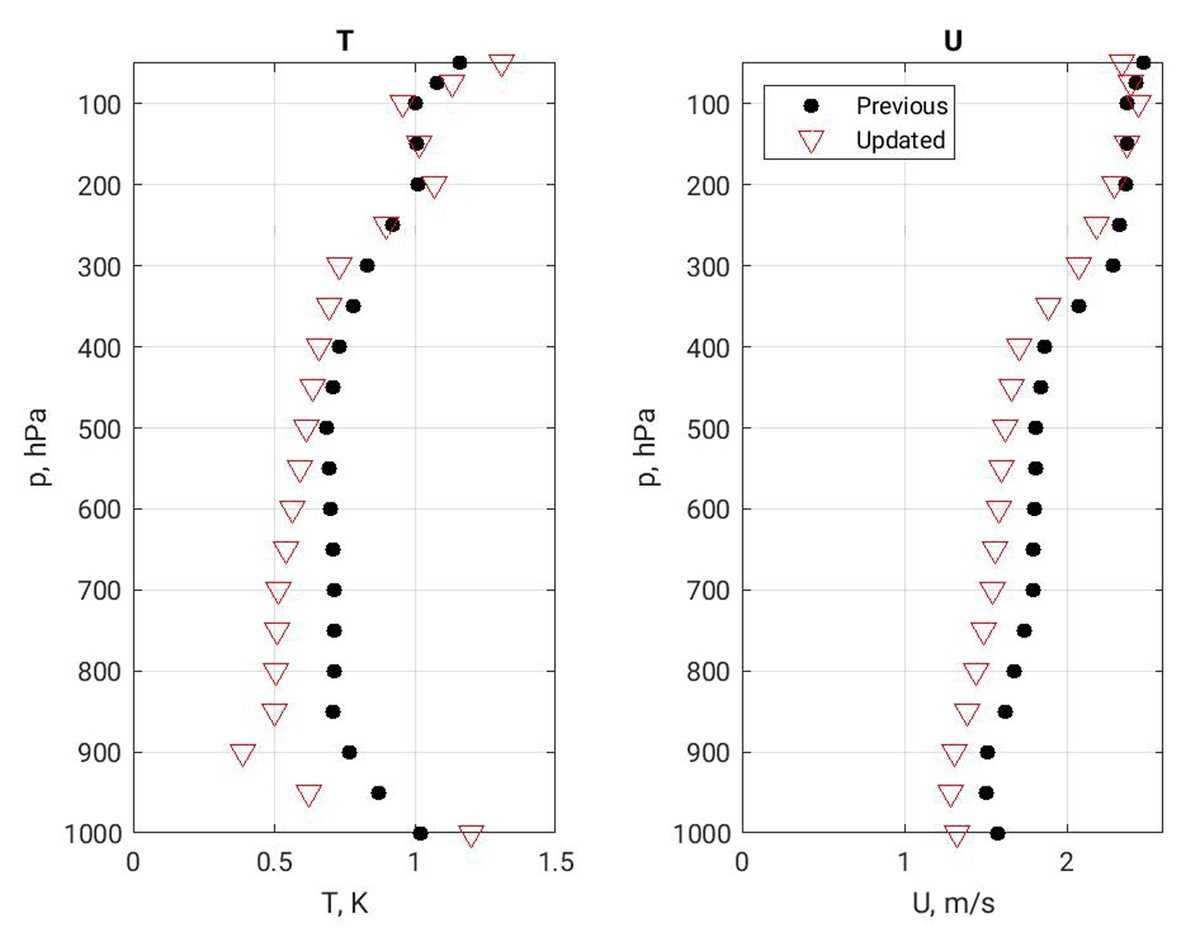
Figure 5
Magnitude of standard deviation of simulated observation error added to simulated rawinsondes in the Previous (black circles) and Updated (red triangles) OSSE frameworks. a) Temperature, K; b) Zonal wind, m s–1.
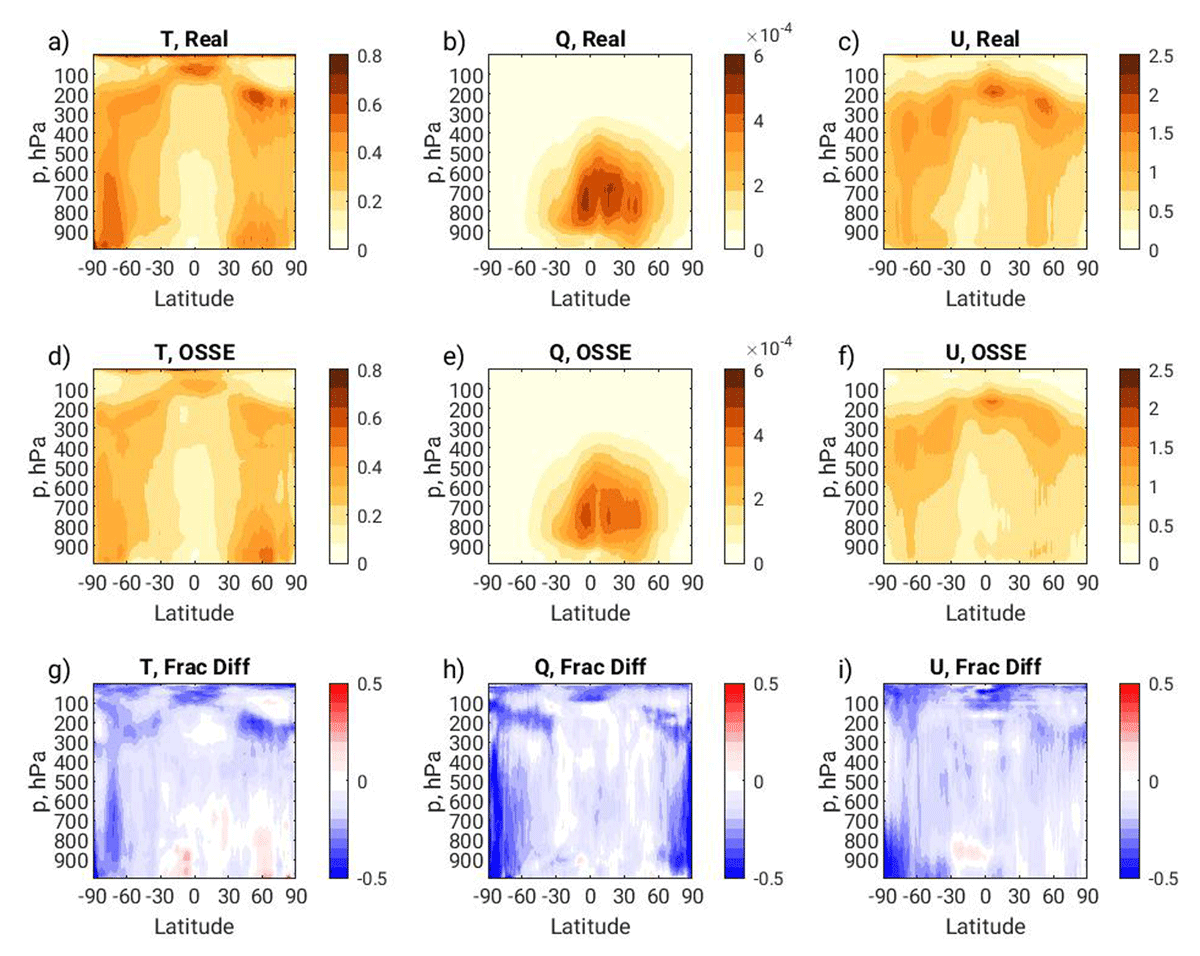
Figure 6
Standard deviation of analysis increment (A-B) for the month of July, four times daily data, for the Updated OSSE framework. a,b,c) Real; d,e,f) OSSE; g,h,i) Fractional difference of standard deviation of analysis increments, (OSSE-Real)/Real. a,d,g) Temperature, K; b,e,h) specific humidity Q, kg kg–1; c,f,i) zonal wind, m s–1.
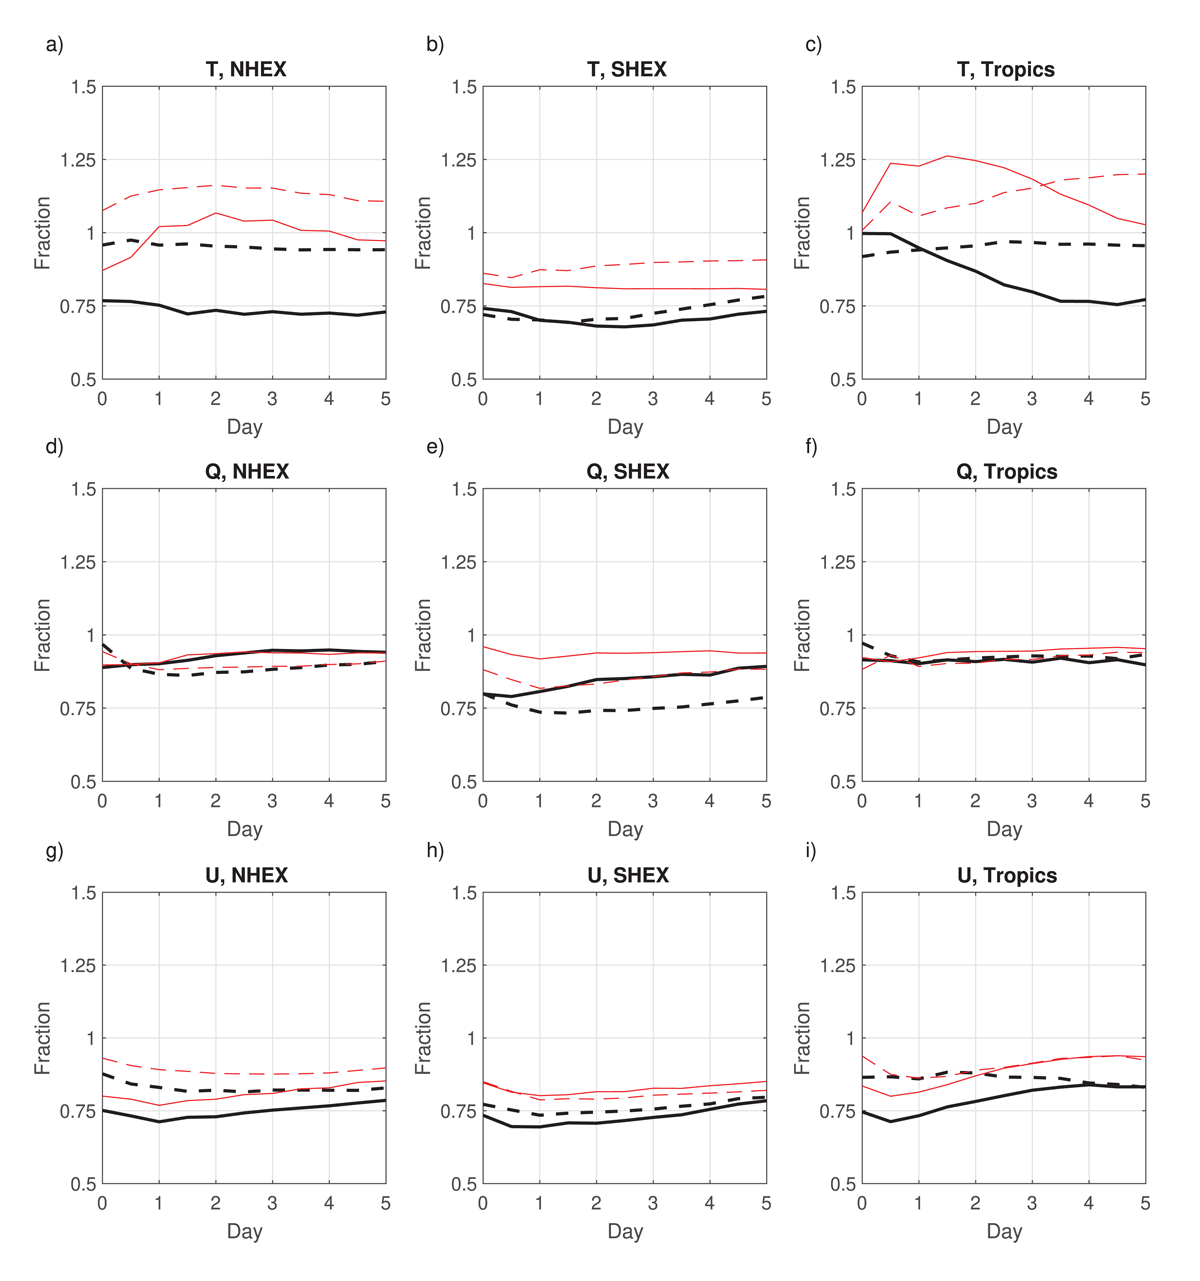
Figure 7
Comparison of root-areal-mean-square forecast errors for the OSSE Control vs Real, using self-analysis verification. Lines indicate the RMS OSSE Control forecast error normalized by the Real forecast error statistics for the month of July. The dashed lines are for 857 hPa, and the solid lines are for 266 hPa. Heavy black lines indicate the Previous OSSE, thin red lines indicate the Updated OSSE. (a)–(c) Temperature, K (d)–(f) specific humidity, kg kg–1, and (g)–(i) zonal wind, m s–1. (a),(d),(g) 20N–90N; (b),(e),(h) 20S–90S; and (c),(f),(i) 20S–20N.
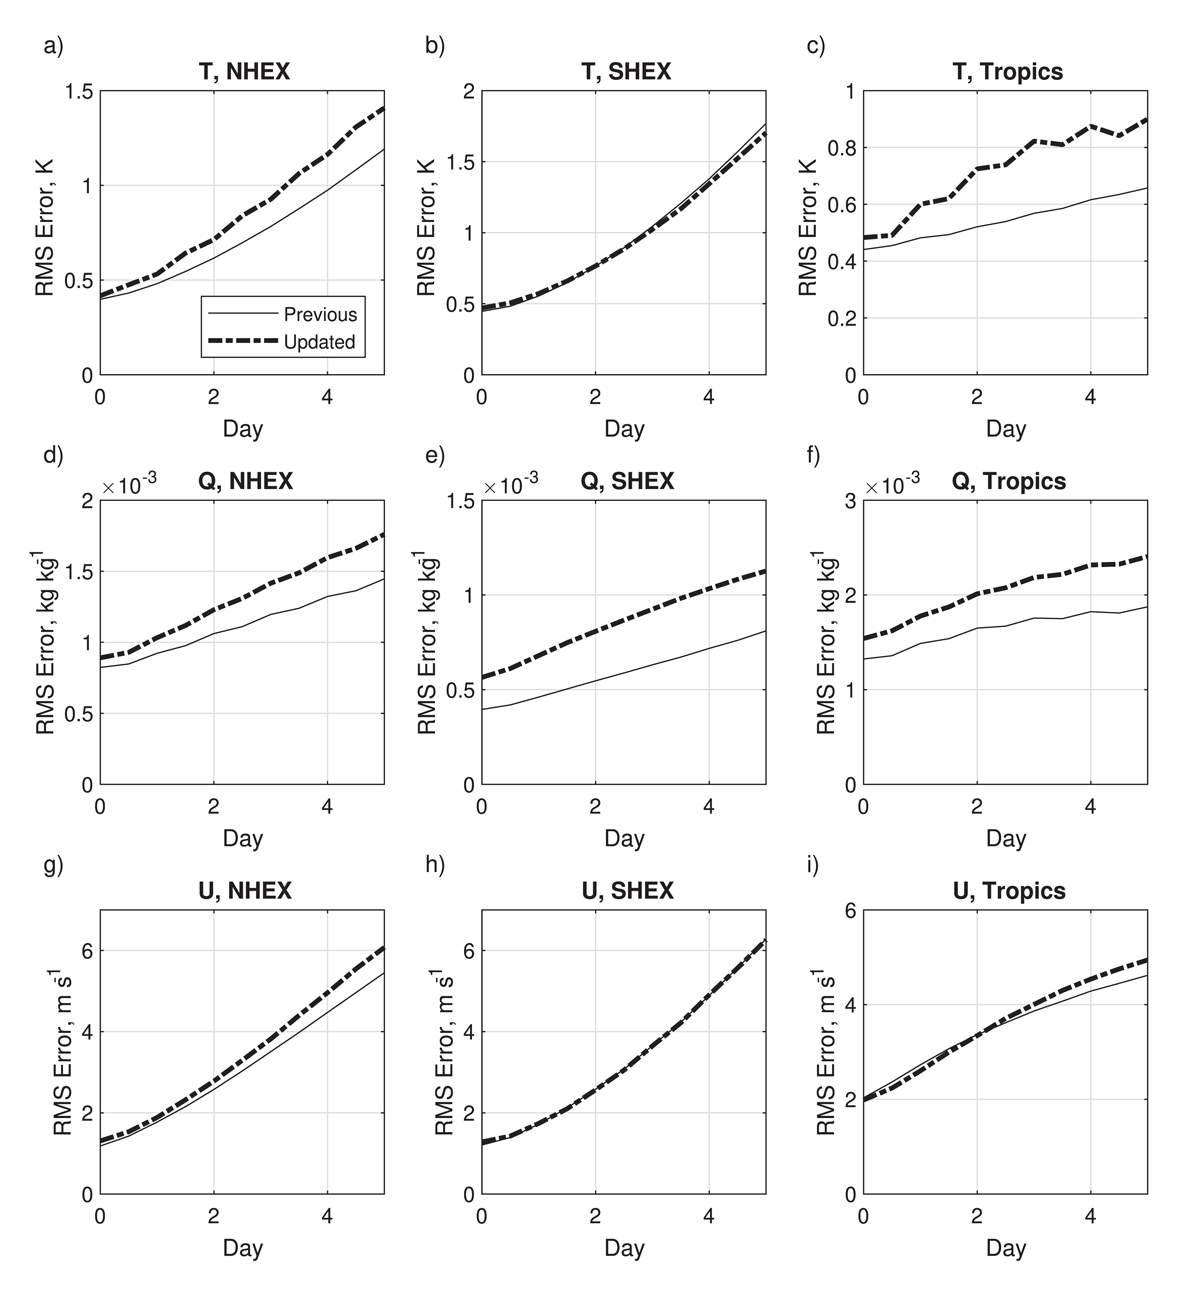
Figure 8
Comparison of root-areal-mean-square forecast errors for the OSSE Control in the Previous and Updated frameworks, using NR verification. The thin solid line is for the Previous OSSE framework Control, heavy dash-dot line is the Updated OSSE Control. (a)–(c) Temperature, K at 500 hPa (d)–(f) specific humidity, kg kg–1, at 850 hPa and (g)–(i) zonal wind, m s–1 at 226 hPa. (a),(d),(g) 20°–90°N; (b),(e),(h) 20°–90°S; and (c),(f),(i) 20°S–20°N.
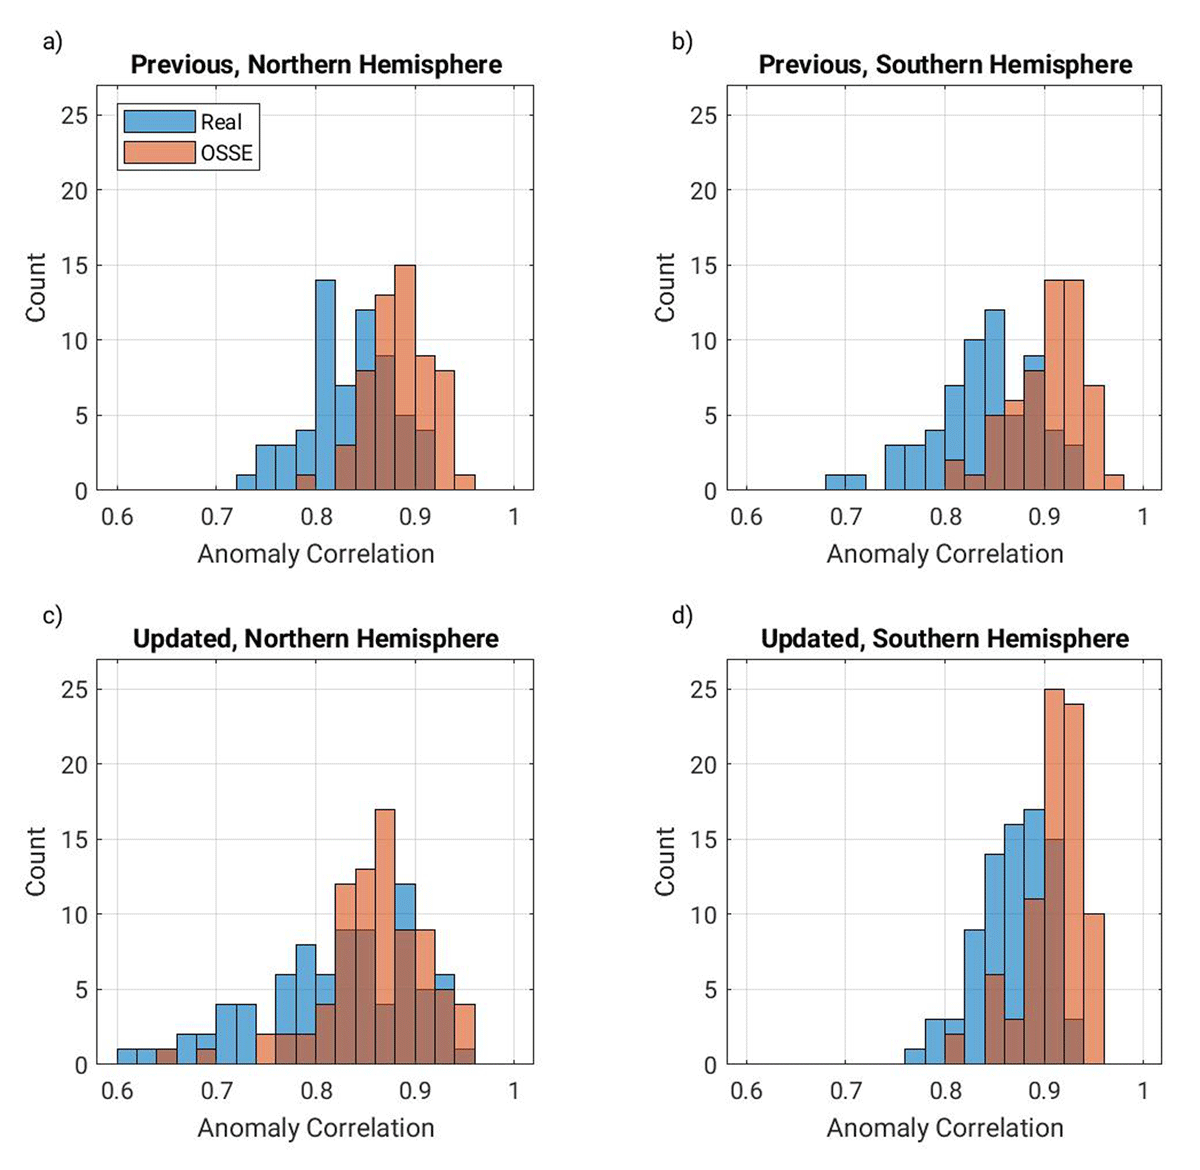
Figure 9
Histogram of 120 hour anomaly correlation of 500 hPa geopotential height for Real (blue) and OSSE (orange). a,b), Previous OSSE, 58 total forecasts July to August; c,d) Updated OSSE, 81 total forecasts July to mid September. a,c) Northern Hemisphere; b,d) Southern Hemisphere.
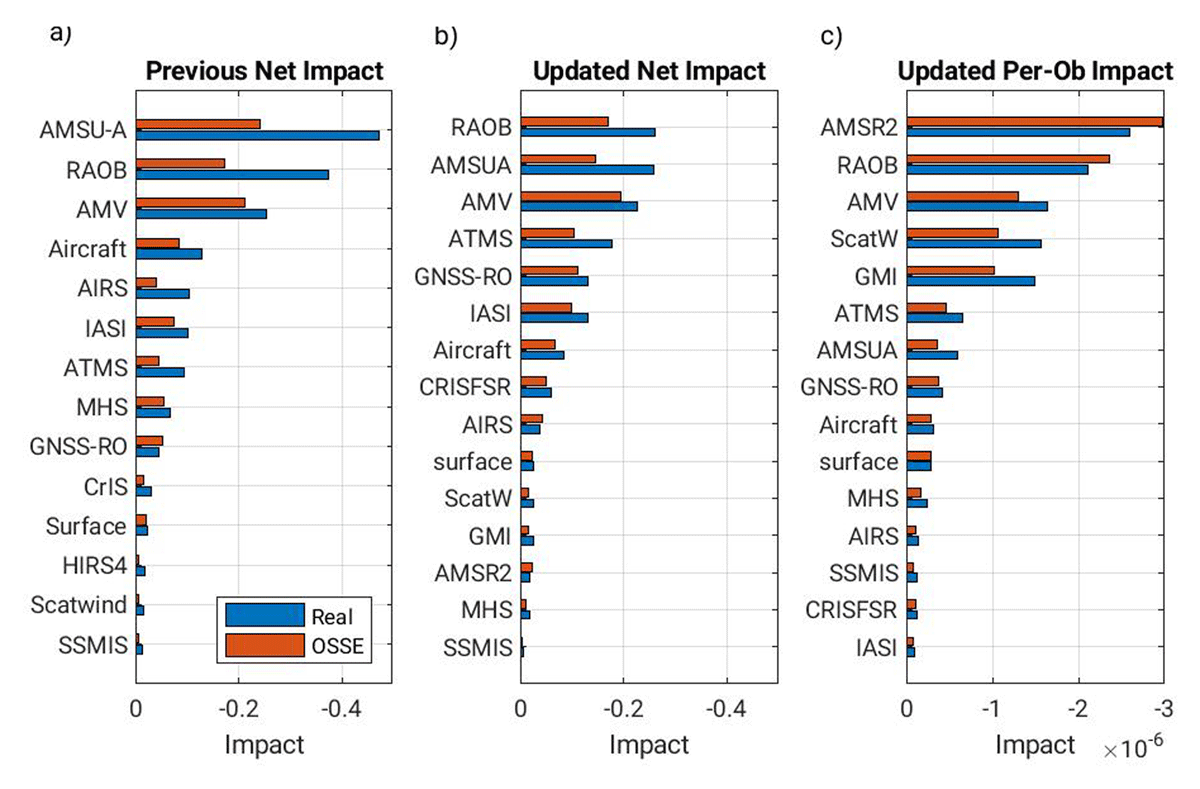
Figure 10
FSOI for global 24 hour total wet energy error norm. 62 total forecasts at 0000 UTC, July–Aug, with numerically unstable solutions omitted. Blue, real observations; red, simulated observations in OSSE framework. a,b) net forecast impact (units) for Previous (a) and Updated (b) frameworks. c) per-observation impacts for Updated framework.
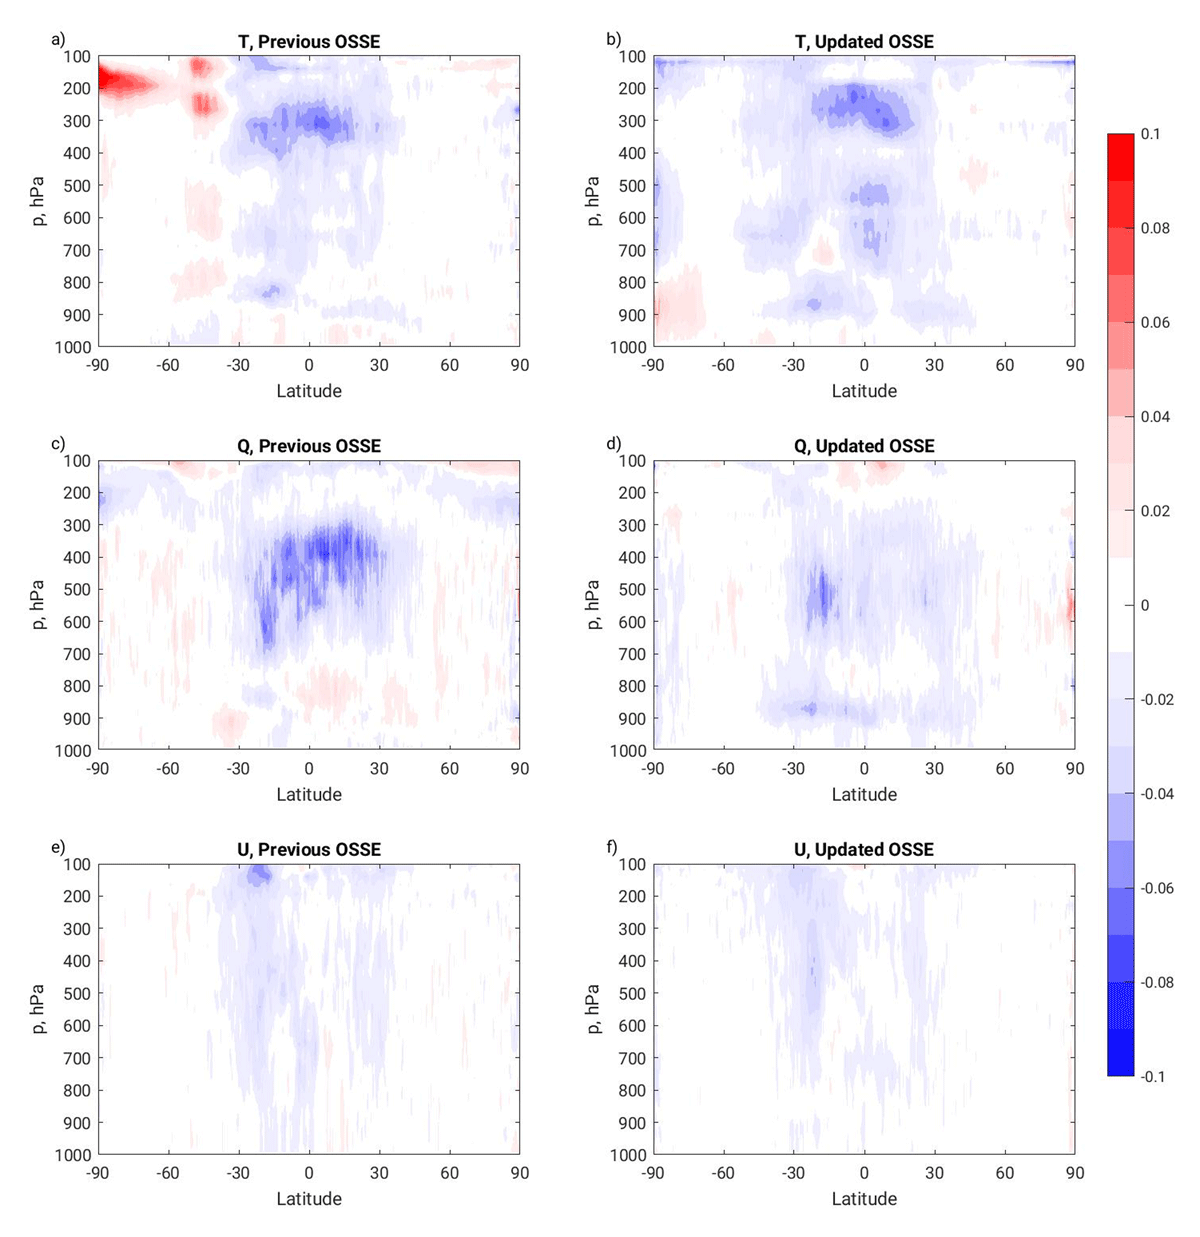
Figure 11
Global fractional difference in RTMS analysis error for the GEO IR experiment vs Control, normalized by the Control analysis error as a function of pressure and latitude for the (left) Previous and (right) Updated OSSE. Shown are the impacts on (top) temperature, (middle) specific humidity, and (bottom) zonal wind. Errors are computed for the months of July and August. Blue and red indicates an improvement and degradation, respectively by the addition of geostationary infrared radiances.
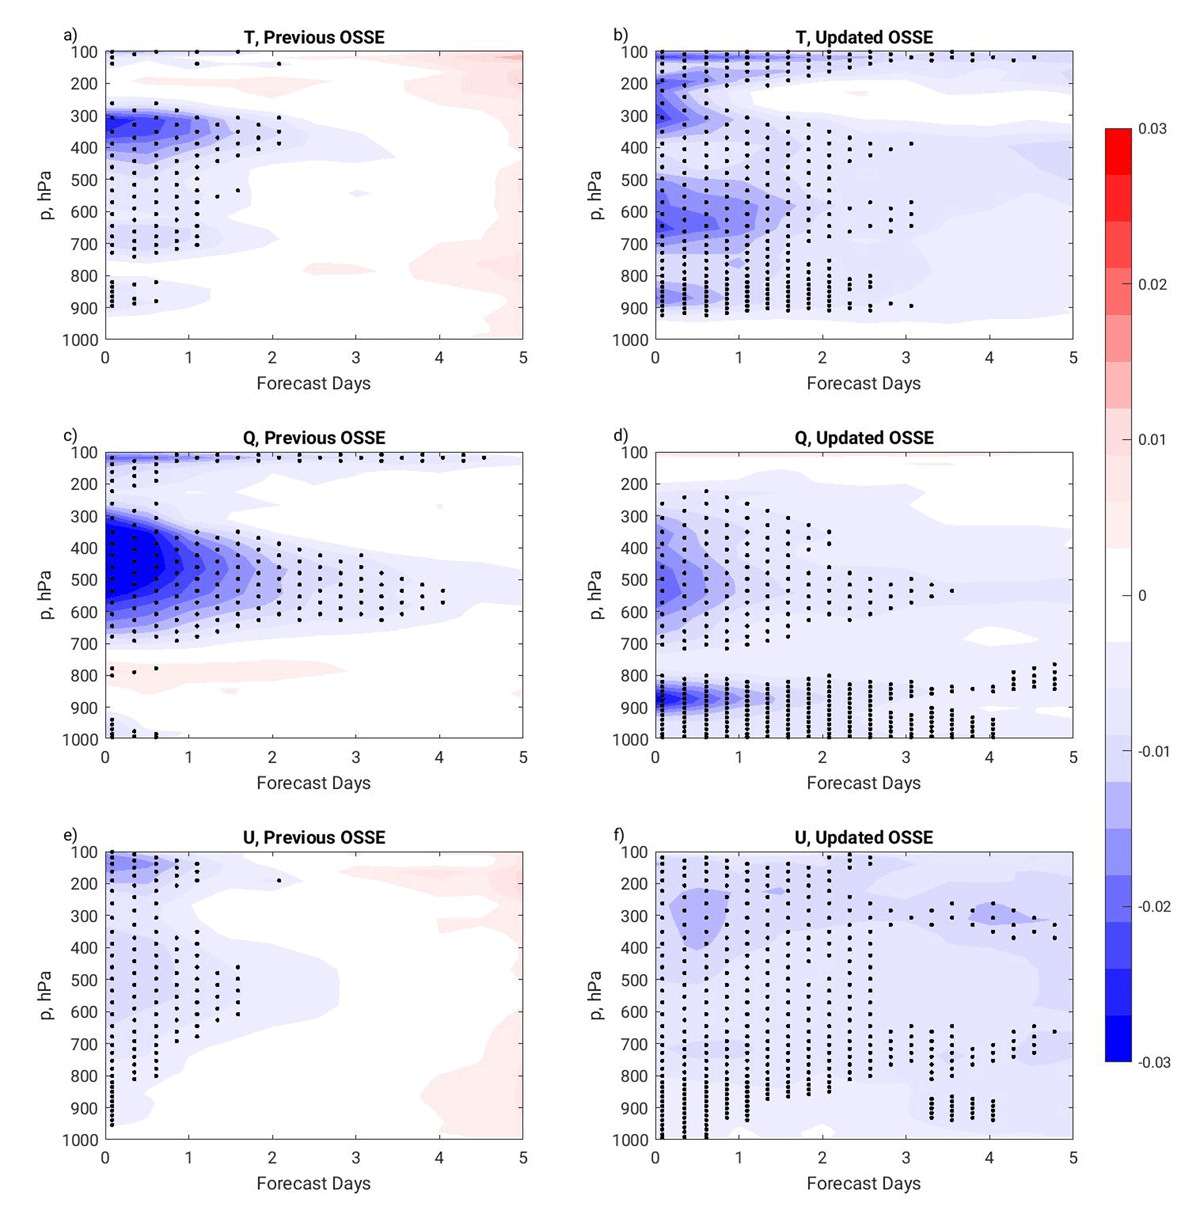
Figure 12
Global fractional difference in RAMS forecast error for the GEO IR experiment vs Control, normalized by the Control forecast error as a function of pressure and forecast time for the (left) Previous and (right) Updated OSSE. Shown are the impacts on (top) temperature, (middle) specific humidity, and (bottom) zonal wind. Errors are computed for the months of July and August. Blue and red indicates an improvement and degradation, respectively, by the addition of geostationary infrared radiances. Stippling indicates significance at the 90% level.
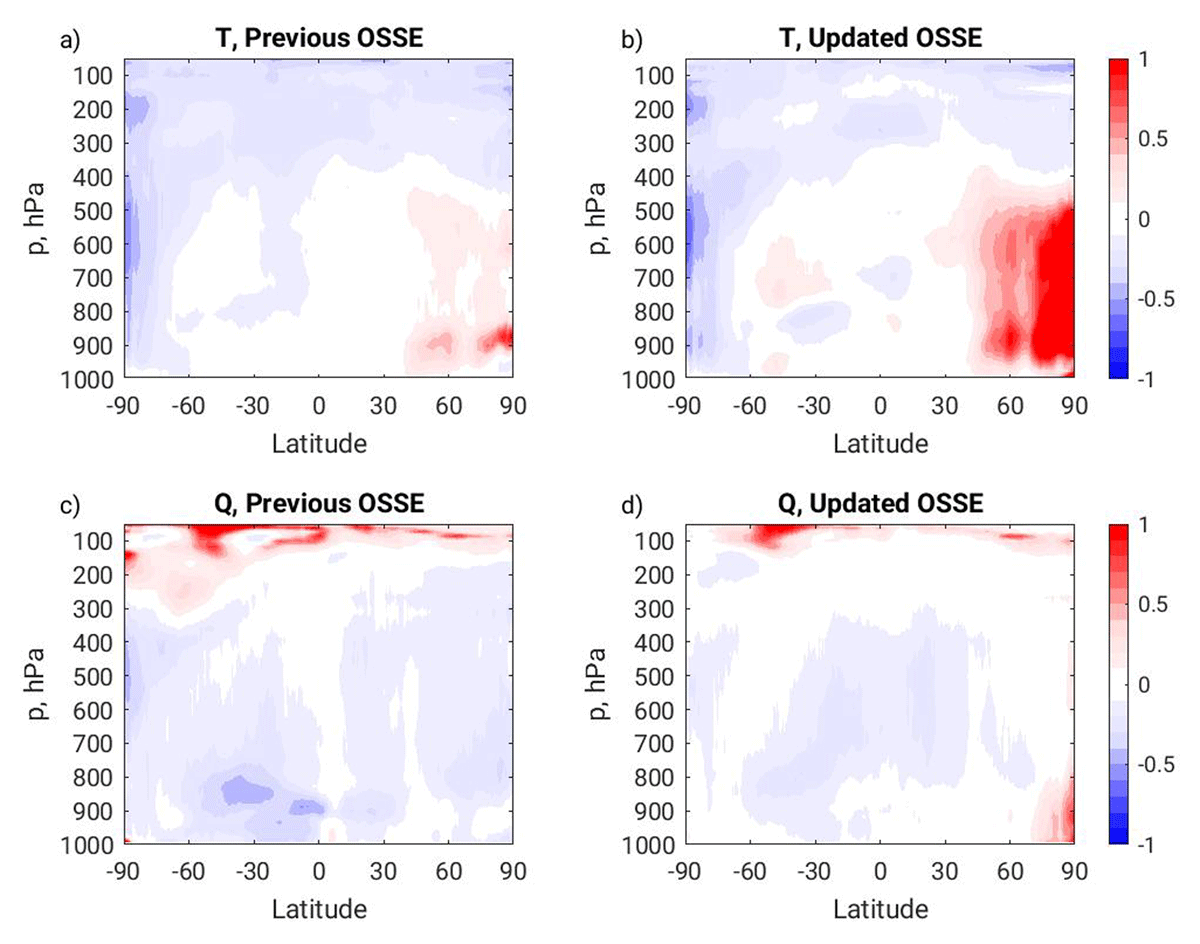
Figure 13
Zonal mean fractional RMS temperature analysis error difference for 100k additional GNSS-RO profile case vs Control, normalized by Control analysis error. Negative values indicate a reduction in analysis error when additional GNSS RO profiles are included. a,b) Temperature; c,d) specific humidity. a,c) Previous OSSE framework. b,d) Updated OSSE framework.
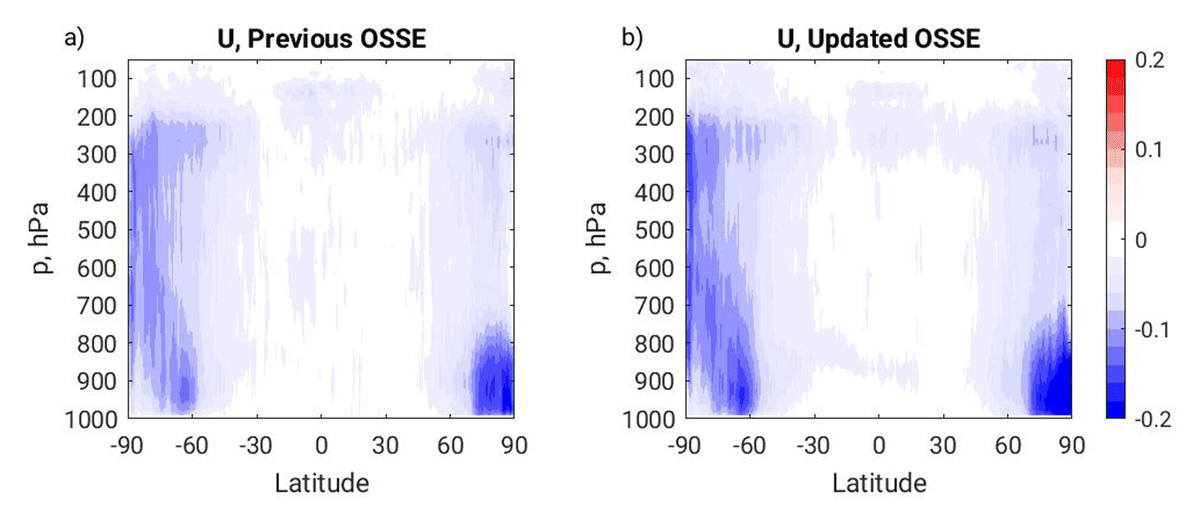
Figure 14
Zonal mean fractional RMS zonal wind analysis error difference for the MiSTIC Wind case vs Control, normalized by Control analysis error, July–Aug. Negative values indicate a reduction in analysis error when MiSTIC winds are included. a) Previous OSSE framework. b) Updated OSSE framework.
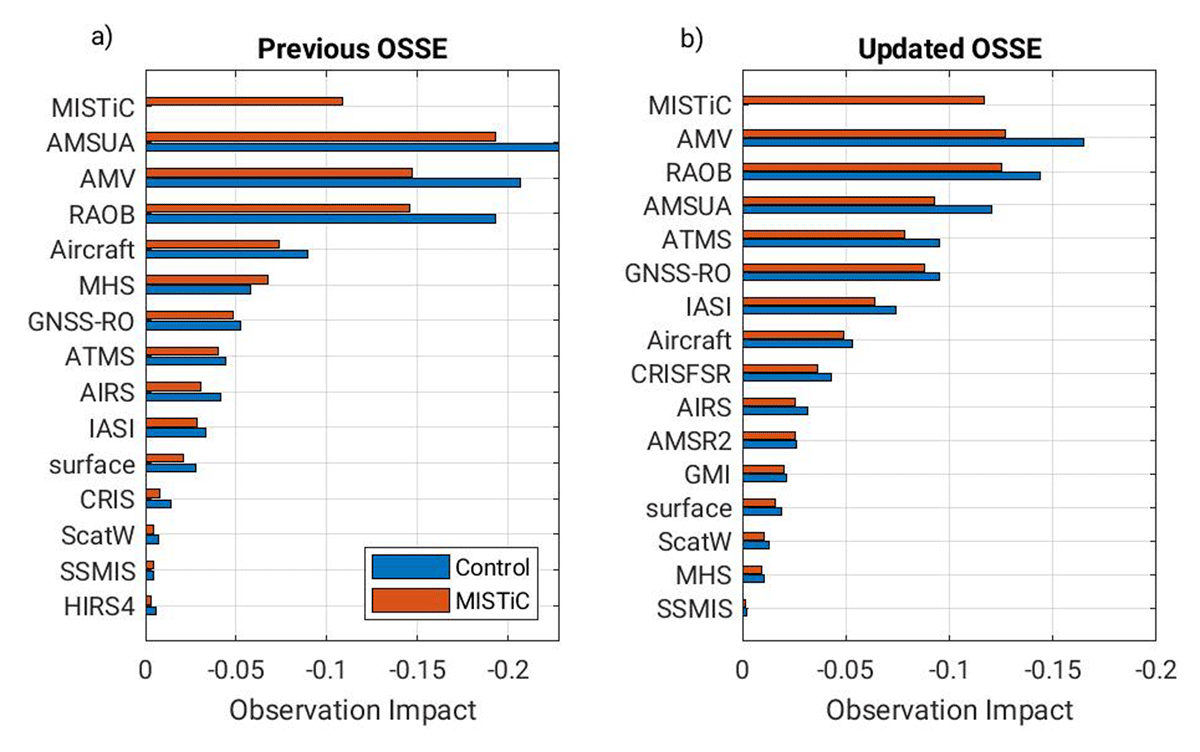
Figure 15
FSOI estimates of observation impact on the 24 hr forecast total wet energy norm. Blue bars, Control; red bars Control + MISTiC winds. a) Previous OSSE framework. b) Updated OSSE framework.