
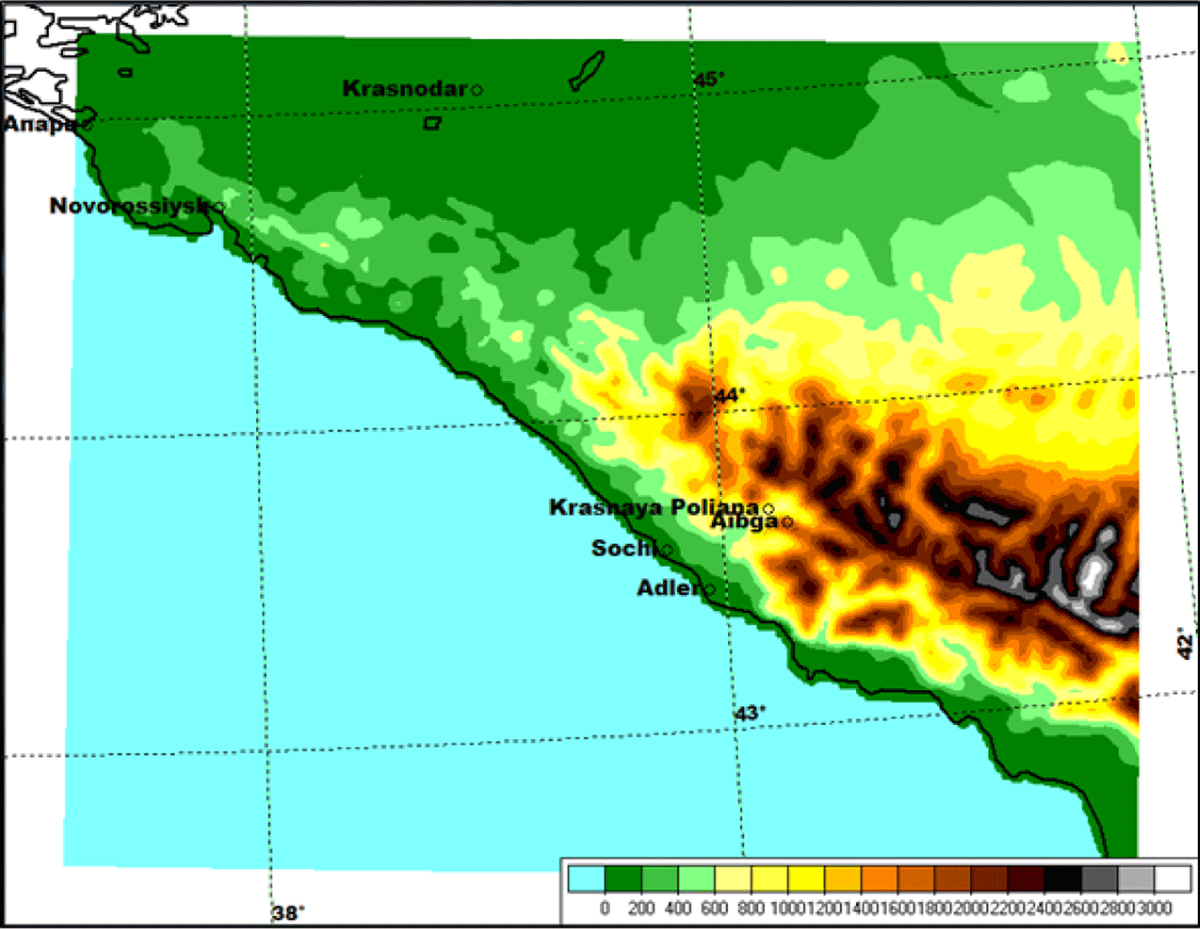
Figure 1
Model domain and orography.
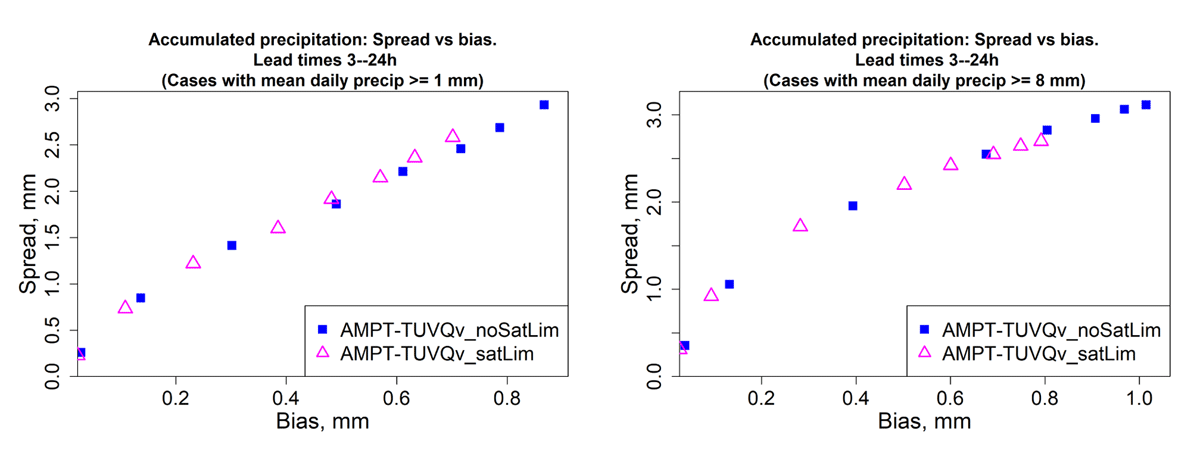
Figure 2
Impact of the supersaturation limiter on spread and bias of accumulated precipitation forecasts for lead times from 3 to 24 h. Averaging over cases with the mean (over the model domain) daily accumulated precipitation ⩾ 1 mm (left) and ⩾ 8 mm (right).
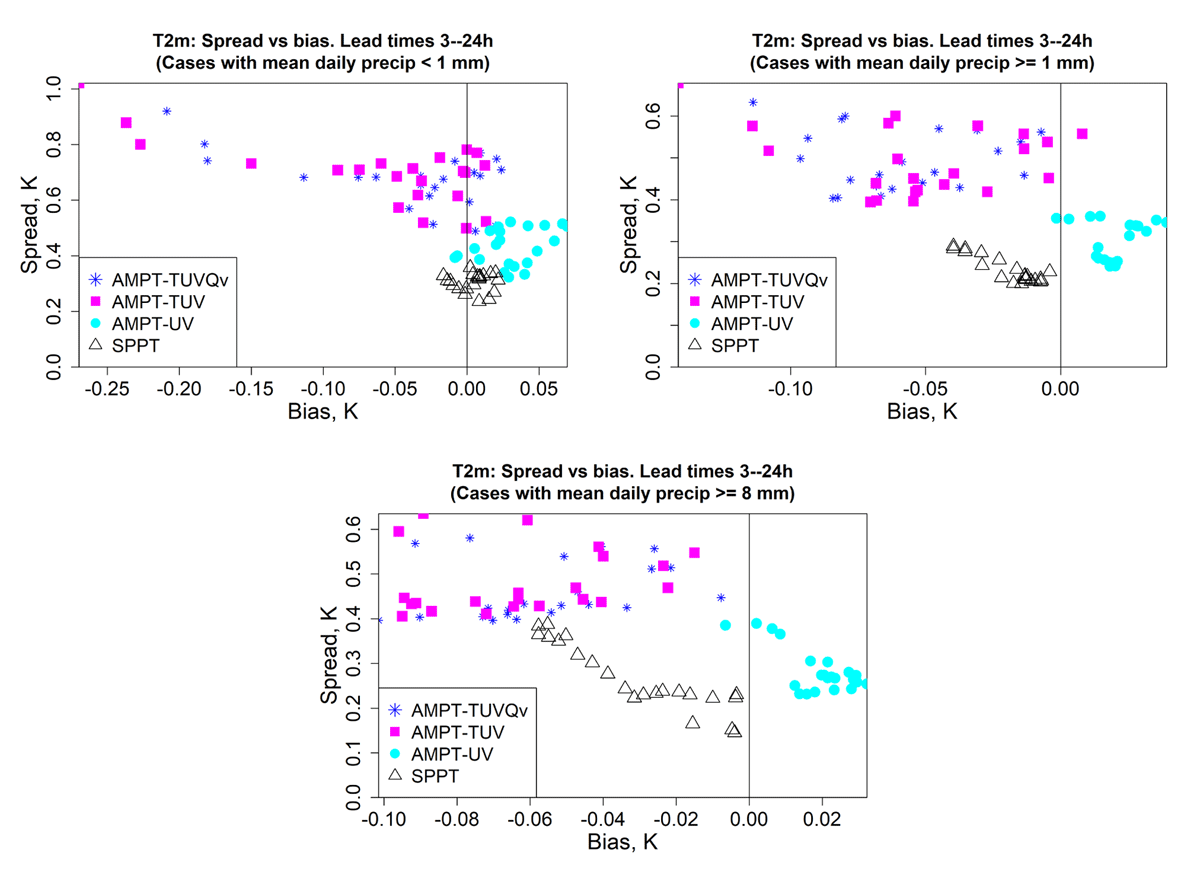
Figure 3
Spread vs bias of T2m forecasts for lead times from 3 to 24 h. Averaging over cases with the mean (over the model domain) daily accumulated precipitation <1 mm (top, left), ⩾ 1 mm (top, right), and ⩾ 8 mm (bottom).
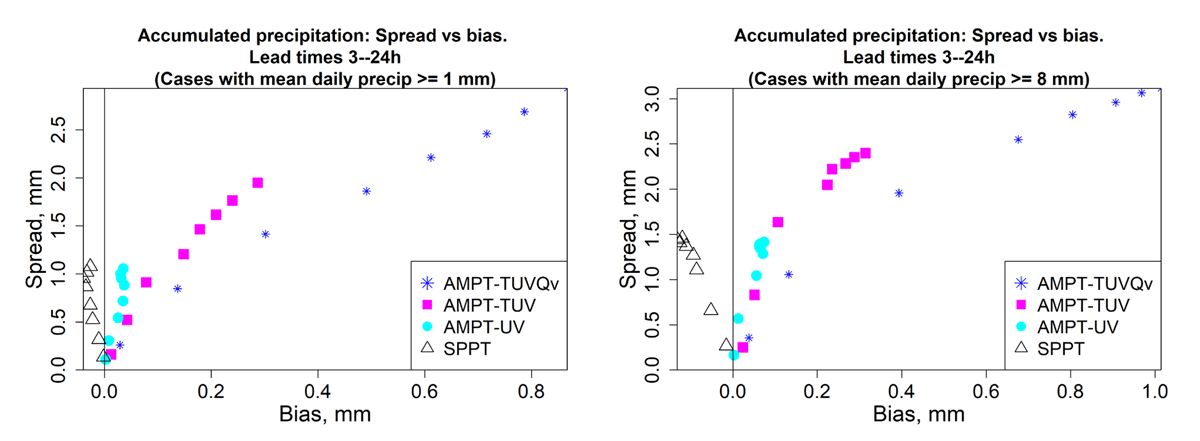
Figure 4
Spread vs bias of accumulated precipitation forecasts for lead times from 3 to 24 h. Averaging over cases with the mean (over the model domain) daily accumulated precipitation ⩾ 1 mm (left) and ⩾ 8 mm (right).
Table 1
List of ensemble prediction experiments.
| EXPERIMENT | MODEL PERTURBATIONS |
|---|---|
| NOPERT | None |
| SPPT | Atmospheric SPPT perturbations |
| AMPT-NOSOIL | Atmospheric AMPT perturbations |
| AMPT-SOIL | Atmospheric and soil AMPT perturbations |
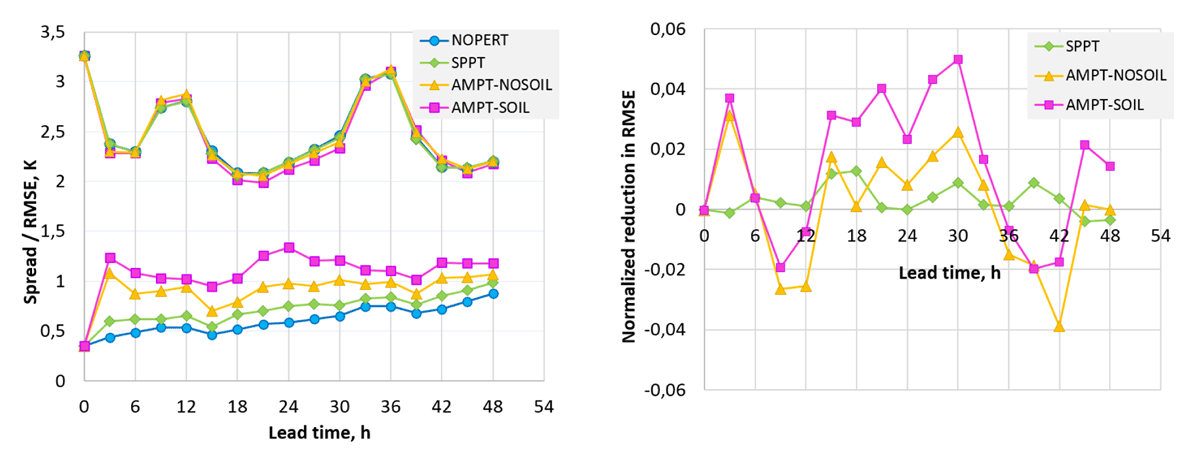
Figure 5
T2m. Left: RMSE of ensemble mean (the upper bunch of curves) and ensemble spread (the lower bunch of curves). Right: The normalized reduction in ensemble-mean RMSE, that is, (RMSENOPERT – RMSE)/RMSENOPERT, the higher the better.
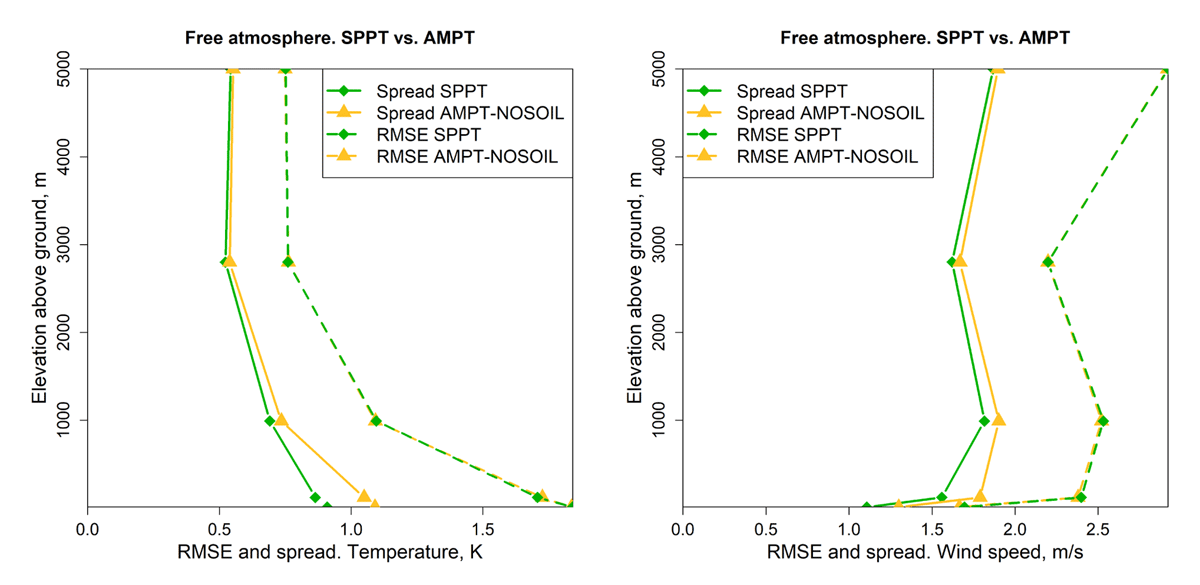
Figure 6
RMSE and spread for AMPT-NOSOIL vs. SPPT in free atmosphere.
Left: Temperature. Right: Wind speed.
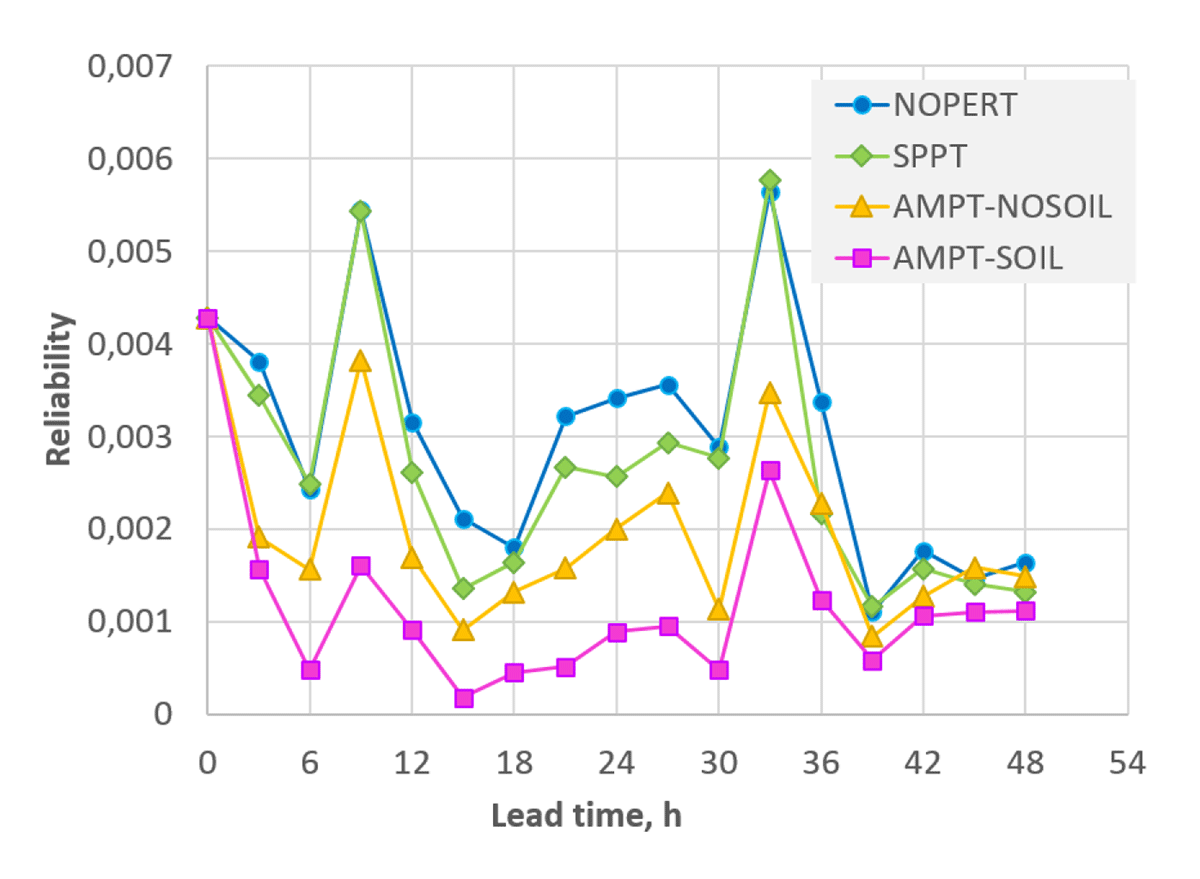
Figure 7
The reliability component of the Brier score for the event T2m > 0°C. The lower the better.
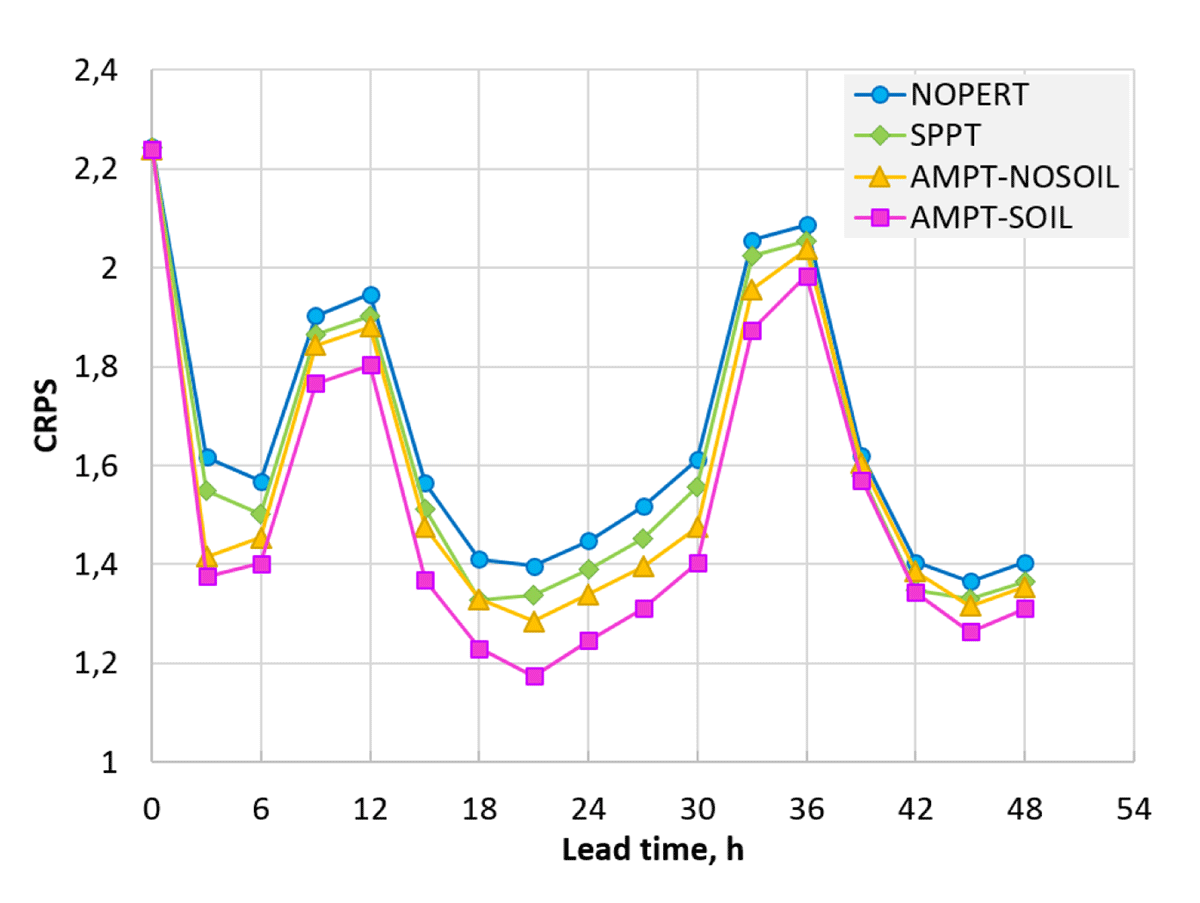
Figure 8
CRPS for T2m. The lower the better. Note that the y-axis does not start at 0.
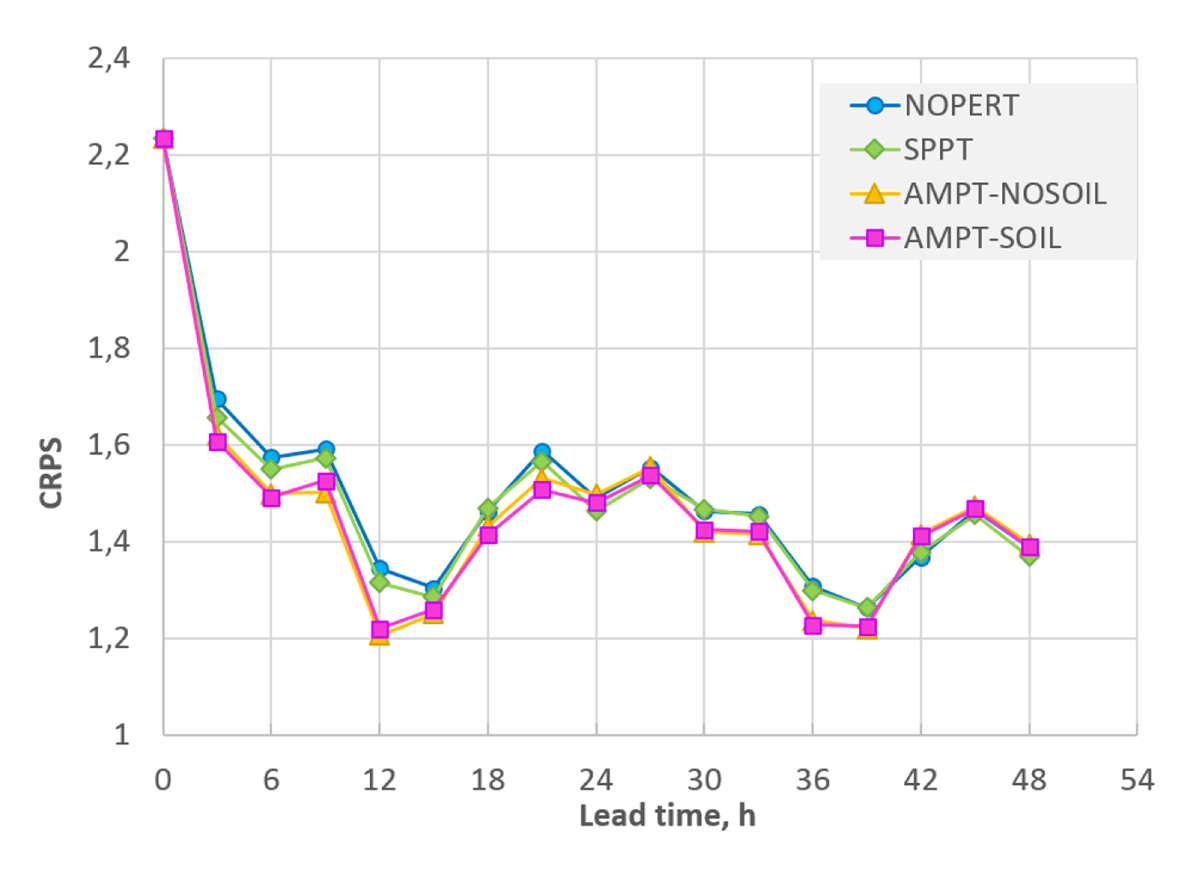
Figure 9
CRPS for V10m. The lower the better. Note that the y-axis does not start at 0.
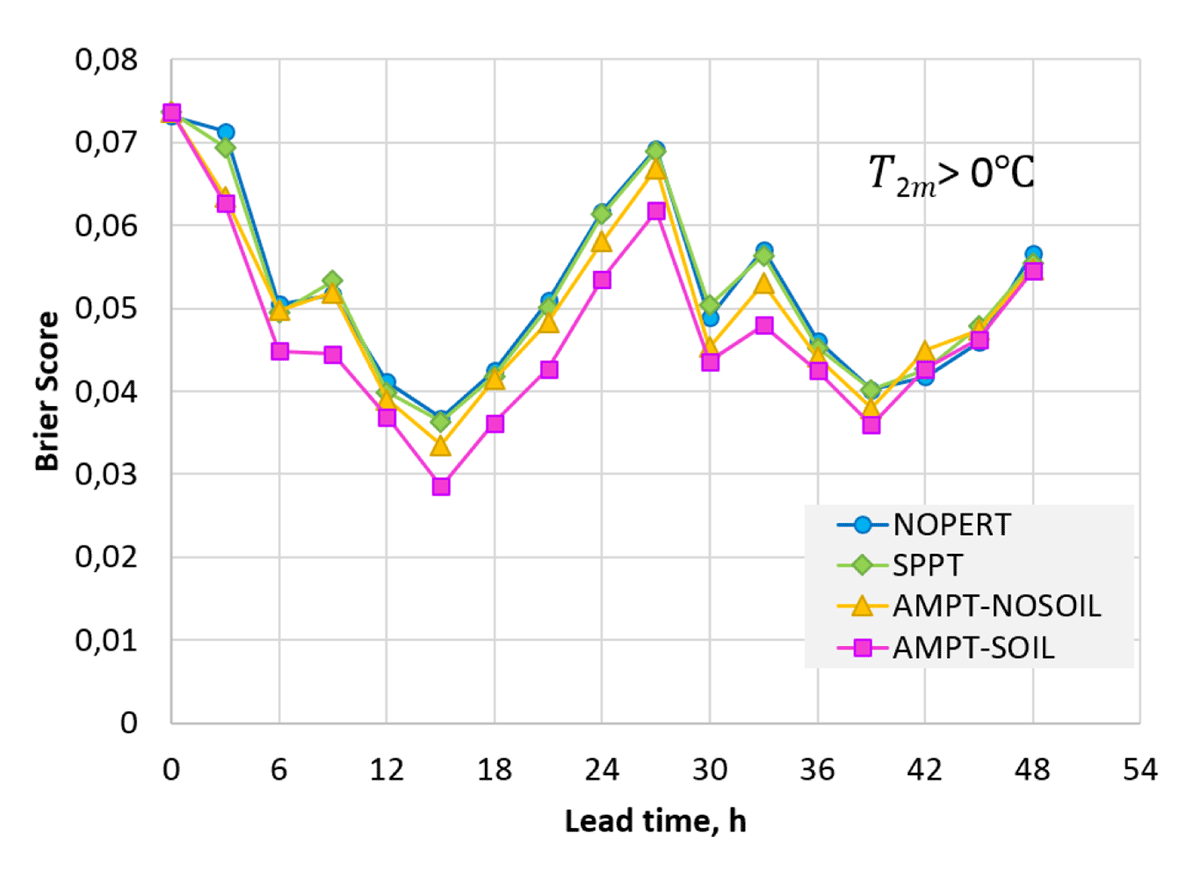
Figure 10
Brier score for the event T2m > 0°C. The lower the better.
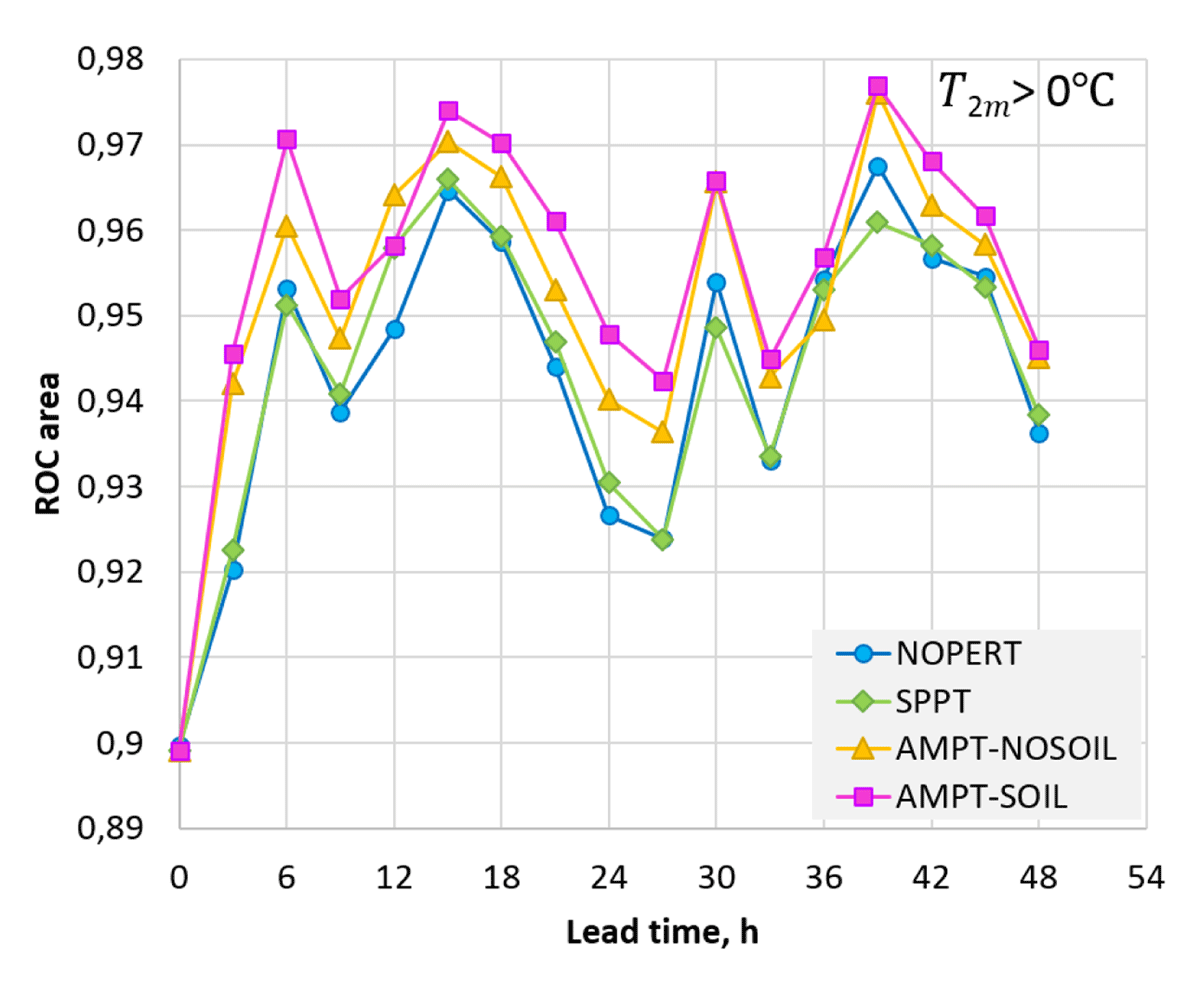
Figure 11
ROC area for the event T2m > 0°C. The higher the better. Note that the y-axis does not start at 0.