
Introduction
Engaging leadership (EL), introduced by Schaufeli (2015), is a relatively new way of looking at leadership style grounded in self-determination theory (Deci & Ryan, 2012). Taking the satisfaction of followers’ basic needs as the focal point, EL motivates followers which improves their well-being. With this theoretical foundation Schaufeli (2015) sought to offer an alternative to the meager theoretically constructed (van Knippenberg & Sitkin, 2013) transformational leadership (TL) that was often used to understand employee engagement. TL has been shown to have many positive outcomes on a plethora of organizational variables (Arnold, 2017; Judge & Piccolo, 2004; Li et al., 2013; Yammarino et al., 1993). Transformational leadership refers to a pattern of leader behaviors aimed at inspiring followers to transcend self-interest and achieve higher-order goals (Bass & Riggio, 2006). It is traditionally conceptualized as comprising four dimensions: idealized influence, inspirational motivation, intellectual stimulation, and individualized consideration. Through these behaviors, transformational leaders articulate a compelling vision, stimulate new ways of thinking, and attend to individual followers’ development.
Recent research shed light on possible negative sides of TL (Chen et al., 2018; Kark et al., 2003; Lin et al., 2019; Nielsen & Daniels, 2012; Tafvelin et al., 2019; Tourish, 2013). Particularly interesting is the focus on curvilinear relationship between TL and outcomes like employee creativity and innovative behavior (Chung et al., 2021; Eisenbeiß & Boerner, 2010; Ma et al., 2020), between Leadership Member exchange and employee promotive voice and job performance (Carnevale et al., 2020; Wu et al., 2024) and between authoritarian leadership and organizational citizenship behavior (Bodla et al., 2019). Especially relevant for occupational stress researchers is the focus on the curvilinear relationship between TL and stress. Harris and Kacmar’s (2006) study found that both low- and extremely high-quality LMX relationships are stressful. In another study both high- and low-levels of ethical leadership were related to stress (Stouten et al., 2013), a finding that was corroborated 12 years later (van Gils & Seljeseth, 2025). These studies suggest, rather, that after a certain level, positive leadership and its effect are no longer positive, it casts a shadow over employees because it is associated with higher levels of stress. ‘Leadership can act as either a major source of stress for followers or as a buffer against work stressors’ (2022, p. 81). When organizations aim to create effective changes, and adopt approaches such as transformational leadership, it is essential to consider how these practices influence employees (Li et al., 2019). This would mean that leaders must learn to maintain a balance, making sure to not ‘overdo’ it, because it may wear out their followers. Examining curvilinear associations between leadership and employee stress outcomes moves leadership research beyond implicit ‘more-is-better’ assumptions. Curvilinear relationships imply the presence of optimal levels of leadership behavior. Beyond such a level these otherwise beneficial leadership practices diminish or even become negative.
The aim of the present study is first to replicate the research done by Molines and colleagues (2022) by studying whether TL is curvilinearly related to stress. Drawing on data from the French police, Molines and colleagues (2022) found that TL does not simply reduce emotional exhaustion in a straightforward way. Instead, the relationship is curvilinear, i.e., moderate levels of transformational leadership is associated with lower emotional exhaustion, but very high levels may increase strain. Overall, the authors argued that while transformational leadership can be beneficial, it has a ‘tipping point.’ Beyond a certain level, it may place unrealistic expectations on employees, contributing to fatigue rather than preventing it. Their study highlighted the importance of balanced leadership practices and cautions against assuming that ‘more TL is always better.’
Because this important finding was based on a sample exclusively comprised of employees in the French police, we argue that it is necessary to see whether these findings can be replicated in a more heterogeneous sample. Moreover, since the study only measured emotional exhaustion as an indicator of stress, we argue that it is also appropriate to replicate that study using other stress indicators, like lack of sleep (quality), as both are closely linked to burnout. Emotional exhaustion is often conceived as the energy dimension in the burnout concept in several recognized measurement units for burnout (Cole et al., 2012; Söderström et al., 2012), and lack of sleep is referred to as the main factor for the development of burnout among employees (Söderström et al., 2012). Research has shown that emotional exhaustion and sleep deprivation are associated with several negative consequences in the workplace. Emotional exhaustion and sleep deprivation represent core energy-related strain outcomes that are especially sensitive to sustained activation and insufficient recovery. Both outcomes are central to the development of burnout and are theoretically consistent with resource depletion mechanisms proposed in the conservation of resources (COR) theory. Examples of such consequences are impaired physical and mental health, reduced well-being (Litwiller et al., 2017), poorer job performance, increased incidence of accidents (Han et al., 2017), and large economic losses in production (62.3 billion dollars in USA in 2011; Weber, 2013).
In addition to replication of Molines and colleagues (2022) study, our second aim is to expand this study by investigating the relationship between engaging leadership (EL; Schaufeli, 2015) and stress. Like TL style, EL is a leadership style with a core that is based on a strong interest in employees (Schaufeli, 2015), but unlike TL, EL emphasizes the needs satisfaction of the employee which should be protected against stress. Hence, a curvilinear relationship would be rather surprising. Exploring this relationship is also vital because it opens discussions on taking a more critical look at the application leadership styles like TL and EL. If found significant, it will create awareness into when, and to what extent, leadership styles like TL and EL should be practiced to get the most of them. If not, embracing EL on top of, or instead of, TL may show leaders a path forward to increase motivation and productivity without increasing stress too much.
Transformational leadership’s curvilinear relationship with emotional exhaustion and lack of sleep
The theoretical framework for TL facilitates a lower degree of stress outcomes for employees in the workplace (Harms et al., 2017). In a more recent study, Molines and colleagues (2022) challenge the assumption of TL’s abundance of positive outcomes. The intention of this study was, among other things, to investigate whether there was a curvilinear relationship between TL and burnout among 140,000 French police constables. A U-shaped curvilinear relationship was found where a negative relationship between TL and exhaustion reached a turning point (called the inflection point), and became positive (Pierce & Aguinis, 2013). Based on this, argument could be raised that TL does not have an exclusively beneficial effect on stress among employees. This can be substantiated with Hobfoll’s (1989) stress theory of conservation of resources.
Hobfoll’s (1989) theory of conservation of resources (COR) is a stress theory that can explain curvilinear relationships with stress outcomes among employees (Molines et al., 2022). The theory centers on the notion that humans strive to obtain, protect, and promote their resources (Hobfoll, 1989). Resources in this context can be understood as all the things that a given individual perceive as a catalyst towards the achievement of their goals (Olaniyan, 2022). The COR theory distinguishes between different types of resources, contextual and personal resources. Contextual resources are parts of the individual’s social context, for example the work environment for an employee, while personal resources deal with the self (Hildenbrand et al., 2018). Contextual resources can, through a positive influence on personal resources, lead to different outcomes (Ten Brummelhuis & Bakker, 2012). TL can be seen as a contextual resource, as it expands and increases available resources for employees, which further enables the development and safeguarding of personal resources (Halbesleben, 2006). TL directly supply psychosocial resources through individualized consideration, mentorship, and inspirational motivation. By cultivating high-quality, supportive exchanges, they facilitate the positive ‘crossover’ of vital internal resources, such as transferring job-related self-efficacy, optimism, and self-esteem to their followers. (Hobfoll et al., 2018) Because of this, transformational leadership is associated with lower stress, and increased overall well-being (Salem, 2015).
Yet, it is also argued that TL could act as a demand (Erskine & Georgiou, 2023) because it may threaten employees’ personal resource reservoir through constant demands for development and change (Hildenbrand et al., 2018; Lin et al., 2019). For example, the leader’s idealized influence, which encourages employees to perform more than expected, can result in longer working hours and greater energy invested in the job, leading to stress among employees (Arnold & Connelly, 2013; Seltzer et al., 1989). Given that COR’s basic premise is that humans generally strive to conserve resources and to limit any state that may jeopardize these, one can argue that external influence from a leader, however positive it began, might start to fall if pushed to a certain limit. The second core principle of COR theory—the ‘Resource Investment Principle’—states that individuals must invest their own resources (such as time, cognitive capacity, and physical energy) to cope with challenges and gain new resources (Hobfoll, 2002). Transformational leaders inherently require employees to expend these finite resources (Erskine & Georgiou, 2023). For instance, Intellectual stimulation can lead to an experience of uncertainty and risk linked to changes in thought patterns and critical reflection in employees (Seltzer et al., 1989). Both inspirational motivation and intellectual stimulation may motivate employees to transcend their personal goals and invest heavily in broader organizational aspirations which may lead to stress (Erskine & Georgiou, 2023). Stress in COR emerges amongst others when the individual’s resources are threatened by potential, or actual losses, or when the investment will not deliver the anticipated gains (Hobfoll, 1989). High intellectual stimulation, that could backfire and may lead to more worries in place of more relaxation about work, may also relate to sleep deprivation. Past research has found links between highly demanding roles and negative workplace outcomes like burnout, exhaustion, sleep deprivation, and ‘rumination’—a condition where an individual finds it difficult to switch off their thoughts after working hours (Hülsheger et al., 2015; Molines et al., 2022). While supportive and inspiring behaviors can replenish employees’ resources, sustained exposure to high expectations, intellectual stimulation, and continuous change may deplete energetic and cognitive resources, thereby increasing vulnerability to emotional exhaustion and sleep problems.
Besides COR theory, Peter Warr’s (1994) vitamin model may explain the curvilinear relationship found in the study by Molines and colleagues (2022). In this theory, Warr makes an analogy with A and D vitamins, which can be harmful to the body in excessive amounts, in contrast to C and E vitamins which have, after a certain dose, a constant effect. Because of Warr’s classification of opportunity for interpersonal contact (social support, quality and quantity of interaction, instrumental support), as with A and D vitamins, makes it logical to assume that TL, which is characterized by high quality social exchange, may show a curvilinear relationship with stress (Warr, 1994). While social support is generally beneficial, it can become intrusive or insensitive when the ‘exchange’ itself becomes a source of stress (August et al., 2007), because such a high-quality relationship requires high-intensity emotional labor to sustain the exchange. In many cases, the adverse effects of these intense social exchanges can actually outweigh the benefits of the support provided (August et al., 2007). When a leader is excessively ‘transforming’—constantly pushing for vision and change—it can feel like a breach of autonomy or micromanagement (Pierce & Aguinis, 2013). Quan and van Dierendonck (2025) found that even positive leadership behaviors (like servant leadership) are positively associated with role overload. This is because the cognitive resources required to switch between ‘socializing/supporting’ and ‘task performance’ lead to exhaustion (Rick et al., 2024).
Research question 1: Does transformational leadership have a curvilinear (U-shaped) relationship with emotional exhaustion and sleep deprivation in a heterogeneous sample?
Engaging leadership
Engaging leadership (EL) is a newer leadership style that is based on the established motivational theory of Deci and Ryans (2012), the self-determination theory (Nikolova et al., 2019; Schaufeli, 2015). A basic assumption in the self-determination theory is that humans are born with three inherent psychological needs as the basis for people’s motivation, namely, autonomy, competence, and belonging (Deci & Ryan, 2012). Since the three dimensions of EL (empowering, strengthening, and connecting) are designed to cover the three basic psychological needs employees have, Schaufeli (2015) suggests that an engaging manager can help increase and maintain employees’ job engagement (Nikolova et al., 2019).
The first dimension in EL, called empowerment, deals with leadership behavior that facilitates employees’ experience of participation and self-determination in their work. Managers do this by letting employees take part in decision-making and by giving them responsibility (Schaufeli, 2015). This dimension is linked to the satisfaction of the basic need for autonomy in self-determination theory (Nikolova et al., 2019; Schaufeli, 2021). The strength dimension includes leadership behavior, that ensures employees experience opportunities for growth and development (Nikolova et al., 2019) and that employees feel competent in their work by challenging and stimulating their talents (Schaufeli, 2021). This dimension facilitates the satisfaction of the need for competence (Nikolova et al., 2019; Schaufeli, 2021). Through the uniting dimension, the manager must recognize and facilitate employees’ need to be part of a community, by encouraging team cooperation and good team spirit (Schaufeli, 2021). The dimension should contribute to employees feeling safe and cared for by promoting social support and satisfying the need for belonging (Nikolova et al., 2019; Schaufeli, 2021).
Engaging leadership style vs transformational leadership style
The two leadership styles appear to share a lot with regard to their focus on clear vision for the organization and the how this is communicated to the organization (Molines et al., 2022; Schaufeli, 2021). Bass and Riggio (2006) present four dimensions that together make up the TL leadership style: idealized influence, inspirational motivation, intellectual stimulation, and individualized consideration. Additionally, both TL and EL strive to create an environment where employees flourish in their attempt at fulfilling their everyday work goals and tasks (Harms et al., 2017; Nikolova et al., 2019). Despite these reasons, and many more, EL and TL also share some dissimilarities. As opposed to TL that focuses on transformation and effective change, EL, even though could also potentially lead to effective change, focuses on employees’ psychological needs (Schaufeli, 2021). Additionally, unlike TL, that is often viewed as a role model by the employees, EL’s role as a leader could be traced to their supportive and facilitator roles at helping employees reach the fulfilment of their psychological needs (Nikolova et al., 2019; Schaufeli, 2021). Although transformational and engaging leadership shows substantial conceptual and empirical overlap, they differ in their underlying motivational logic. Whereas transformational leadership primarily emphasizes change, performance, and inspiration, engaging leadership explicitly targets the satisfaction of employees’ basic psychological needs for autonomy, competence, and relatedness. Contrasting both styles allows us to examine whether a need-based leadership approach mitigates the risk of ‘too-much-of-a-good-thing’ effects that may arise from TL (Pierce & Aguinis, 2013).
Engaging leadership and stress
Recent findings show that an EL style through facilitating empowerment, strengthening, and uniting employees has positive effects on the individual, team, and organizational level (Schaufeli, 2021). Since engaging leadership builds upon basic need satisfaction, it is reasonable to assume that the leadership style leads to autonomous motivation and thus positive outcomes such as job engagement (Rahmadani et al., 2019; Van den Broeck et al., 2008), through an increase in employees’ job resources, like autonomy and social support (Nikolova et al., 2019). These can function as a buffer for job demands and thus lead to less stress. Van Tuin (2020) recently found a negative correlation between EL and need frustration. The latter emerges when ‘the basic psychological needs are actively suppressed (Niemiec et al., 2022). Need frustration has a positive relationship with several stress outcomes, such as exhaustion (Olafsen et al., 2017), sleep disturbances, anxiety, and depression (Niemiec et al., 2022). Although an engaging leader has been shown to promote employees’ performance, questions could be raised on what happens when there is no alignment in an employee’s psychological needs and that of the organization. Or if an employee or groups of employees are unable to match the level of the engagement that a leader demands? Although engaging leadership is grounded in need satisfaction, and may therefore be less prone to resource depletion, it remains theoretically relevant to examine whether very high levels could nonetheless yield diminishing returns. Based on this connection, it is natural to assume that EL is beneficial in a work context, and therefore interesting to investigate whether EL’s connection with emotional exhaustion and lack of sleep is linear and not curvilinear.
Research question 2: Is engaging leadership’s relationship with emotional exhaustion and sleep deprivation linear instead of curvilinear?
Method
Sample
The samples were collected by Monitoring Statistical Research Comm V, a Belgian consulting firm that specializes in psychosocial risk management for ‘Belgian Health and Safety Executives.’ According to Belgian law, the latter are entitled to assist organizations and employees with preventive guidelines to counter ill-health. Data collection was done during the second trimester of 2018 and beginning of the first of 2020. The collection was done using a standardized questionnaire based on self-reported data, since the purpose of the data collection was to inventory and analyze psychosocial risk factors to improve occupational health and well-being at work. ‘The Short Inventory to Monitor Psychosocial Hazards’ (SIMPH; Notelaers et al., 2007), is often deployed in Belgium to this aim. Apart from SIMPH, other instruments were added when requested. We merged the data from the organizations that chose also to measure TL, EL, and sleep quality. In addition to SIMPH, data were collected through organized group sessions conducted during working hours or via an electronic version of the survey that employees received by email. The respondents’ anonymity was guaranteed.
The final sample consisted of 766 employees working in six different Belgian organizations within the food and textiles sectors (22.7%), industry (12.9%), and services (64.4%), which constitutes a relatively heterogeneous sample compared to Moline’s and colleagues’ (2022) study. In total there were 766 respondents, of whom 382 were women (49.9%) and 339 men (44.3%). Answers from 45 respondents were missing from the survey. On average, the respondents had approximately nine years of work experience. Of the respondents 137 (17.9%) had a managerial position with responsibility for other employees. Over half of the respondents (55.9%) had higher education, and four out of five were permanently employed (79.9%).
Measures
TL was measured based on the Carless Global Transformational Leadership Scale (Carless et al., 2000; Notelaers et al., 2019), where four items in the form of statements were used. Examples of links are: ‘My supervisor treats us as people and encourages us to develop further’ and ‘My supervisor encourages me and gives me recognition.’ The answers were given on a scale from 1 (Strongly disagree) to 7 (Strongly agree). Cronbach’s alpha showed 0.955.
EL was measured using the self-report form The Engaging Leadership Scale (ELS) developed by Schaufeli (2015). The three dimensions, inspire (empower), strengthen, and unite, were measured by four items for each dimension, with a total of 12 items measuring engaging leadership. Examples of these items are: ‘My manager gives employees enough freedom and responsibility’; ‘My manager encourages employees to develop their talents as much as possible’; and ‘My manager encourages cooperation between team members.’ These items were answered on a Likert scale from 1 (completely disagree) to 5 (completely agree). Cronbach’s alpha was 0.975. The CFA in Mplus confirmed that both leadership scales should be regarded as separate factors (cf. Appendix).
Emotional exhaustion was measured with the ‘need for recovery scale’ of the SIMPH (Notelaers et al., 2007). The measure consisted of five items. Examples of items are: ‘I find it difficult to relax at the end of a working day’ and ‘because of my job I feel quite exhausted at the end of the working day.’ The answer options were either ‘Yes’ or ‘No.’ The scale showed a Cronbach’s alpha of 0.78.
Sleep deprivation was measured with three items in the Flemish Work Monitor scale (Bourdeaud’hui et al., 2004). These items are: ‘Do you have difficulty falling asleep?’; ‘Do you experience restlessness and disturbances during sleep?’; and ‘Do you experience persistent fatigue?’ The answer options were either ‘Yes’ or ‘No’ with Cronbach’s alpha of 0.691.
Results
Transformational leadership
The descriptive statistics are portrayed in Table 1. Standardized descriptive statistics are provided to help compare the influence of different predictor variables on the response variable. Because each variable is standardized, it becomes easier to determine which one has the strongest effect on the response. Table 2. summarizes the results from the curve estimation of TL and need for recovery. In linear regression in model 1, TL explained 9.0% (p < .05, t = –8.522) of the variance in emotional exhaustion and thus made a significant contribution to the variation (β = –.311). In model 2 with quadratic curve estimation, TL explained 9.4% (p < .05, t = 2.029) of the variance in emotional exhaustion, making a significant contribution (β = .101). But the contribution in the explained variance was small (ΔR2 = 0.4%).
Table 1
Descriptive statistics and correlations.
| VARIABLES | MEAN | SD | MIN | MAX | 1 | 2 | 3 | 4 |
|---|---|---|---|---|---|---|---|---|
| 1. Transformational leadership | 5.04 | 1.61 | 1 | 7 | (0.96) | |||
| 2. Engaging leadership | 3.64 | 1.02 | 1 | 5 | 0.814* | (0.98) | ||
| 3. Emotional exhaustion | 0.41 | 0.35 | 0 | 1 | –0.303* | –0.315* | (0.78) | |
| 4. Lack of sleep | 0.39 | 0.48 | 0 | 1 | –0.193* | –0.207* | 0.685* | (0.69) |
[i] Legend. Variables are standardized (factor scores), *p < 0.001, (Cronbachs alfa).
Table 2
Transformational leadership’s effect on emotional exhaustion (N = 721).
| MODEL 1 | MODEL 2 | |||
|---|---|---|---|---|
| β | t | β | T | |
| Linear | –0.303** | –8.522 | –0.238** | –4.973 |
| Quadratic | 0.097* | 2.029 | ||
| R2adj | 0.090** | 0.094** | ||
[i] Note. *p < 0.05, **p < 0.001, ns = not statistically significant.
Figure 1 illustrates the statistically significant effects of TL on emotional exhaustion among employees. Both the linear and curvilinear regression lines show a negative effect of transformational leadership on emotional exhaustion. When reporting low TL, the curvilinear effect shows more emotional exhaustion than the linear effect. In addition, the curvilinear effect shows that emotional exhaustion is reduced with increased TL, but the effect flattens out when reports of the most TL.
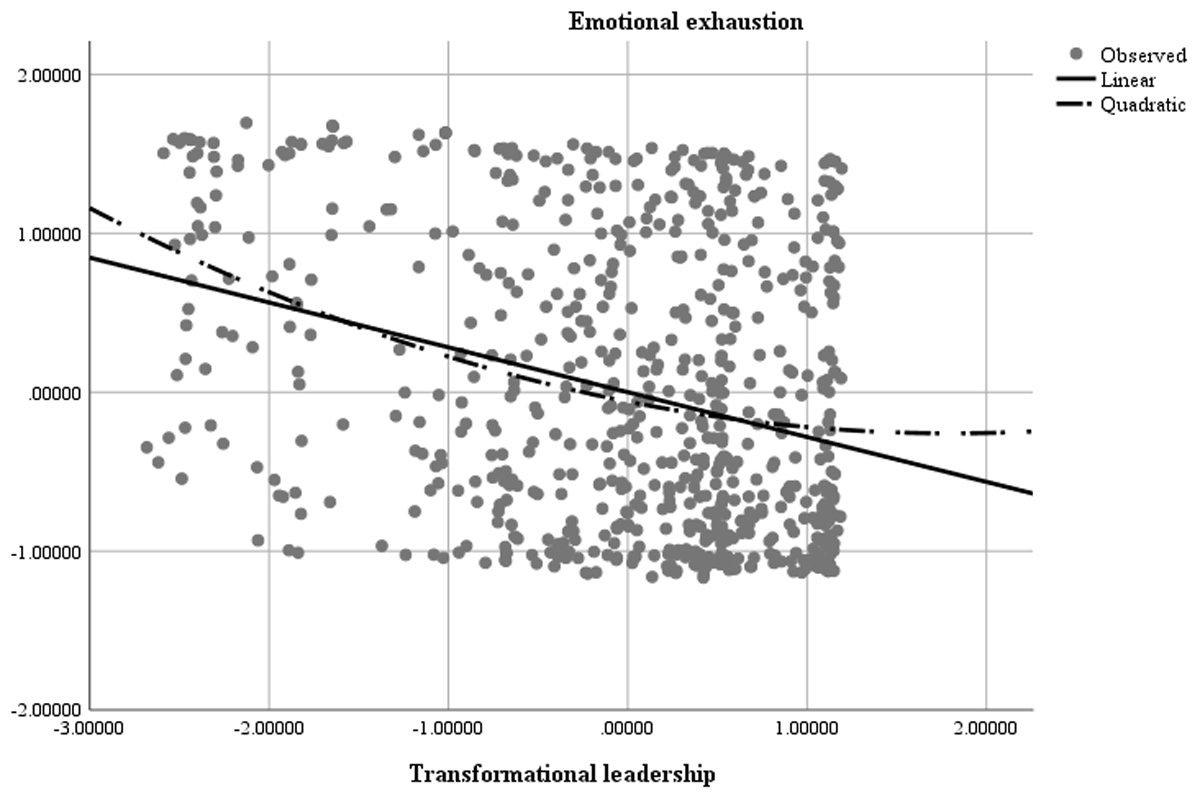
Figure 1
Transformational leadership’s effect on emotional exhaustion.
Table 3 summarizes the results of the curve estimation between TL and sleep deprivation. In model 1 with linear estimation, TL explained 3.8% (p < 0.05, t = –5.285) of the variance in sleep deprivation and made a statistically significant contribution to the variance (β = –0.194). By quadratic estimation in model 2, the explained variance of TL on sleep deprivation was 4.1% (p < 0.05, t = 2.085) and contributed significantly to the variation (β = .102) in sleep deprivation among employees, but the contribution was small (ΔR2 = 0.5%).
Table 3
Transformational leadership effect on sleep deprivation (N = 766).
| MODEL 1 | MODEL 2 | |||
|---|---|---|---|---|
| β | t | β | T | |
| Linear | –0.193** | –5.285 | –0.125* | –2.530 |
| Quadratic | 0.103* | 2.085 | ||
| R2adj | 0.036** | 0.041** | ||
[i] Note. *p < 0.05, **p < 0.001, ns = Not statistically significant.
Figure 2 illustrates the statistically significant effects of TL on sleep deprivation among employees. Both the linear and curvilinear regression lines show a negative effect of TL on sleep deprivation. As with emotional exhaustion, the U-shaped curvilinear effect shows a higher incidence of sleep deprivation with reports of low TL than with the linear effect. In addition, the curvilinear effect of TL on sleep deprivation flattens at the average of the reports (0.00), which shows that the effect is reduced with a high degree of TL.
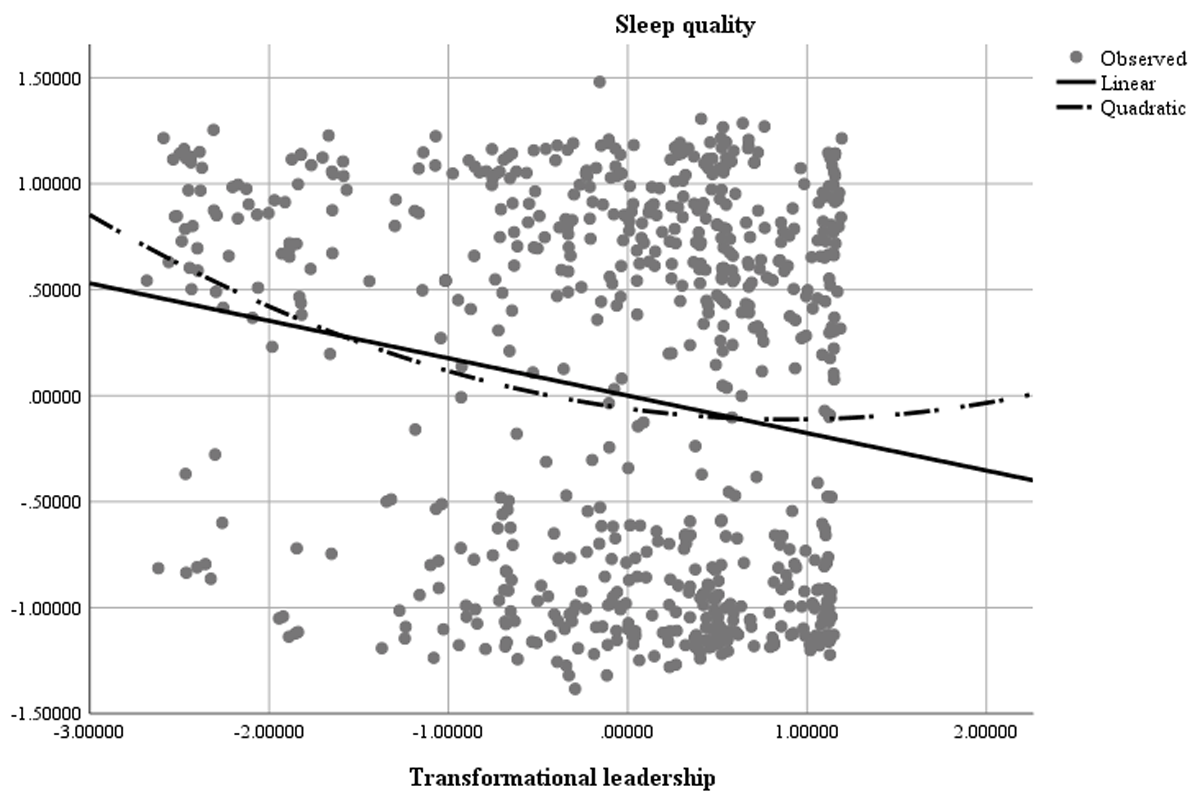
Figure 2
Transformational leadership’s effect on sleep quality.
These findings provide support to the research question about TL’s curvilinear relationship with emotional exhaustion and sleep deprivation in a heterogeneous sample.
Engaging leadership
The result of the linear curve estimation (cf. Table 4) in model 1 of EL on emotional exhaustion showed an explained variance of 9.8% (p < 0.05, t = –8.910) and gave a statistically significant contribution (β = –0.323) to the variance. The quadratic term was not significant. The results in model 1 of Table 5 depicts engaging leadership’s effect on sleep deprivation. explained variance 4.2% (p < 0.05, t = 5.673) and contributed statistically significantly (β = 0.207). Neither quadratic nor cubic estimation in model 2 and 3 regression analysis showed significant results.
Supplementary analysis
The literature argues for a strong similarity between TL and EL (Decuypere & Schaufeli, 2021). Indeed, our study estimated a strong correlation matrix (r = 0.814). As there is a need for more research on EL and its incremental validity (Van Tuin et al., 2020), we conducted a posteriori hierarchical regression analyzes to examine EL’s added value to TL’s effect on emotional exhaustion and lack of sleep. The results are presented in Tables 6 and 7.
Table 6
Engaging leadership’s incremental validity: emotional exhaustion.
| MODEL 1 | MODEL 2 | |||||||
|---|---|---|---|---|---|---|---|---|
| β | t | T | VIF | β | t | T | VIF | |
| TL | –0.303** | –8.522 | 1.00 | 1.00 | –0.137* | –2.253 | 0.337 | 2.963 |
| EL | –0.204** | –3.357 | 0.337 | 2.963 | ||||
| R2adj | 0.09** | 0.103** | ||||||
| DR2 | 0.014** | |||||||
[i] Note. *p < 0.05, **p < 0.001; T: Tolerance; VIF: Variance Inflation Factor.
Table 7
Engaging leadership’s incremental validity: sleep deprivation through hierarchical.
| MODEL 1 | MODEL 2 | |||||||
|---|---|---|---|---|---|---|---|---|
| β | t | T | VIF | β | t | T | VIF | |
| TL | –0.193** | –5.285 | 1.00 | 1.00 | –0.074 | –1.174 | 0.337 | 2.963 |
| EL | –0.148* | –2.341 | 0.337 | 2.963 | ||||
| R2adj | 0.036** | 0.042** | ||||||
| DR2 | 0.007* | |||||||
[i] Note. *p < 0.05, **p < 0.001; T: Tolerance; VIF: Variance Inflation Factor.
Table 6 shows that the changed explained variance (∆R2) describes EL’s added value to TL’s effect on exhaustion. Whereas TL explained 9.0% of the variance in emotional exhaustion, the latter increased when EL was added to the equation (∆R2 was of 1.4%). In addition, the effect of EL was slightly higher than that of TL (β = –0.204 and β = –0.137 respectively). Table 7 shows that TL’s explained variance on sleep deprivation was 3.6% (p < 0.01), the latter increased to 4.2%. The effect of TL (β = –0.074ns) was no longer significant whereas that of EL’s effect was (β = –0.148). This may be due to the interaction between EL, TL, and sleep deprivation, or that EL suppresses the effect of TL. In conclusion, this analysis shows the incremental validity of EL. It adds to TL’s effect on emotional exhaustion and sleep deprivation.
Discussion
The study by Molines and colleagues (2022), where a curvilinear relationship was found between TL and emotional exhaustion was reported, this may suggest that being a transformational leader is not enough. Leaders should also be cautious with the dosage. Too-much-of-a-good-thing may have negative consequences, not only for creativity and innovation (Chen et al., 2018; Chung & Li, 2021) but also for stress. Because of the possible ramifications for leaders and leader development programs, we aimed to not only replicate but to also extend it by first investigating whether this relationship also holds for sleep deprivation and secondly by contrasting it with EL.
We could indeed replicate the findings of Molines and colleagues (2022) as we found curvilinear effects for both indicators of stress. But a high degree of TL in practice will not lead to more emotional exhaustion and sleep deprivation among employees compared to a low degree of TL. From the curvilinear graph, it appears that the effect TL has on emotional exhaustion and sleep deprivation is strongest at a low degree of TL and decreases at an average degree. This may mean that TL, to the greatest extent, reduces emotional exhaustion and sleep deprivation among employees when experienced to an average degree, and that thereafter it has no noticeable effect. In other words, too much of a good thing does not seem to have a harmful effect as the vitamin model suggests. It may look like a D vitamin, but in practice it behaves like C or E vitamins. Since excessive exposure does not lead to a negative effect, as suggested by Warr’s vitamin model, using the same vitamin analogy, one could compare the situation to a vitamin C or E which does not lead to negative consequences when taken in excessive amount. Yet, that the relationship is curvilinear, may be explained from a COR perspective. Experiencing rather high levels of TL may lead to emptying the resources reservoir: inspirational motivation and challenging the status quo may lead to followers thinking too much about work—in their free time—which can be assumed to come with a cost: having a bit more emotional exhaustion and a little bit of loss of sleep quality (see also: Hülsheger et al., 2015). These findings further underscore the importance of exploring the relationship between a largely positively regarded leadership style on employees and other workplace variables.
The second research question focuses on an extension of Molines et al. (2022) study to EL. In the literature, there is an argument for an overlap between TL and EL (Decuypere & Schaufeli, 2021). Owing to the similarities between leadership styles, we could expect to find similar results for EL. Yet, an important difference between TL and EL is that EL is based on satisfaction of basic psychological needs, while TL focuses more on connections that ensure increased motivation and morale in both the manager and employees (Deci & Ryan, 2012; Schaufeli, 2015), potentially leading to a negative relationship with stress outcomes (Niemiec et al., 2022). Our findings supported the latter because we only found a linear relationship between EL and the stress outcomes, and not a curvilinear one.
Although both leadership styles are quite person-centered, a difference between TL and EL is the latter’s focus on basic needs satisfaction. In essence, the ‘self’ stands central, particularly in two of the three subdimensions: strengthening and connecting. By strengthening, the leader’s behavior is directed towards supporting employees to self-develop and grow and optimally deploy their talents within the work environment (Van Tuin et al., 2020). Strengthening means also acknowledging that employees wish to make a difference and want to contribute to the realization of something of value beyond their immediate self-interest (Van Tuin et al., 2020). Connecting is not only about promoting teamwork, team spirit, and collaboration across functions, it is also about supervisor behavior that is supportive and trustworthy and promotes psychological safety employees e.g. voice concerns and show themselves without any fear of negative consequences (Van Tuin et al., 2020). Putting the ‘Self’ central, we expect the follower to voice concerns when getting overwhelmed, which prevents this leadership from getting too much of good thing. The absence of a curvilinear relationship between EL and the stress outcomes, may attest to this and may account for EL to function as a C or E vitamin, instead of an A or D vitamin.
Strengths and weaknesses
This study has several strengths. It has a heterogeneous sample, with respondents from three different sectors and six organizations. The gender distribution of the respondents is quite equal, with women making up 49.9% of the respondents and men making up 44.3%. This means that the results in this study are more generalizable to different occupational groups and genders than those of Molines and colleagues (2022), whose sample consisted of a single occupational group with 92.18% men.
Nevertheless, the study has several weaknesses. Firstly, the study is cross-sectional, so it is not possible to establish causality. All data also comes from a single source, so ‘single source bias’ cannot be ruled out. Thus, it is not certain that all variations in the responses are due to the actual conditions being studied (Podsakoff et al., 2003). In addition, common method bias cannot be ruled out when using only one method for data collection (Podsakoff et al., 2003). Finally, the instrument for measuring sleep deprivation, had a Cronbach’s α of 0.69, yet with three dichotomous items, the latter may be sufficient when three items are used. A reliability analysis showed α = 0.71 if the item ‘Do you have persistent fatigue (fatigue)?’ was removed. This item was nevertheless retained, because the Flemish Work Monitor (Bourdeaud’hui et al., 2004) is an existing scale, and that α > 0.6 is satisfactory for measuring instruments with few items (Sanders & Eggen, 1993).
Finally, in the posteriori results, it seemed that engaging leadership was mediating the relationship between transformational leadership and stress outcomes. Both theoretical and empirical research points to the mediational role of basic needs faction between the work environment and occupational stress and health (Gagné & Deci, 2005; Van den Broucke et al., 2008). Previous research also reported a positive relationship between TL satisfaction of basic needs (Hetland et al., 2011). Hence, it is possible that EL accounted for the environmental factor that satisfies basic needs. Still, this effect should be interpreted cautiously and may be more consistent with shared variance than with mediation.
Future research
For this replication only two indicators of stress have been used. Future studies aiming to study the possible negative side of TL should measure not only emotional exhaustion or sleep in order to replicate our study, but also broaden their perspective on measuring stress. Furthermore, the use of widely used and standardized measures may be useful to study stress reactions that emerge in the short- and in the long-term. With respect to short-term responses, it may be worthwhile to investigate the role of negative emotions, when meeting a very highly transformational leader. Suppressing these emotions and displaying positive ones to meet the expectations of such a leader may evoke a stronger stress reaction (Gross & Levenson, 1997). Brotheridge and Lee (2002) showed that emotional dissonance resulting from surface acting is positively related to stress and burnout. With burnout, we are in the realm of the longer-term stress reaction. Whereas our findings are supportive of curvilinear effects, with respect to the energy dimension of the burnout concept, the question of whether such a relationship also appears with respect to the other burnout dimensions (cynicism and personal accomplishment) remains to be investigated.
Even though the current sample was rather heterogeneous, replications across even more heterogeneous, and even representative samples, are needed to generalize our, and Molines’, findings. Larger samples, allowing generalization of the findings, is also interesting to further explore the impact of both TL in other work settings or professions where emotional exhaustion, emotional dissonance, and emotional demand have been found to be prevalent like social workers, teachers, prison guards, and nurses.
The data in this study is based exclusively on employees’ subjective assessments of their leaders. Further research can therefore advantageously include other data sources to investigate the topic. Such data sources can be observations or direct reporting from leaders.
Our findings regarding EL are linearly related to stress indicators and add to and possibly mediates the relationship between TL, and these indicators begs the question of the role of basic need satisfaction (and frustration) to the foreground. Empirical research reported a mediation effect of basic needs satisfaction between job resources and emotional exhaustion (van de Broeck et al., 2008). Because positive leadership forms ought to act like a resource (Tummers & Bakker, 2021), and empirical research reporting similar direct relationships between both basic need satisfaction and leadership (both with EL and TL), the question on whether basic need satisfaction does empirically distinguish both leadership styles from one another, with respect to stress, needs to be answered. To this aim we call for longitudinal research that measures at least these three theoretical constructs together with indicators of stress.
Conclusion
Through this study, it has been shown that both TL and EL have a negative relationship with the stress outcomes of emotional exhaustion and lack of sleep. Additionally, TL has a curvilinear relationship with emotional exhaustion and lack of sleep, whereas EL does not. In a comparison of the linear effects, it can be argued that EL has a bit larger negative effect on stress outcomes than TL, possibly due to meeting the basic psychological needs of the employees. Indeed, further analysis showed that practicing EL adds value to TL’s effect on emotional exhaustion and lack of sleep, which means that satisfying employees’ needs can be appropriate, also for those leaders who already practice TL. From a practical perspective, our findings suggest that leadership development programs should focus not only on increasing transformational behaviors, but also on fostering leaders’ awareness of followers’ capacity limits and recovery need. As it appears that there are possible negative sides to TL, a focus on meeting psychological needs can therefore help to avoid these potential pitfalls. Yet, before changing existing leadership development training, the importance of satisfying basic needs remains to be investigated.
Appendices
Appendix
Table 1
Fit Statistic confirmatory factor model and a two dimensional confirmatory factor model.
| MODEL | χ² | DF | BIC | RMSEA | CFI | TLI | SRMR |
|---|---|---|---|---|---|---|---|
| 1 factor | 733,99 | 189 | 10583 | 0.119 | 0.850 | 830 | 0.049 |
| 2 factor | 460,90 | 188 | 10182 | 0.085 | 0.925 | 0.916 | 0.036 |
[i] Note: Mplus 8.1 was used with a MLR estimator to compare whether LF and TL were two-factor or one-factor. Both the BIC and the strong significant drop in χ² of the two-factor model indicate that a two-factor solution is more appropriate.