
Introduction
In the organisational justice literature, empirical evidence suggests that there are four distinct, but related dimensions of organisational justice, namely distributive, procedural, interpersonal, and informational justice (Colquitt et al. 2001). Overall justice, which refers to the global justice assessment of an organisation (Ambrose & Schminke 2009; Holtz & Harold 2009), is deemed to more accurately and parsimoniously reflect how employees experience fairness in their workplace. According to Robbins et al. (2012, p. 249) ‘researchers should examine profiles of unfairness rather than solitary facets when studying important outcomes such as employee health. Focusing on one facet or some subset of facets may substantially reduce the predictive validity of the results.’ Although this idea appears intuitive, it is rarely followed in the literature and only very few studies have examined individual heterogeneity in the different justice concepts (Fouquereau et al. 2020; Lin et al. 2019; Tziner et al. 2020).
While the few existing studies using a person-centred approach have made valuable contributions, they have generally been limited to examining a few individual justice dimensions (Fouquereau et al. 2020; Tziner et al. 2020) or focussing on how justice judgements are formed (Lin et al. 2019), rather than exploring how multiple aspects form distinct justice profiles. Therefore, a more comprehensive approach is needed – one that considers the combinations of different justice concepts to answer the question regarding how different justice concepts are experienced together. Furthermore, considering not only the different justice dimensions but also overall justice, does help to add knowledge on the integration of the concepts. Also, as justice is a lived experience (Rupp 2011), it is crucial to study different aspects of justice simultaneously to reveal complex patterns of experiences in different subgroups of individuals. This may not only provide novel insights of theoretical and practical relevance but also provide answers for the ongoing debates on the relative importance of different dimensions of organisational justice. We contribute to the existing person-centred studies on organisational justice in several ways. By focussing on individual differences and how justice perceptions vary across subgroups, we can gain a better understanding of how justice perceptions co-occur and form distinct latent profiles within employees, as well as how these justice profiles relate to developments in health and well-being over time. Thus, the use of person-centred methods is valuable for identifying vulnerable groups; more studies are needed that also consider potential individual differences that may exist between subgroups with varying justice perceptions.
Consequently, our first aim is to investigate how justice perceptions co-occur within employees and form different latent profiles based on cross-sectional data. Secondly, in order to identify vulnerable groups that are likely to experience low organisationavl justice in one or several aspects, we describe the derived justice profiles in terms of employees’ demographic and work-related factors (e.g., age, gender, education, occupational sector). Lastly, to validate the derived profiles, we evaluate how multiple aspects of work-related outcomes and general health are cross-sectionally and prospectively associated with the derived profiles. With these aims, we make several contributions. We respond to calls in the literature (Robbins, Ford & Tetrick 2012; Rupp 2011) to jointly consider various justice aspects and to study what patterns of justice experiences exist, how prevalent these patterns are, and evaluate the relevance of such patterns for important work and health outcomes. In particular, by adding overall justice, we will improve understanding of the entire justice experience (Ambrose & Schminke 2009; Ambrose, Wo & Griffith 2015). Moreover, the person-oriented approach can highlight disadvantaged groups in the labour market and help identify those at greater risk of ill health (Eib, Leineweber & Bernhard-Oettel 2021), workplace misbehaviour (Everton et al. 2007), as well as job dissatisfaction and poor work performance (Colquitt et al. 2013; Rupp et al. 2014).
Organisational Justice Concept
Organisational justice perceptions refer to individuals’ subjective judgements of whether they feel treated fairly at work (Byrne & Cropanzano 2001). Since Adams’ equity theory and the beginnings of social exchange theory in the 1960s until today, the concept has undergone considerable revisions and developments. Early work focussed on distributive justice, having recognised that individuals compare the effort (inputs) they put into their work to the rewards (outputs) they get out of their job. Thus, equity theory (Adams 1965) shares commonalities with effort-reward imbalance (ERI, Siegrist 1996) and ERI has been described as ‘a tolerable proxy for distributive justice’ (Ferrie et al. 2006, p. 449). Further research led to the discovery that individuals view outcome decisions as fairer when they have a say in the proceedings (Thibaut & Walker 1975). Research into this new dimension of the justice construct, procedural justice, rose steeply, leading to many debates on whether distributive justice, outcome favourability, and procedural justice can be distinguished. Bies and Moag (1986) proposed that procedural justice entails two aspects, one about the structure of how decision-makers come to decisions and one about how decision-makers communicate these decisions. As a result, the justice construct was split into distributive, procedural and interactional justice (i.e., the enactment of procedures). Later, Greenberg (1993) suggested to split interactional justice into interpersonal (i.e., relating to respectful and dignified treatment) and informational justice (i.e., relating to truthful and candid explanations), as the social aspects of the structural equivalents of distributive and procedural justice. Consequently, outcome-focussed justice dimensions (i.e., distributive and interpersonal justice) and process-focussed justice dimensions (i.e., procedural and informational justice) can be distinguished (Moon 2017). While there is a body of research using the four-dimensional approach, many scholars do not measure all four dimensions (Rupp et al. 2017) and the debate on what dimensions constitute justice is still ongoing.
In addition to this ongoing debate, there has been a separate development in the organisational justice literature – overall justice. In the last twenty years, arguments have been made that ‘overall justice accounts for variance in outcomes above and beyond that accounted for by justice facets’ (see Ambrose, Wo & Griffith 2015, p. 110). Empirical studies find an inconsistent pattern on the strength of association between overall justice and the different justice facets, and the facets, on average, have been found to account for less than half of the variance in overall justice (for an overview see Ambrose et al. 2015). One reason for this may be that researchers have mainly studied the different justice dimensions’ effect one at a time, which does not allow for capturing complex interactions between different dimensions of justice and overall justice. This lack of studies focussing on a person’s overall experiences of these different aspects of justice perceptions is surprising given that there have been calls to study employees’ experience of fairness at the workplace (Rupp 2011). Studying patterns in several aspects of justice simultaneously, using latent profile analysis, for example, provides insight into the overall experience of organisational justice.
A Person-Centred Perspective Of Organisational Justice
Previous work on organisational justice has mainly used a variable-oriented approach, examining averages in variables and building on the implicit idea that the researched sample of employees stem from a homogenous population. This is seldom the case, and therefore, average variable values and changes in them may mask substantial variation between unobserved subgroups. Individuals collect and evaluate different amounts and types of information when forming overall justice judgements (Lin et al. 2019) and tend to seek more or less information when making evaluations (Liao & Rupp 2005). In organisations, and the working population in general, individuals have different employment experiences, encounter different managers and go through a variety of changes in the organisational context, and throughout their career. Also, they have different occupational backgrounds and typically work in different hierarchies in their respective organisations. This is likely to result in different justice perceptions in relation to entities (e.g. managers), events (e.g. organisational changes, annual salary evaluations), and organisational procedures or practices as a whole. Such variations can be modelled with person-oriented approaches by clustering individuals with similar justice perceptions.
Few studies have used person-centred approaches to identify different profiles of organisational justice perceptions. One study using Profile Analysis via Multidimensional Scaling draw the conclusion that overall perceptions of justice rather than individual justice components affect emotional exhaustion (Tziner et al. 2020). However, a considerable shortcoming of this study is that it did not include a measure of overall justice, but mainly identified high correlations between different justice dimensions, namely distributive, procedural and interactive justice, labelling those as overall perceptions of justice. Also, the main focus of this study was not organisational justice, but emotional intelligence. Another study that investigated the types of information individuals use when making justice judgements regarding their organisation, identified four different latent classes. These four classes captured different patterns of information used when making overall justice judgements (Lin et al. 2019). However, while the authors of this study were interested in the formation of justice judgements, we focus on how different aspects of perceived organisational justice cluster together. In this line, we found one study focussing on employees’ latent justice profiles based on interpersonal and informational justice (as separate dimensions) and interactional justice (a global dimension of both interpersonal and informational justice). In that study, five different interactional justice profiles were identified (a normative profile, a high interpersonal/average informational profile, a low interpersonal profile, a high interpersonal/low informational profile and a high informational profile (Fouquereau et al. 2020).
Here, we expect that organisational justice aspects may co-occur within persons in different configurations (i.e., profiles). For example, people might differ with respect to outcome-focussed justice dimensions (distributive and interpersonal justice) and process-focussed justice dimensions (procedural and informational justice) (Folger & Konovsky 1989). It is also possible for individuals to differ in their tendency to focus on specific environmental (justice) cues. That is, a person may still regard overall justice as satisfactory as long as some aspects indicate high justice, while other aspects are seen as unfair. This may also happen if overall justice perceptions are built upon sources other than the four justice dimensions. Thus, we hypothesise:
Hypothesis 1: There will be two or more latent profiles of perceived organisational justice.
Associations Between Organisational Justice Profiles and Demographic and Work-Related Background Variables
Only a few studies examine profiles of justice perceptions, and thus, how demographics relate to justice profiles is speculative. Here, we examine a number of explanatory variables that previous literature has suggested to be associated with different organisational justice dimensions; namely gender, age, working sector, socio-economic status, working hours, and shift work. Furthermore, these are relevant variables to identify potential vulnerable subgroups in the labour market. Studies indicate that organisational justice is a key driver of workplace misbehaviour (Everton et al. 2007), job satisfaction and work performance (Colquitt et al. 2013; Rupp et al. 2014). Thus, gaining knowledge about groups who are prone to experience organisational injustice may help organisations identify employees at risk and focus their, often limited, resources on these employees.
With regards to gender, it has been theorized that gender may affect the importance attached to different justice dimensions (Bell & Khoury 2016), but evidence for the differential importance of the justice dimensions to women and men are mixed and inconclusive. Some studies found neither gender differences in perception of organisational justice (Owolabi 2012; Sverke et al. 2017), nor in reactions to perceived organisational justice (Gbadamosi & Nwosu 2011). Yet, Bell and Khoury (2016) argue that women may be more sensitive to procedural justice because they are aware of systemic gender inequality existing in society and at workplaces. Opposed to this, Simpson and Kaminski (2007) found that women significantly ranked distributive justice higher in order of priorities, and procedural justice lower compared to men. Finally, a recent review describes several studies that have found significant differences in justice evaluations between genders (Cachón-Alonso & Elovainio 2022). Overall, results are somewhat inconclusive, but there are indications that justice perceptions may differ between men and women, because they may have different priorities and also work in gender-segregated jobs with different degrees of justice.
In addition to gender, age might alter justice perceptions. Based on the socioemotional selectivity theory (SST, Carstensen 1992), it has been suggested that employee age might alter the personal relevance of workplace experiences that are associated with fulfilling instrumental and relational needs (Brienza & Bobocel 2017). Indeed, it has been found that, relative to younger workers, older workers are more sensitive to informational and interpersonal justice (Brienza & Bobocel 2017). Others have found that state government employees in the US, who reported more years of public service and were thus likely to be older on average, were less likely to perceive their workplace as fair (Butitova 2019).
Perceptions of organisational justice may also differ between employees in the public and private sector (Butitova 2019). In Sweden, public sector employees generally experience poorer working conditions than employees in the private sector (Furåker 2000). Also, salaries in the public sector are overall lower as compared to the private sector, which might lead to lower levels of distributive justice. Indeed, in one study based on US-employees, public sector employees held weaker distributive and procedural justice perceptions than private sector employees (Kurland & Egan 1999). A more recent study, based on a random sample of Finnish physicians, found that physicians employed in the private sector experienced higher levels of organisational justice, measured as the mean of four justice dimensions, as compared to physicians employed in the public sector (Heponiemi et al. 2011).
Socio-economic position is another potentially influential factor related to organisational justice perceptions. It has been suggested that the social exchange relationship is stronger among white-collar workers, whereas blue-collar workers rather establish an economic exchange with the organisation (Herr et al. 2015), suggesting more emphasis on instrumental needs. Indeed, it has been found that interactional and procedural justice are positively associated with heart rate variability, considered a sign of good health, among white-collar workers, but not among blue-collar workers (Herr et al. 2015). In another study, it was found that a negative change in procedural and interactional justice was related to a negative change in mental health in white-collar workers, while among blue-collar workers only a negative change in procedural justice was related to a negative change in mental health (Herr et al. 2020).
Little is known about the relationships between working hours and shift work and organisational justice, respectively. One Finnish study found that organisational justice levels were lower for those working on night shifts compared to other shifts (Heponiemi et al. 2013). Also, shift workers are more likely to report unfavourable levels of effort-reward imbalance than day workers (Peter et al. 1999).
In summary, we argue that different profiles are differentially related to employees’ characteristics. However, in view of the contradictory findings that mainly stem from research using a variable-oriented approach we formulate the following research question rather than a set of hypotheses:
RQ1: How do the observed organisational justice profiles differ between workers with different demographic (gender, age, socio-economic position) and work-related (job sector, working hours, shift work) characteristics?
Associations of Organisational Justice Profiles with Work and Health Outcomes
A large number of studies has examined perceptions of organisational justice to different health- and work-related outcomes (Colquitt et al. 2013; Robbins, Ford & Tetrick 2012). One commonly studied health outcome is self-rated general health (Eib, Leineweber & Bernhard-Oettel 2021). Studies have found different associations depending on the justice dimension (Elovainio, Kivimäki & Vahtera 2002) and improvements in procedural justice have been associated with improvements in general health (Herr et al. 2020; Leineweber et al. 2016).
Another important line of research has focussed on the effects of organisational justice on job satisfaction (Judge, Zhang & Glerum 2020). Generally, high levels of organisational justice are associated with higher levels of job satisfaction (Colquitt & Greenberg 2003), but findings also suggest that, compared with procedural justice, distributive justice is more strongly associated with pay satisfaction and more weakly associated with overall job satisfaction (Judge, Zhang & Glerum 2020). Measures of organisational justice have also been shown to be positively related to organisational commitment, performance (Colquitt et al. 2001), turnover behaviour (Leineweber et al. 2020) and turnover intentions (Mengstie 2020). For example, one study found that a decrease in perceived justice was associated with higher turnover intentions, while an increase was associated with lower intentions to leave (Herr et al. 2020). However, one meta-analytical review found only a weak relationship between interpersonal justice and withdrawal (Colquitt et al. 2013).
According to the two-factor justice model, outcome-focussed justice exerts greater influence on person-related outcomes, whereas process-focussed justice exerts greater influence on organisation-related outcomes (Moon 2017). Indeed, there is evidence supporting these assumptions. For example, Folger and Konovsky (1989) found that distributive justice has greater influence on pay satisfaction, while procedural justice was more strongly associated with organisational commitment and trust in leadership. Similarly, Konovsky and Cropanzano (1991) reported that procedural justice was more predictive of affective commitment, trust, and performance than distributive justice. However, if and how different justice aspects relate to different health and work-related outcomes needs further attention.
Since these earlier studies have focussed on different justice variables and their associations to outcomes, little is known about how different profiles in a more holistic manner relate to work and health outcomes. Thus, we pose the following research question:
RQ2: How do work and health outcomes (job satisfaction, turnover intentions, self-rated health) cross-sectionally and prospectively differ across organisational justice profiles?
Methods
Study Sample
Data were drawn from the Swedish Occupational Survey of Health (SLOSH) (Magnusson Hanson et al. 2018). SLOSH started in 2006 with a first follow-up of all participants in the Swedish Work Environment Survey (SWES) from 2003. Since, further SWES participants have been added and at the time this study was conducted, SLOSH consisted of all SWES participants 2003–2011 (n = 40,877). SWES participants are sampled from the Labour Force Survey (LFS) conducted biennially by Statistics Sweden where participants are randomly drawn from the entire Swedish population, while stratified for county, sex, citizenship and inferred employment status. Thus, at baseline the SLOSH population can be regarded as approximately representative for the Swedish working population. Details about data collections can be found at www.slosh.se.
Participants were asked to fill in a postal questionnaire in either of two versions, one for those currently in paid work and one for those permanently or temporarily outside the labour force. The current study was based on data drawn from SLOSH 2018 (n = 17 841 respondents, response rate 48%) and 2020 (n = 17 489 respondents, response rate 49%). Profiles were calculated on cross-sectional data drawn in 2018 and associated with outcomes measured in 2018 and 2020. Analyses were restricted to those who answered the questionnaire for those in paid work in 2018 (n = 11,552). After exclusion of self-employed, the study sample comprised n = 10,700 individuals. Further reduction to only those with valid information on all justice measures resulted in a study sample consisting of 9,478 participants. Of these participants, 77% (n = 7,542) participated also in SLOSH 2020, with 86% (n = 6,469) answering the version for working participants. A non-response analyses showed that non-responders were generally older, more often male, had lower education levels, and were more likely to have a lower socioeconomic status and part-time employment. Additionally, those who dropped out in 2018 reported higher turnover intentions and poorer general health, though no significant differences were found regarding shift work, employer, or work satisfaction. Details are provided in the web-appendix.
In 2018, the mean age of the study sample was 52 ± 9 years, about 60% were women (n = 5,806), and 8 out of 10 participants worked fulltime (n = 6,870). By answering the survey, the participants gave they informed consent. The study was approved by the ethical review board in Stockholm (dnr 2018/1439-32).
Measures
Justice Measures
Organisational justice was measured by means of five different justice aspects, namely overall justice, procedural justice, interpersonal justice, informational justice, and as an indicator for distributive justice, effort-reward imbalance. Overall justice was measured by six items developed by Ambrose and Schminke (2009). Items were answered on a scale ranging from 1 = ‘strongly disagree’ to 7 = ‘strongly agree,’ such higher values indicate higher justice. One example item is ‘Overall, I’m treated fairly by my organisation.’ Mean values were calculated when at least one item had a valid answer (α = 0.90). Procedural justice was measured by a 5-item scale (Moorman 1991). The items reflect fairness of the formal procedures used, and the fairness of the interactions that enacted those formal procedures. One example item is ‘All sides affected by the decision are represented involved’. Responses ranged from 1 = ‘totally agree’ to 5 = ‘totally disagree’. A sixth alternative, ‘not applicable’, was coded as missing. For analyses, a mean value was calculated when at least one item had a valid answer (α = 0.91). Interpersonal and informational justice were measured by four respectively three items (Leineweber et al. 2017; Setterlind & Larsson 1995). Example items are ‘I receive praise from my boss if I have done something good’ and ‘My boss gives me the information I need.’ All items were answered on a four-point Likert-scale ranging from 1 = yes, often to 4 = no, never. For analyses, a mean value was calculated when at least one item had a valid answer. Higher values indicated higher levels of justice (α = 0.88 for interpersonal justice and 0.80 for informational justice). While these questions did not derive from a traditional scale to measure interpersonal and informational justice they reflect these justice dimensions in a conceptual way. The questions used to measure interpersonal justice mirrors the extent to which employees feel they are treated with respect, dignity, and care by their boss, which are key elements of interpersonal justice. Items on informational justice explore whether employees feel adequately informed and whether that information is presented clearly and in a way that is understandable and fair. An indicator of distributive injustice was available through the Swedish validated short version of the Effort-Reward Imbalance (ERI) questionnaire (Li et al. 2019), with effort measured by three items and reward by seven items. An example item for efforts is ‘I have constant time pressure due to heavy workload.’ An example item for rewards is ‘Considering all my efforts and achievements, I receive the respect and prestige I deserve at work.’ Items were answered on a four-point Likert-scale ranging from 1 = ‘agree totally’ to 4 = ‘do not agree at all’ (α = 0.72 for reward and 0.78 for effort). Sum scores of these ratings were calculated with appropriate recoding so that higher scores reflect greater effort and reward. Finally, an effort-reward ratio was constructed based on a predefined algorithm where higher values indicate higher imbalance, i.e., lower distributive justice (Siegrist 1996).
Demographic and Work-Related Background Variables
Age, sex, and education were drawn from registry data linkages to SLOSH. Age was age in years at end of 2018. Sex was male = 0 or female = 1. Education referred to the highest educational level as registered in in spring 2017 and categorised into ‘secondary school or lower’ and ‘higher than secondary school.’ Social position was obtained by standardised questions, coded following the Swedish Socio-economic classification (SEI), and dichotomised into 0 = low (SEI 11 to 36) and 1 = high (SEI 46 to 57). Three variables were chosen to describe the work environment. All were obtained from survey data. Worktime was measured by one question ‘Currently, do you work fulltime or part-time?’ with response options 0 = part-time and 1 = fulltime. Shift work was measured with the question ‘What are your normal working hours?’ with response options coded into 0 = day work, unregulated working hours and 1 = evening work, nightwork, 2-shift work, 3-shift work, rostered work. The main employer was coded into 0 = public (non-profit organisation, municipality, county, state) or 1 = private.
Work and Health Outcomes
All outcome variables were measured at baseline (2018) and two years later (2020). Job satisfaction was measured by a single item ‘Roughly, how satisfied are you with your work?’ answered on a scale from 1 (‘very unsatisfied’) to 8 (‘very satisfied’). Turnover intentions were measured by one question ‘I feel like resigning from my current employment’ (Hellgren, Sverke & Isaksson 1999), answered on a 5-point scale with the anchors 1 = ‘totally disagree’ to 5 = ‘totally agree.’ Suboptimal general health was chosen as an indicator or health and was measured by one item ‘How would you rate your general state of health?’ (Benyamini & Idler 1999) with response option ranging from 1 = ‘very good’ to 5 = ‘very poor.’ This item was reversed, thus higher values indicate better general health. A correlation table of all study variables is available in the web-appendix Table A2.
Statistical Analysis
In a first step, we conducted several confirmatory factor-analyses to secure that the justice concepts used in the latent profile analyses indeed were separate factors (see web-appendix for a detailed description).
In a second step, we used latent profile analysis with observed variables to identify distinct profiles of organisational justice. We estimated models with one to seven profiles through robust maximum likelihood (MLR) estimation using Mplus 8. Various criteria were used to determine the number of latent profiles deemed adequate. The Bayesian Information Criterion (BIC) and the Sample-size Adjusted Bayesian Information Criterion (SABIC) were first used to determine the number of profiles, with lower BIC values suggesting a better fitting model. However, it is known that these criteria remain heavily influenced by sample size (Marsh et al. 2009), so that with sufficiently large samples, they may keep on suggesting the addition of profiles without reaching a minimum and therefore are ineligible to select an optimal number of profiles (Fouquereau et al. 2020). In such a situation, ‘elbow plots,’ providing a graphical visualisation of the BIC values, are useful to identify the optimal number of profiles (the point where a plateau has been reached) (Morin et al. 2011; Petras & Masyn 2010). We also tested other criteria such as the parametric bootstrapped likelihood ratio test (BLRT), the Vuong-Lo-Mendell-Rubin (VLMR) likelihood ratio test, the Lo-Mendell-Rubin adjusted likelihood ratio test (LMR) with values >0.05, implying that k trajectories are enough compared to k + 1 trajectories (Jung & Wickrama 2008). Additionally, we examined entropy, with values closer to 1 or above 0.80 indicating better precision (Andruff et al. 2009; Weller, Bowen & Faubert 2020). Finally, model adequacy was tested using the average posterior probabilities (APP) of group membership, measuring the likelihood for each individual to belong to its assigned group (preferable >0.7) (Andruff et al. 2009; Jung & Wickrama 2008), as well as the percent of total counts in each group (at least 1% of the participants in each group). We also assessed whether the models distinctive features of the data in a parsimonious way by visual inspection of the profiles. To assess the replicability of the results, we used the optseed option in Mplus.
Profiles were then compared across demographic covariates, as well as health- and job-related characteristics, using the BCH procedure (Asparouhov & Muthén 2021). In this approach, a significant overall chi-square value indicates mean differences across profiles, which are then followed up with pairwise comparisons. Further, to account for prior levels of the outcome, we applied a two-step latent profile model incorporating BCH weighting. Specifically, we included autoregressive paths by regressing each outcome at T2 (2020) on its corresponding value at T1 (2018) within each latent profile, allowing for profile-specific slopes and intercepts. This enabled estimation of outcome means at T2 adjusted for baseline differences. Pairwise differences across profiles were tested using the MODEL CONSTRAINT command in Mplus, with Wald chi-square tests used for statistical inference.
Results
Factor Analyses
As is shown in web-appendix Table A1, the factor analysis indicated that Model 3, with five factors who were allowed to correlate freely performed better than Model 4 where all factors loaded on one common g-factor. The model also performed better than a model, where interpersonal justice and informational justice loaded on one ‘interactional justice’ factor (Model 2), or to a model where all items loaded on a common factor (Model 1). We conclude that the five organisational justice aspects were correlated, but separate constructs.
Model Selection
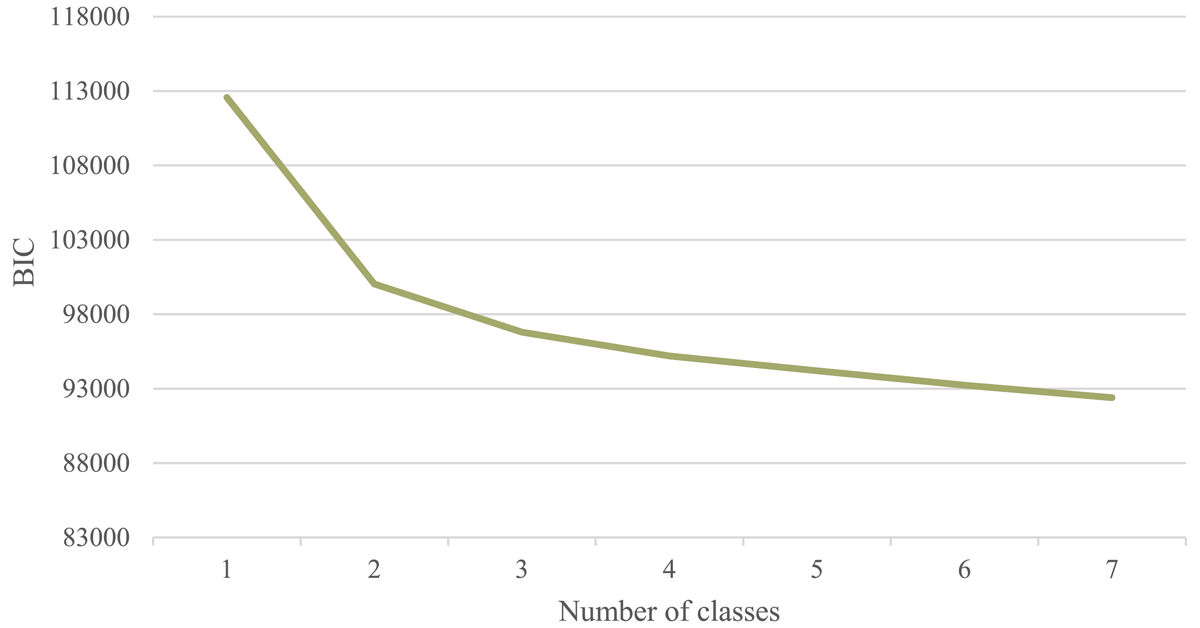
The BIC values for models with one to seven groups continually improved with the addition of profiles, without reaching a minimum (Table 1). Investigation of the elbow plot suggests that the decrease in the BIC drops after three profiles (see Figure F1 in the appendix), while the VLMR and LMR test suggest four (or maximal five) different profiles.
Table 1
Results from the latent profile analysis models.
| NO. OF TRAJECTORIES | TECH 14 BLRTCHI 2 (DF) | BIC | SABIC | VLMR | LMR | ENTROPY | AVERAGE CLASS PROBABILITY | POSTERIOR PROBABILITY |
|---|---|---|---|---|---|---|---|---|
| 1 | – | 1065780.153 | 1065460.375 | – | – | – | – | – |
| 2 | –53243.293*** | 93390.443 | 93339.597 | –53243.293*** | 13005.923*** | 0.831 | [0.96; 0.93] | [0.32; 0.68] |
| 3 | –46621.968*** | 90038.021 | 89968.108 | –46621.968*** | 3346.452*** | 0.800 | [0.93; 0.88] | [0.12; 0.50] |
| 4 | –44918.286*** | 88314.538 | 88225.558 | –44918.286*** | 1746.632*** | 0.768 | [0.91; 0.79] | [0.13; 0.43] |
| 5 | –44029.075*** | 87134.036 | 87025.989 | –44029.075* | 1213.357* | 0.773 | [0.91; 0.79] | [0.03; 0.38] |
| 6 | –43411.354*** | 86317.452 | 86190.338 | –43411.354 | 855.945 | 0.779 | [0.90; 0.78] | [0.03; 0.36] |
| 7 | –42975.591*** | 85743.624 | 85597.443 | –42975.591 | 617.529 | 0.795 | [0.92; 0.78] | [0.02; 0.34] |
[i] NOTE: *p < 0.005; ***p < 0.0001.
Examination of all the statistical fit indices as well as the occurrence of new distinct patterns (a new profile characterised by low overall and procedural justice accompanied by above average levels of interpersonal and informational justice occurred) indicated that the 4-profile model was superior to the other models. Moving to a 5-profile solution did not add conceptually different profiles to the 4-profile solution. As the 4-profile solution showed a number of qualitatively different profiles of theoretical interest that furthermore were relatively distinct in content, this solution was retained for interpretation and for the next stages of analyses.
Individual Differences in Justice Measures
The estimated justice profiles are graphically presented in Figure 1, while the unstandardized mean values are shown in Table 2.
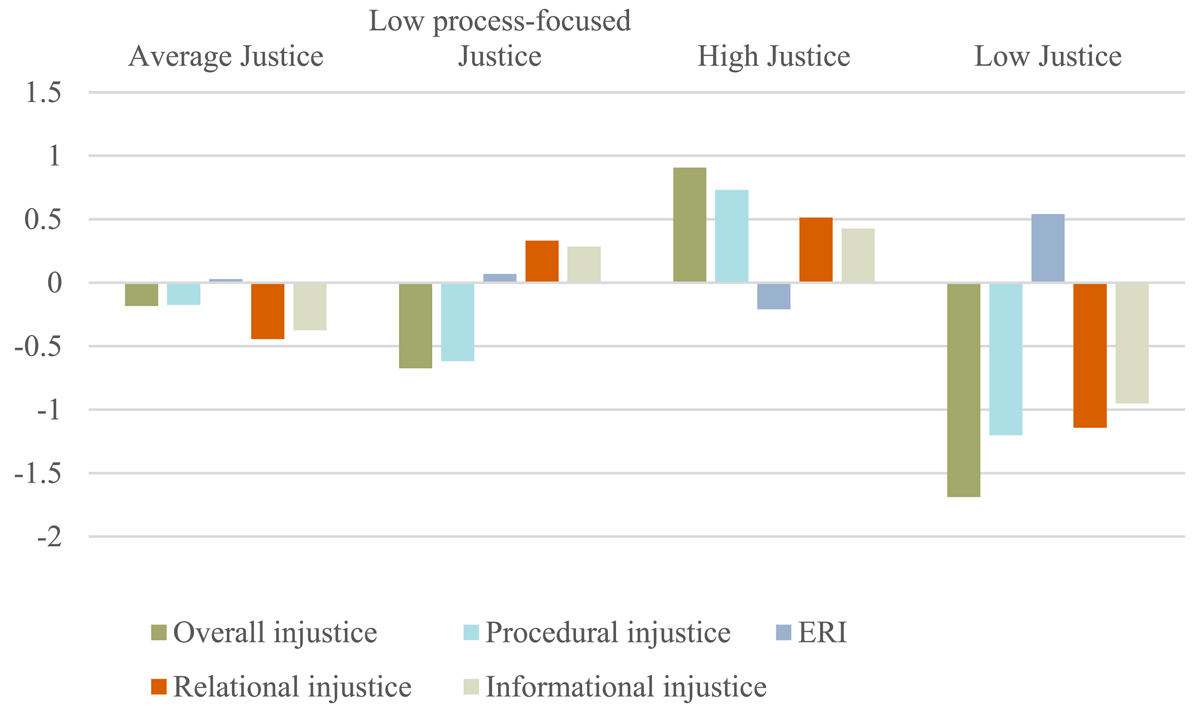
Figure 1
Final 4-profile solution. Grand mean centred values are plotted. Distributive justice is measured by effort-reward imbalance (ERI).
Table 2
Mean values for organisational justice dimensions for the different profiles (n = 9,478).
| MIN-MAX | OVERALL MEANS | PROFILE 1 ‘AVERAGE JUSTICE’ | PROFILE 2 ‘LOW PROCESS-FOCUSSED JUSTICE’ | PROFILE 3 ‘HIGH JUSTICE’ | PROFILE 4 ‘LOW JUSTICE’ | |
|---|---|---|---|---|---|---|
| n = 2769 | n = 1477 | n = 4040 | n = 1192 | |||
| MEAN | MEAN | MEAN | MEAN | MEAN | ||
| Overall justice | 1–7 | 5.25 | 5.06 | 4.57 | 6.15 | 3.56 |
| Procedural justice | 1–5 | 3.16 | 2.99 | 2.54 | 3.89 | 1.96 |
| Distributive justice | 0.25 –4 | 1.07 | 1.10 | 1.14 | 0.86 | 1.61 |
| Interpersonal justice | 1–4 | 3.07 | 2.62 | 3.40 | 3.58 | 1.92 |
| Informational justice | 1–4 | 3.33 | 2.95 | 3.61 | 3.75 | 2.38 |
[i] NOTE: Distributive justice was measured by effort-reward imbalance. Bonferroni adjusted comparisons (p < .05) showed significant differences between all justice dimensions over all profiles. Standard deviations are constant across classes due to equality constraints in the model: Overall justice = 0.80, procedural justice = 0.67, distributive justice = 0.35, interpersonal justice = 0.46, informational justice = 0.39.
Profile 1 was characterised by values of all justice aspects close to the mean and comprised 29% of all participants (n = 2769). We label it the ‘Average justice’ profile. A second profile that covered only about 15% of all participants (n = 1477), is characterised by under-average values of overall and procedural justice, while interpersonal and informational justice values were somewhat above the mean. We label this profile the ‘Low process-focused justice’ profile. The third profile comprised close to half of all participants (43%, n = 4040) and was characterised by all justice dimensions clearly above the mean, except ERI, which was close to the mean. We label this profile the ‘High justice’ profile. A fourth profile comprised 12% (n = 1192) of the participants. This profile was characterised by generally below-average levels of justice. We label it the ‘Low justice’ profile. To summarise, we could support our Hypothesis 1 that there are two or more latent profiles of perceived organisational justice.
Associations with Demographic and Work-Related Background Variables
To answer our Research question 1, we inspected profiles in accordance with their demographic characteristics. Profiles differed statistically significantly across all covariates (see Table 3). A short description of the four profiles follows. In profile 1, the ‘Average justice’ profile, was not distinctive in any particular way and the descriptive characteristics were similar to the overall means. Slightly fewer women than average are represented in this profile. The ‘Low-process focused justice’ profile presented the highest proportion of women and publicly employed. This profile also encompassed a low proportion full-time workers. In sharp contrast, the ‘High justice profile’ showed the highest proportion of participants with above upper secondary education, full-time workers and privately employed. Lowest proportions of persons in low social position, shift workers, and publicly employed are found in this profile. Finally, the ‘Low justice profile’ encompassed the highest proportion of low educated in low social position and those working in shift work.
Table 3
Demographic variables and work and health outcomes across profiles. Results (except for the Total) are based on the BCH procedure.
| TOTAL | PROFILE 1 ‘AVERAGE JUS.’ | PROFILE 2 ‘LOW PROCESS-FOCUSSED JUS.’ | PROFILE 3 ‘HIGH JUS.’ | PROFILE 4 ‘LOW JUS.’ | p | |
|---|---|---|---|---|---|---|
| N = 2769 | N = 1477 | N = 4040 | N = 1192 | |||
| % (n) | % (n) | % (n) | % (n) | % (n) | ||
| Women | 59.31 (5621) | 0.54 (1543) | 0.68 (973) | 0.58 (2370) | 0.62 (735) | 2>4>3>1 |
| > upper secondary education | 57.64 (5459) | 0.56 (1566) | 0.56 (838) | 0.60 (2416) | 0.53 (639) | 3>1,4 |
| Low SES | 38.09 (3500) | 0.40 (1074) | 0.42 (585) | 0.33 (1308) | 0.47 (533) | 4>2 |
| Part-time work | 22.00 (1894) | 0.21(543) | 0.26 (330) | 0.20 (768) | 0.24 (253) | 2>3,1 4>3 |
| Shift work | 15.65 (1460) | 0.15 (439) | 0.24 (315) | 0.10 (428) | 0.25 (278) | 4,2>1>3 |
| Private employer | 47.00 (4244) | 0.52 (1314) | 0.30 (491) | 0.51 (1936) | 0.44 (503) | 1,3>4>2 |
| MEAN (SE) | MEAN (SE) | MEAN (SE) | MEAN (SE) | MEAN (SE) | ||
| Age (mean, s.e.) | 52.22 (0.95) | 51.81 (0.22) | 52.49 (0.32) | 52.27 (0.16) | 52.59 (0.27) | 1<4 |
| Job satisfaction 2018 | 5.98 (0.02) | 5.69 (0.03) | 5.79 (0.05) | 6.80 (0.02) | 4.16 (0.05) | 4<1, 2<3 |
| Job satisfaction 2020 | 6.21 (0.02) | 5.98 (0.04) | 5.94 (0.06) | 6.74 (0.02) | 5.28 (0.07) | 4<1, 2<3 |
| Intentions to leave 2018 | 1.91 (0.01) | 2.06 (0.03) | 2.05 (0.04) | 1.34 (0.02) | 3.24 (0.05) | 3<1, 2<4 |
| Intentions to leave 2020 | 1.74 (0.01) | 1.88 (0.03) | 1.86 (0.05) | 1.43 (0.02) | 2.31 (0.06) | 3<1, 2<4 |
| General health 2018 | 3.96 (0.01) | 3.89 (0.02) | 3.85 (0.03) | 4.16 (0.01) | 3.59 (0.03) | 4<1, 2<3 |
| General health 2020 | 4.02 (0.01) | 3.96 (0.02) | 3.92 (0.03) | 4.17 (0.02) | 3.77 (0.03) | 4<1, 2<3 |
[i] NOTE: p < .05. Mean, s.e.; means are unadjusted (i.e., not controlling for baseline levels). See text for model-adjusted comparisons.
Associations with Work and Health-Related Outcomes
To answer research question 2, differences in work and health outcomes across profiles were examined for 2018 and 2020. Significant cross-sectional and prospective associations were found between justice profiles and all three outcomes: job satisfaction (2018: χ²(3) = 2971.74, p < 0.001; 2020: χ²(3) = 671.15, p < 0.001), intentions to leave (2018: χ²(3) = 2010.42, p < 0.001; 2020: χ²(3) = 337.32, p < 0.001), and self-rated general health (2018: χ²(3) = 425.32, p < 0.001; 2020: χ²(3) = 179.20, p < 0.001). For details, please see Table 3.
To examine whether differences in outcomes across latent profiles remain robust after accounting for prior levels, we conducted a two-step procedure incorporating autoregressive effects and profile-specific parameters. Significant autoregressive paths were found in all profiles and all outcomes, indicating that prior levels predict later levels. For job satisfaction estimates ranged from β = 0.34 to 0.49, all p < 0.001, for intentions to leave estimates ranged from β = 0.17 to 0.32, all p < 0.001 and for general health estimates ranged from β = 0.54 to 0.61, all p < 0.001. Profile-specific intercepts, representing adjusted mean levels of job satisfaction at follow-up, ranged from 3.14 to 3.90 (all p < 0.001). However, none of the pairwise intercept differences were statistically significant, suggesting that, after accounting for baseline job satisfaction, justice profile membership was not associated with significant differences in job satisfaction two years later. For intentions to leave, profile-specific intercepts, representing adjusted mean levels of intentions to leave at follow-up, ranged from 1.08 to 1.70 (all p < 0.001). Pairwise comparisons of adjusted means across latent profiles revealed several statistically significant differences. The adjusted mean for the ‘low justice’ profile differed statistically significantly from the adjusted means of the ‘high justice’ (D = 0.63, SE = 0.19, p = 0.001) and the ‘average justice’ profile (D = 0.45, SE = 0.21, p = 0.030), indicating that individuals in the low justice profile reported significantly higher intentions to leave their jobs than those in the other profiles, even after controlling for baseline levels of intentions to leave. No other pairwise differences reached statistical significance, although the contrast between the ‘low justice’ profile and the ‘low process-focussed justice’ profile showed a trend towards significance (D = 0.40, SE = 0.22, p = 0.063). In regard to general health, profile-specific intercepts, representing adjusted mean levels of general health at follow-up, ranged from 1.58 to 1.82 (all p < 0.001). However, none of the pairwise intercept differences were statistically significant.
Discussion
In this paper, we adopted a person-centred approach to identify profiles of organisational justice. We identified four distinct profiles that differed not only in levels of justice and shape but also were inhabited by different groups of employees and associated with prospective measured of job satisfaction, turnover intentions and general health with varying strength.
Organisational Justice Profiles
Using a conceptualization of five organisational justice aspects, namely procedural, distributive (measured by effort-reward imbalance), interpersonal, informational, and overall organisational justice, we identified four distinct profiles that differ in regard to justice levels as well as in their composition. While three profiles were marked by differences in justice levels over all five organisational justice aspects, namely the ‘Low justice,’ the ‘Average justice,’ and the ‘High justice’ profile, one profile differed in qualitative aspects of organisational justice, namely the ‘Low process-focused justice’ profile. This profile showed levels above the mean for justice dimensions that involved interactional aspects, but levels beneath the mean for aspects of procedural justice and overall justice. While our results indicate that justice dimensions often co-vary, the presence of the ‘Low process-focused justice’ profile could indicate that levels of overall justice are more strongly affected by levels of procedural justice than by levels of interactional justice aspects. Such a reasoning finds support from the two-factor model which suggests that procedural justice is more strongly related to global evaluations of institutions (Folger & Konovsky 1989) than other justice dimensions. These findings, however, are inconsistent with Holtz and Harold (2009), who found that interpersonal justice and distributive justice were more predictive of overall organisational justice than procedural justice. While further research is needed to gain better knowledge on the standing of overall organisational justice to the separate justice dimensions, our results indicate a somewhat stronger correlation between overall and procedural justice than between overall justice and other subdimensions (see web-appendix Table A2). This, however, might also relate to the fact that measures of justice dimensions and overall justice often are confounded regarding source – while overall and procedural justice refer to the organisation as source, it is common practice to use the supervisor as source for interpersonal and informational justice (see Rupp et al. 2017). Still, the results provide an interesting point when looking more deeply at the measurement of justice dimensions and overall justice. Procedural justice, like the other justice dimensions according to Colquitt et al. (2001), are measured using justice principles – for instance, judging whether the employer adhered to the rule of representativeness or voice, in other words, measurement is indirect (Colquitt, Greenberg & Zapata-Phelan 2005). However, overall justice is measured using the direct approach, asking employees to judge whether they feel fairly treated.
We also found that our indicators of interpersonal and informational justice correlated rather highly (r = 0.714, see Web-Appendix Table A2), indicating that these justice dimensions are more closely correlated than the remaining aspects of organisational justice. Thus, our findings support the reasoning of Greenberg (1993), who described interpersonal and informational justice as social aspects as compared to the structural justice dimensions procedural and distributive justice. Both interpersonal and informational justice are highly influenced by the supervisor and studies imply that individuals’ justice perceptions are influenced not only by the organisation but also, to a great and potentially larger extent, by the individual supervisor (Colquitt et al. 2013; Rupp et al. 2014). Another reason for this finding could be that our indicators of interpersonal and informational justice came from a scale originally constructed to measure leadership style. Still, our items are comparable to items used in other justice scales, show good internal reliability and has previously been used to measure organisational justice (Leineweber et al. 2017).
Associations Between Organisational Justice Profiles and Demographic and Work-Related Background Variables
Marked differences in gender compositions of the profiles were found. The proportion of women was remarkably high in the ‘Low process-focused’ profile. If it is, however, gender ‘per se’ that influences justice perception, is unclear (Gbadamosi & Nwosu 2011; Owolabi 2012; Sverke et al. 2017). Differences are likely attributable to differences in the work environment rather than to gender itself. For instance, the ‘Low process-focused profile’ not only comprised the highest proportion of women but also had the highest proportion of public sector employees and many shift workers. In this, our findings mirror the strongly gender-segregated Swedish labour market, with women mainly working in education, human service occupations, and health care (often requiring shift work) in the public sector. Generally, the public sector in Sweden is marked by low job security, poor career possibilities, little autonomy, and lower salaries (Furåker 2000), which may explain low levels of perceived justice and especially procedural justice.
The results of our study suggest that, for many in the public sector, features of organisational justice have been neglected – or at least perceived as such. A significant proportion of these workers feel not only that they are underpaid and have limited opportunities for career advancement, but also that processes are biased and unfair. Low levels of interpersonal and informational justice further indicate that employees rarely receive recognition or adequate information. While it may be challenging to match public sector wages with those in the private sector, relatively low-cost improvements – such as involving employees in decision-making, treating them with dignity and respect, and ensuring they have sufficient information – are possible. A shortage in professions mainly employed in the public sector, such as teachers and nurses, threatens the Swedish welfare system. To maintain a stable workforce in these sectors, organisations in the public sector must demonstrate appreciation through trust and fair treatment.
Interestingly, with the exception of gender composition, socio-economic status and publicly employed, the ‘Low process-focused’ and ‘Low justice’ profiles did not differ much in terms of demographic characteristics. Thus, our results could indicate that women indeed are more sensitive to procedural justice as suggested by Bell and Khoury (2016), as fair procedures may safeguard women in their career development and ensure that women are treated equitably within the workplace. However, there might be other, still unknown, work or organisational factors might explain the differences in justice perceptions.
Associations of Organisational Justice Profiles with Work and Health Outcomes
Generally, job satisfaction, turnover intentions, and self-rated general health followed the justice profiles, that is, lower levels of organisational justice associated with lower levels of general health and job satisfaction as well as higher levels of turnover intention.
Turning to differences between profiles, we found that the ‘Low justice profile’ showed the highest level of turnover intentions and also the lowest levels of general health and job satisfaction in both 2018 and 2020, although differences between profiles in regard to job satisfaction and general health disappeared when controlling for baseline levels. Remarkable is the decrease of turnover intentions and the increase in job satisfaction and general health in the ‘Low justice’ profile. Indeed, many in this profile might have realised their turnover intentions and moved to another job or left the labour market due to poor health. Such an assumption is supported by our attrition analyses, indicating higher turnover intentions and poorer health among those who dropped out between 2018 and 2020. Despite that, members of the ‘Low justice’ profile expressed significantly higher intentions to quit also after controlling for baseline levels. In contrast, the ‘High justice’ profile was characterised by the highest levels of general health and job satisfaction, as well as lowest levels of intentions to leave at baseline as also two years later. While the differences to the ‘Low process-focussed’ profile and the ‘Average justice’ profile did not reach statistical significance after controlling for baseline levels, our findings support earlier research that showed both cross-sectional and longitudinal associations between organisational justice and health, turnover intentions and job satisfaction (Eib, Leineweber & Bernhard-Oettel, 2021; Leineweber et al. 2020; Mengstie 2020).
Interestingly, while the ‘Low process-focused justice’ profile showed very low levels of procedural justice and rather low levels of overall justice, job satisfaction was slightly higher as compared to the ‘Average justice’ profile in 2018. Thus, our results are, at least partly, in accordance with the two-factor model (Folger & Konovsky 1989) that proposes that outcome-focussed justice (i.e., distributive and interpersonal) exert greater influence on person-related outcomes (i.e., job satisfaction and turnover) than process-focussed justice. However, in 2020 the two profiles did not longer differ in regard to job satisfaction and overall, these to profiles are very similar in regard to turnover intentions and general health.
Practical Implications
Our findings suggest that different dimensions of organizational justice tend to cluster together, often culminating in a profile marked by consistently low levels of justice across all measured aspects. This low-justice profile is particularly common among employees in the public sector, many of whom work in healthcare, education, and social services – fields of critical societal importance, encompassing roles such as nurses, teachers, and police officers.
These findings have significant implications for interventions aimed at promoting workplace justice. Importantly, the sectors represented in this profile are predominantly staffed by women, reflecting persistent gender segregation in the labour market. This structural context helps to explain the observed gender differences: women not only face greater challenges in balancing work and family life but are also more likely to be employed in sectors characterised by lower organizational justice and heightened health risks.
Although the group reporting uniformly low organizational justice comprises only 12% of the study population, it nevertheless includes a large number of individuals in key public service roles. These professions are already struggling to attract new entrants, and severe staffing shortages are projected in the near future (Socialstyrelsen 2023). Such shortages pose a serious threat to the sustainability of the Swedish welfare model and mirror wider challenges faced by many Western societies. A stable, motivated workforce in education and healthcare is essential to societal well-being. Our results underscore the need to cultivate fair and supportive working environments – marked by adequate compensation, transparent communication, inclusive decision-making, and respectful interpersonal treatment – as a strategy to both retain current employees and attract new talent to these vital sectors.
Strengths and Limitations
This study is based on a large sample, at start approximately representative of the Swedish working population. However, related to dropouts and ageing, the mean age for the current study was rather high. As older employees have been found to report higher levels of perceived organizational justice (Brienza & Bobocel 2017), the overall level of organizational might be somewhat elevated in our study. Also, generalisability to younger or non-Swedish populations might be limited, as it has been shown that the importance of different types of justice vary across cultural contexts (Fischer et al. 2011). Another strength of the study is that we were able to cover all five dimensions of organisational justice, though with some shortcomings. Items to measure interpersonal and informational justice were drawn from a scale originally developed to measure leadership (Setterlind & Larsson 1995). However, we could previously show that a two-factor model with correlated latent variables provided good fit and reflects the scales of interpersonal and informational justice (Leineweber et al. 2017). Also, distributive justice was derived from effort-reward imbalance. It has been suggested that ERI is a concept related but distinct from distributive justice (Siegrist 2017). Still, in epidemiological research, ERI is a commonly used measure of distributive justice (Ferrie et al. 2006) and also conceptually the measures have much in common (Greenberg 2010). Further, it would be of added value to be able to have all measures of justice referring to one source, such as the supervisor or organisation, in order to separate justice aspect from its source. What regard our dependent variables, all were measured by single items. While it has long be argued that the use multiple-indicator measurement scales provide generally better and more robust measures (Sverke, Hellgren & Naswall 2002), later research has shown that it is possible to develop measures that accurately and reliably represents a given construct (Matthews, Pineault & Hong 2022). Another shortcoming, from a technical point of view, is the lack of a robust measure for selecting the optimal number of profiles. Some of the measures have been criticised to over or underestimate the number of profiles and the need to adopt a pragmatic solution has also been acknowledged (Francis, Elliott & Weldon 2016). Here, we combined a variety of measures in order to select a reasonable solution about the number of profiles. Finally, answers from the participants in the wave 2020, were obtained at the start of the corona pandemic and answers especially on self-rated health might have been influenced by that.
Conclusions
This is one of the first studies that uses a person-centred approach in order to identify distinct profiles of organisational justice, based on five different aspects, namely distributive, procedural, interpersonal, informational and overall justice. The results indicate the complexity of the concept of organisational justice. They also suggest that analysing separate dimensions of justice or average trends may hide distinct groups of employees with low justice patterns. Using a person-centred approach, we could identify profiles that would have remained hidden with a variable-centred approach. To summarise, this study highlights the need to investigate justice profiles rather than separate dimensions in order to identify groups of workers that fare worse, to better understand their reactions, and to pinpoint groups of employees that may benefit the most from specific interventions.
Data Accessibility Statement
Given restrictions from the ethical review board and considering that sensitive personal data are handled, it is not possible to make the data freely available. Access to the data may be provided to other researchers in line with Swedish law and after consultation with the Stockholm University legal department. Requests for data, stored at the Stress Research Institute, Department of Psychology, should be sent to registrator@su.se with reference to ‘Patterns of Organisational Justice among Swedish Employees’ or directly to the corresponding author.
Appendices
Web Appendix – Patterns of Organisational Justice among Swedish Employees: Results from a Latent Profile Analysis
Non-response analyses
A non-response analyses showed that non-responders were slightly older (F(1 9476) = 96.51, p < 0.001), more often men (χ2(1) = 7.78, p < 0.01), had less often upper secondary education (χ2(1) = 56.68, p < 0.001), more often low SES (χ2(1) = 50.40, p < 0.001), and worked more often part-time (χ2(1) = 56.45, p < 0.001). Also, in 2018, those who dropped out indicated having higher turnover intentions (F(1 9432) = 7.07, p < 0.01) and lower levels of general health (F(1 9433) = 22.31, p < 0.001). No statistically significant differences were found regarding shift work (χ2(1) = 5.83, p = 0.02), employer (χ2(1) = 3.32, p = 0.07) and work satisfaction in 2018 (F(1 9407) = 5.67, p = 0.02).
Confirmatory Factor Analyses of Organisational Justice Measures
In a first model (Model 1), we let all items load onto a single common factor. In a second model (Model 2), we investigated a 4-factor model (overall justice, procedural justice, effort-reward imbalance, interactional justice), where effort and reward loaded onto a second-order factor (ERI). All factors were allowed to correlate freely. Next (Model 3), we also separated interactional justice into two dimensions, namely interpersonal and informational justice, so that Model 3 consisted of 5-factor model (overall justice, procedural justice, effort-reward imbalance (measured by the latent constructs effort and reward), interpersonal and informational justice) with free correlations between factors. In a final step (Model 4), we regressed all five organizational justice factors from Model 4 onto a second-order factor g. Results from confirmatory factor analyses are presented in appendix-table A1, showing that Model 3 fitted the data best.
Appendix-Table A1
Results from confirmatory factor analyses comparing the factorial structure of organisational justice measures.
| CHI-SQ, DF | CFI | RMSEA | SMRM | ΔMODEL | Δχ2 (p) | Δ df | |
|---|---|---|---|---|---|---|---|
| Model 1 | 59820.621, 405 | 0.623 | 0.124 | 0.091 | |||
| Model 2 | 15152.651, 397 | 0.906 | 0.063 | 0.048 | 44668 | <0.00001 | 8 |
| Model 3 | 13533.882, 393 | 0.917 | 0.059 | 0.046 | 1619 | <0.00001 | 4 |
| Model 4 | 16361.319, 398 | 0.899 | 0.065 | 0.067 | 2827 | <0.00001 | 5 |
[i] NOTE: Model 1: all items load on one common factor, Model 2: overall justice, procedural justice, interactional justice, effort-reward imbalance (with the two factors effort and reward), all factors correlate freely; Model 3: as Model 2 separating interactional justice into interpersonal justice and informational justice; Model 4: factors as in Model 3, all factors load on one common factor g.
Appendix-Table A2
Correlations between the different justice measures. Means and standard deviations presented in diagonals (n = 9,478).
| RANGE | 1. | 2. | 3. | 4. | 5. | 6. | 7. | 8. | 9. | 10. | 11. | 12. | 13. | 14. | 15. | 16. | 17. | ||
|---|---|---|---|---|---|---|---|---|---|---|---|---|---|---|---|---|---|---|---|
| 1. Overall justice | 1–7 | 5.25 ± 1.20 | |||||||||||||||||
| 2. Procedural justice | 1–6 | 0.66 | 3.16 ± 0.96 | ||||||||||||||||
| 3. Distributive injustice (ERI) | 0.25–3.99 | –0.50 | –0.42 | 1.07 ± 0.42 | |||||||||||||||
| 4. Interpersonal justice | 1–4 | 0.50 | 0.45 | –0.44 | 3.07 ± 0.75 | ||||||||||||||
| 5. Informational justice | 1–4 | 0.47 | 0.47 | –0.37 | 0.71 | 3.32 ± 0.63 | |||||||||||||
| 6. Sex (female) | 0 vs1 | –0.06 | –0.03 | 0.11 | 0.04 | 0.06 | 0.59 ± 0.49 | ||||||||||||
| 7. Age | 24–79 | –0.05 | 0.02 | –0.04 | –0.03 | 0.07 | –0.03 | 52.22 ± 9.22 | |||||||||||
| 8. Education | 0 vs1 | 0.08 | 0.00n.s. | –0.00n.s. | 0.05 | –0.01n.s. | 0.12 | –0.17 | 0.58 ± 0.49 | ||||||||||
| 9. Low SES | 0 vs 1 | –0.13 | –0.06 | 0.01n.s. | –0.09 | –0.02n.s. | –0.05 | 0.11 | –0.61 | 0.38 ± 0.48 | |||||||||
| 10. Part-time work | 0 vs1 | –0.02n.s. | –0.03 | –0.00n.s. | –0.01 | 0.01n.s. | 0.24 | 0.06 | 0.00n.s. | 0.06 | 0.22 ± 0.41 | ||||||||
| 11. Shift work | 0 vs1 | –0.15 | –0.12 | 0.08 | –0.10 | –0.02n.s. | 0.04 | 0.02n.s. | –0.20 | 0.32 | 0.13 | 0.16 ± 0.36 | |||||||
| 12. Private employer | 0 vs1 | 0.11 | 0.09 | –0.08 | –0.01n.s. | –0.05 | –0.34 | –0.11 | –0.20 | 0.14 | –0.14 | –0.07 | 0.47 ± 0.50 | ||||||
| 13. Intentions to leave 2018 | 1–5 | –0.40 | –0.35 | 0.46 | –0.37 | –0.36 | 0.02n.s. | –0.10 | 0.04 | –0.00n.s. | 0.00n.s. | 0.04 | 0.02n.s. | 1.91 ± 1.24 | |||||
| 14. Intentions to leave 2020 | 1–5 | –0.22 | –0.21 | 0.23 | –0.18 | –0.20 | 0.00n.s. | –0.09 | 0.03n.s. | –0.00n.s. | 0.00n.s. | –0.00n.s. | –0.00n.s. | 0.34 | 1.74 ± 1.14 | ||||
| 15. Job satisfaction 2018 | 1–8 | 0.50 | 0.42 | –0.50 | 0.46 | 0.42 | 0.01n.s. | 0.05 | 0.01n.s. | –0.06 | –.01n.s. | –0.06 | –.02n.s. | –0.60 | –0.30 | 5.98 ± 10.49 | |||
| 16. Job satisfaction 2020 | 1–8 | 0.32 | 0.29 | –0.31 | 0.26 | 0.26 | 0.01n.s. | 0.06 | 0.02n.s. | –0.08 | –0.01n.s. | –0.05 | –0.00n.s. | –0.32 | –0.58 | 0.50 | 6.21 ± 1.38 | ||
| 17. General health 2018 | 1–5 | 0.22 | 0.18 | –0.26 | 0.17 | 0.16 | 0.00n.s. | –0.01n.s. | 0.06 | –0.08 | –0.07 | –0.04 | 0.00n.s. | –0.20 | –0.16 | 0.32 | 0.26 | 3.96 ± .80 | |
| 18. General health 2020 | 1–5 | 0.17 | 0.14 | –0.18 | 0.12 | 0.12 | 0.02n.s. | 0.00n.s. | 0.08 | –0.09 | –0.04 | –0.04 | 0.00n.s. | –0.11 | –0.16 | 0.21 | .30 | 0.60 | 4.02 ± .79 |
[i] NOTE: The diagonals show means and standard deviations. All correlations are significant on p < 0.01 level if not otherwise indicated, n.s. indicates p > 0.01.
Appendix Figure F1
Elbow plot of the bayesian information criterion (BIC).
Acknowledgements
We would like to thank docent Robin Högnäs for her valuable assistance in proofreading and language editing of this manuscript.
Competing Interests
The authors have no competing interests to declare.
Author Contributions
All authors contributed to the design of the study, the interpretation of the results and revised the manuscript critically for important intellectual content. CL has contributed to the data collection, was responsible for the statistical analysis and responsible for drafting the manuscript. All authors contributed to the manuscript and read and approved the final manuscript.