
Table 1
Initial programme theory.
| CONTEXT | MECHANISMS | OUTCOME |
|---|---|---|
| Motivation Supervisors are likely to reflect on their own approach and attitudes, skills and pitfalls/shortcomings through self-assessment, leading to increased motivation (awareness, motivation) And gain insights into their own performance that gives self-confidence or area for improvement (self-efficacy) | Improving their supportive behaviour, through supportive actions |
| Skills They reach out to the OHP expert directly, especially when they had positive experience with the OHP in the past and when they experience a trustful relationship with OHP They feel supported not being alone in this, sharing experiences with the expert and co-supervisors (social influence), that gives room for discussion but with a systematic, evidence-based tool, so they know the given actions on how to support from the guideline (practical skills) | Improving their supportive behaviour, through supportive actions |
[i] General circumstances: The intervention (guideline and coaching sessions) is implemented in circumstances where there is/are: (1) A safe culture for sparring with OHP, (2) not being assessed on sick leave numbers in job performance as supervisor, and/or (3) facilitated by organisation to invest in mental health of team members.
Table 2
Baseline characteristics of study population (n = 92).
| PERSONAL CHARACTERISTICS OF SUPERVISOR | N | % |
|---|---|---|
| Gender | ||
| Female | 57 | 62.0 |
| Male | 35 | 38.0 |
| Age | ||
| 18–29 years | 5 | 5.4 |
| 30–39 years | 20 | 21.7 |
| 40–49 years | 27 | 29.3 |
| 50–59 years | 34 | 37.0 |
| 60–67 years | 6 | 6.5 |
| Sector | ||
| Health care | 37 | 40.2 |
| Public administration | 21 | 22.8 |
| Business services | 13 | 14.1 |
| Other* | 21 | 22.9 |
| Size of organisation | ||
| Small (10–49) | 2 | 2.2 |
| Medium (50–249) | 16 | 17.4 |
| Large (250 and more) | 73 | 79.3 |
| Supervisory experience, in years | ||
| 0–1 | 7 | 7.6 |
| 2–5 | 26 | 28.3 |
| 6–10 | 18 | 19.6 |
| >10 | 41 | 44.6 |
| Number of supervised employees (M (range), SD) | 66 (4–700) | 93 |
| Educational level of supervised employees | ||
| Low | 9 | 9.8 |
| Medium | 42 | 45.7 |
| High | 41 | 44.6 |
| Dealt with CMHP personally | ||
| Not (rarely, never) | 46 | 50.0 |
| Yes (often, regularly, sometimes) | 46 | 50.0 |
| Dealt with CMHP at work | ||
| Not (sometimes, rarely, never) | 39 | 42.4 |
| Yes (often, regularly) | 53 | 57.6 |
| Being assessed on sick leave number | ||
| No | 40 | 43.5 |
| Yes | 52 | 56.5 |
| Followed course in last 5 year about this topic (at t1) | ||
| No | 23 | 25.0 |
| Yes | 42 | 45.7 |
| Organizational characteristics | ||
| Organizational support (neutral = 1 – totally agree = 3) (M, SD) | 2.18 | 0.59 |
| Learning climate: organisation facilitates learning (at t1, n = 65, M, SD) | 4.11 | 0.81 |
| Learning climate: error avoidance (at t1, n = 65, M, SD) | 2.63 | 0.76 |
| Intervention characteristic | ||
| Previous collaboration between OHP and supervisor | ||
| No | 50 | 54.3 |
| Yes | 42 | 45.7 |
| Frequency sparring with an OHP | ||
| Never/seldom | 10 | 10.9 |
| Regularly | 42 | 45.7 |
| Often/always | 40 | 43.5 |
| Coaching received in group/individually | ||
| Group | 39 | 42.4 |
| Individually | 24 | 26.1 |
| Both | 29 | 31.5 |
[i] *Agriculture, industry, construction, trade, transport, hospitality, IT, education, culture sports, and recreation.
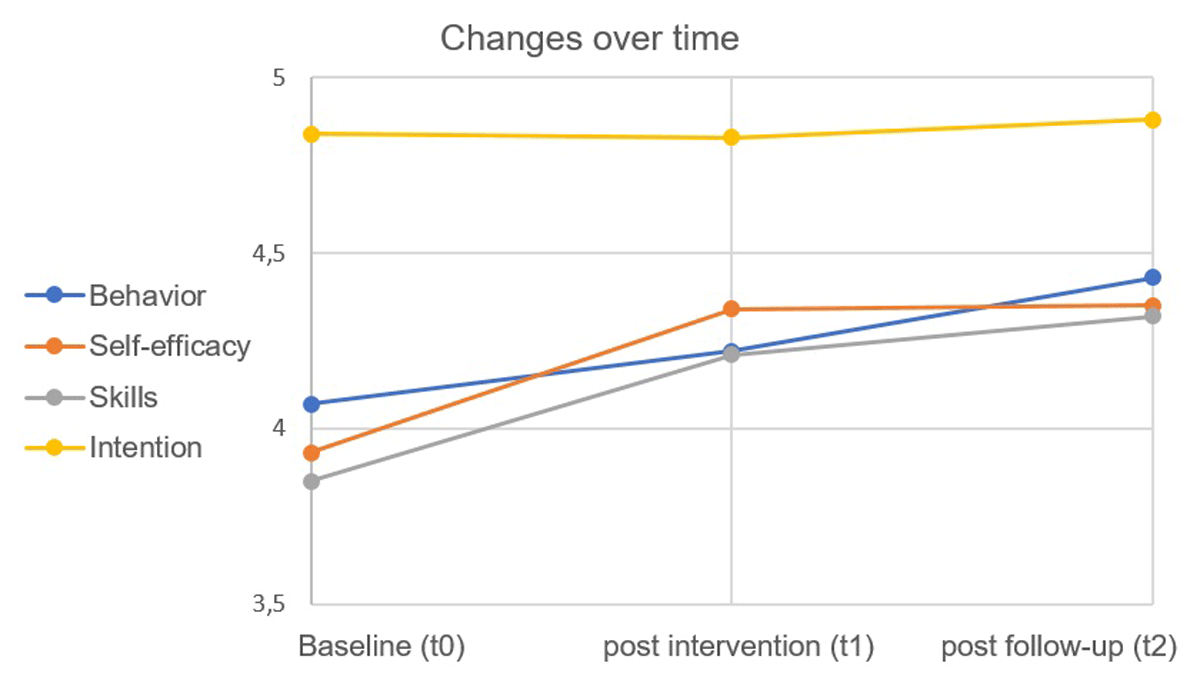
Figure 1
Changes over time, based on mean scores.
Table 3
Means of difference scores (standard deviations, confidence intervals t-value) and correlations post-intervention (t1, n = 65) and post-follow-up period (t2, n = 56) compared to baseline (t0).
| Mb | SD | CI | t | BEHAVIOUR t0–t1c | BEHAVIOUR t0–t2 | ||
|---|---|---|---|---|---|---|---|
| LOWER | UPPER | ||||||
| Outcomes | |||||||
| Behaviour t0–t1 | 0.15 | 0.68 | –0.02 | 0.32 | 1.77 | 1 | |
| Behaviour t0–t2 | 0.33** | 0.63 | 0.17 | 0.50 | 3.98 | 0.68** | 1 |
| Behavioural determinants | |||||||
| Self-efficacy t0–t1 | 0.36** | 0.50 | 0.23 | 0.49 | 5.73 | 0.27* | 0.20 |
| Self-efficacy t0–t2 | 0.42** | 0.54 | 0.28 | 0.56 | 5.84 | 0.25 | 0.34* |
| Skills t0–t1 | 0.29** | 0.43 | 0.18 | 0.40 | 5.37 | 0.19 | 0.13 |
| Skills t0–t2 | 0.41** | 0.48 | 0.28 | 0.54 | 6.33 | 0.20 | 0.22 |
| Intention t0–t1 | 0.01 | 0.42 | –0.10 | 0.11 | 0.15 | 0.14 | 0.10 |
| Intention t0–t2 | 0.07 | 0.40 | –0.04 | 0.18 | 1.34 | 0.24 | 0.09 |
| Personal characteristics | |||||||
| Dealt with CMHP personally | 0.15 | 0.13 | |||||
| Dealt with CMHP at work | –0.18 | –0.25 | |||||
| Being assessed on sick leave number | –0.22 | –0.14 | |||||
| Followed a course on the topic | 0.01 | –0.25 | |||||
| Organizational characteristics | |||||||
| Learning climate: individual error avoidance | 0.10 | 0.05 | |||||
| Organisational support | –0.22 | –0.17 | |||||
| Intervention characteristics | |||||||
| Previous collaboration between OHP and supervisor | 0.33** | 0.15 | |||||
[i] *Significant at the 0.05 level (two-tailed). **Significant at the 0.01 level (two-tailed).
aCompared difference with t0, bM, mean difference, cPearson Correlation, SD, standard deviation, CI, 95% confidence interval of the difference.
Correlations for all covariates included in the study can be found in Appendix 2.
Table 4
Results of stepwise backward regression analysis of supervisor characteristics and circumstances on change in supportive behaviour (n = 56).
| VARIABLE | BEHAVIOUR POST-INTERVENTION (t0–t1) | BEHAVIOUR POST-FOLLOW-UP (t0–t2) | ||||
|---|---|---|---|---|---|---|
| b-COEFFICIENT | t | STANDARDISED COEFFICIENTS (β) | b-COEFFICIENT | t | STANDARDISED COEFFICIENTS (β) | |
| (Constant)/intercept | 0.13 | 0.34 | 0.12 | 0.28 | ||
| Learning climate: error avoidance | 0.19 | 1.74 | 0.22 | 0.25 | 1.91 | 0.29 |
| Previous collaboration between OHP and supervisor | –0.35* | –2.26 | –0.26 | –0.20 | –1.12 | –0.15 |
| Self-efficacy t0–t1 difference | 0.43* | 2.71 | 0.32 | 0.38* | 2.09 | 0.29 |
| Followed course in last 5 years on topic | –0.04 | –0.19 | –0.02 | –0.53* | –2.40 | –0.38 |
| Being assessed on sick leave number | –0.44* | –2.68 | –0.33 | –0.28 | –1.34 | –0.20 |
| Dealt with CMHP personally | 0.32 | 1.97 | 0.24 | 0.45* | 2.26 | 0.34 |
[i] *Significant at p = 0.05.
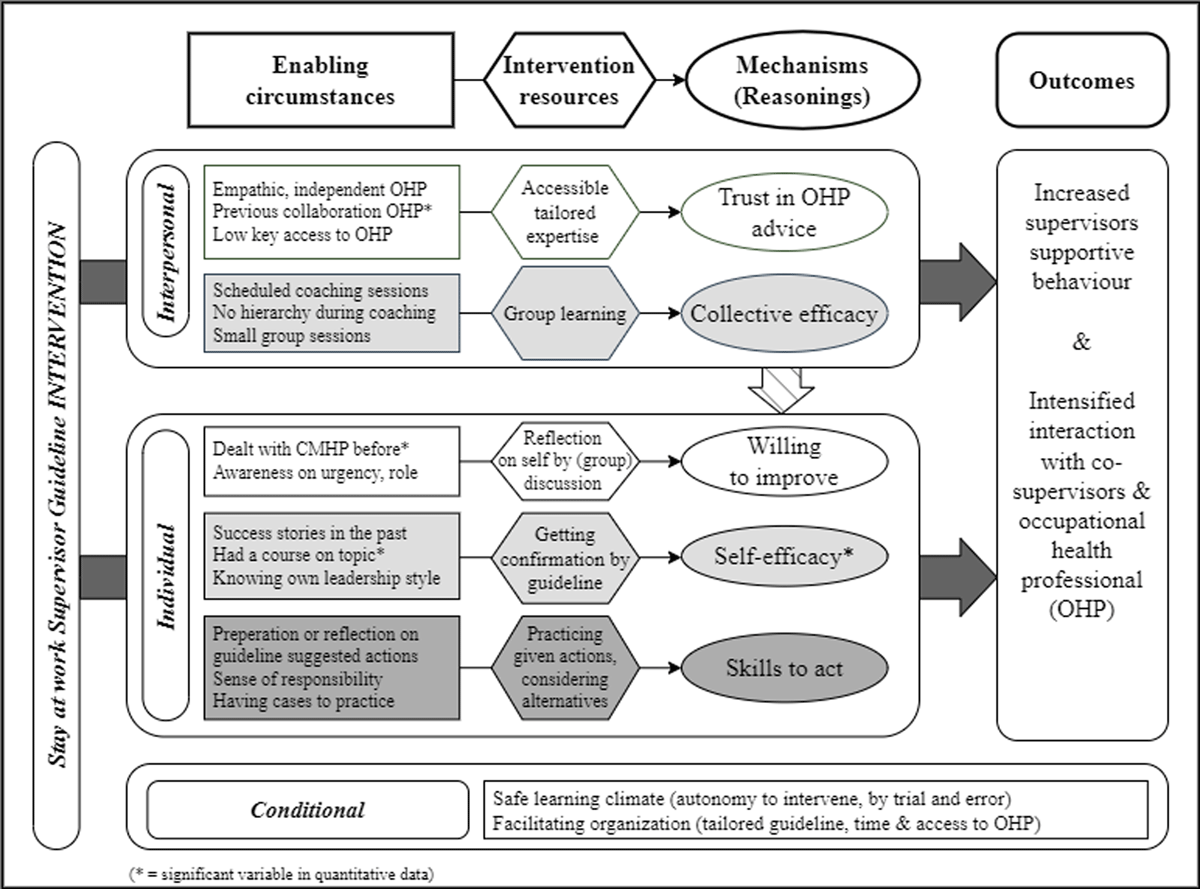
Figure 2
Enabling circumstances, triggering mechanisms (intervention resources and reasonings), leading to outcomes during the SAW-SG Intervention.