
Introduction
As societies become more individualized, employees increasingly seek to adapt their working conditions to their individual needs and take more proactive roles in the design of their work (Bal & Lub, 2015; Oldham & Hackman, 2010). This is in line with the Theory of Work Adjustment suggesting that employees adjust their work to achieve a correspondence between individual and environmental requirements (Dawis & Lofquist, 1984). The concept of needs-supplies fit, which is largely built on the Theory of Work Adjustment, refers to the fit between individuals’ needs, preferences, and abilities, and the resources and opportunities provided by an organization (Kristof-Brown et al., 2005). The concept posits that individuals are more likely to feel fulfilled and satisfied in their jobs when their needs are met by an organization (Edwards, 1991; Kristof, 1996; Van Vianen, 2018). One way for employees to customize their working conditions and thus achieve needs-supplies fit is to negotiate personalized arrangements—that is, idiosyncratic deals (i-deals)—with their employers (Rousseau, 2005). Employers grant such i-deals to attract, motivate, and retain employees who are valuable to the organization (Guerrero et al., 2014).
Extensive research has shown that i-deals positively relate to a wide array of employee attitudes and behaviors, including affective commitment (e.g., Guerrero et al., 2014; Rofcanin et al., 2016), work engagement (e.g., Hornung et al., 2011; Tang & Hornung, 2015), organizational citizenship behavior (e.g., Rofcanin et al., 2016; Singh & Vidyarthi, 2018), and voice behavior (e.g., Ng & Feldman, 2015; Ng & Lucianetti, 2016). In contrast, individual-level antecedents of i-deals have received comparatively little attention in research, including how dispositional factors such as individual needs relate to i-deals (Liao et al., 2016). Therefore, the question concerning what drives employees to adapt their work environment by seeking i-deals remains largely unclear. Although i-deals are typically conceptualized as satisfying employees’ needs, research on the relationship between individual needs and i-deals is “underspecified and underproblematized” (Conway & Coyle-Shapiro, 2016, p. 57). This research gap is problematic because it remains unclear why some employees are more inclined to negotiate i-deals than others, and how employees’ experiences of i-deals, such as the value they attach to certain types of i-deals, differ depending on their individual needs (Bal, 2017; Bal & Vossaert, 2019). Since i-deals are understood as a way for employees to adapt their working conditions to their individual needs (Simosi et al., 2023), it is important to gain more accurate insights into employees’ needs as dispositional sources driving their behavior.
So far, individual needs, as conceptualized by McClelland (1987), have been investigated in isolation using variable-centered approaches (e.g., Barrick et al., 2002; Engeser & Langens, 2010; Halbesleben & Bowler, 2007; Ng & Lucianetti, 2016). These approaches “break down the complex reality into separate variables” (Van den Broeck et al., 2013, p. 70), testing the relationships of each individual need with other variables. Hence, variable-centered approaches do not sufficiently take into consideration that individuals are not driven only by a single need but by the simultaneous occurrence of multiple needs (Chen et al., 2017; Moran et al., 2012; Tóth-Király et al., 2021). To gain more accurate insights, an investigation that uses a person-centered approach is needed, as it considers distinct combinations of individual needs existing among employees, that is, profiles, and analyzes how these profiles are differentially related to outcomes, such as the successful negotiation of i-deals (Hofmans et al., 2020; Morin et al., 2017). Prior studies adopting person-centered approaches to the study of employees’ motivation have provided differentiated insights into how motivational profiles relate to employee outcomes (e.g., Chen et al., 2017; Moran et al., 2012; Van den Broeck et al., 2013). Accordingly, a person-centered approach to the study of individual needs, as conceptualized by McClelland (1987), can help to gain a deeper understanding of the relationship between employees’ individual needs and i-deals.
Against this background, our study seeks to determine how combinations of individual needs form different profiles and how these profiles relate to the successful negotiation of different types of i-deals. We proceed as follows: First, we outline the theoretical background and develop two research questions. The first research question addresses the extent to which McClelland’s (1987) taxonomy of needs (need for achievement, need for power, need for affiliation, and need for autonomy) can be explored using a profile approach. The second research question explores how the membership in different profiles of individual needs relates to the successful negotiation of different types of i-deals. Then, in the first of two studies, we examine the first research question empirically using latent profile analysis to explore profiles of individual needs. In the second study, we again use latent profile analysis to identify profiles of individual needs in a larger sample of employees from various industries and occupational groups and examine the second research question by testing differences in the successful negotiation of i-deals across the profiles. Finally, we discuss the implications of our overall findings and point out the study’s limitations, as well as opportunities for future research.
Theoretical Background and Development of Research Questions
A needs-supplies fit perspective on i-deals
I-deals are defined as “personalized agreements of a nonstandard nature negotiated between individual employees and their employers regarding terms that benefit each party” (Rousseau et al., 2006, p. 978). Employees negotiate i-deals to adapt their working conditions to their individual needs and preferences, and employers grant those requests to attract, motivate, and retain valuable employees (Rousseau, 2005). Researchers have emphasized a link between i-deals and the person-environment literature (e.g., Van Vianen, 2018; Vleugels et al., 2022), as they are considered an important tool to meet the specific needs of individual employees, thus achieving needs-supplies fit (Bakker & Ererdi, 2022).
Broadly defined, person-environment fit is “the compatibility between an individual and a work environment that occurs when their characteristics are well matched” (Kristof-Brown et al., 2005, p. 281). In this regard, different types of fit, such as person-organization fit, person-vocation fit, person-group fit, person-supervisor fit, and person-job fit have emerged that emphasize different person and environment attributes. Whereas person-vocation fit and person-job fit represent complementary types of fit (degree to which an individual’s attributes align with and complement the demands and requirements of the environment), the other types of fit are conceived as supplementary fits (degree to which individual and organizational attributes are similar) (Muchinsky & Monahan, 1987).
Person-job fit has been identified as a particularly strong predictor of employees’ job-related attitudes such as job satisfaction, organizational commitment, and job strain (Kristof-Brown et al., 2005; Van Vianen, 2018). In his conceptualization of person-job fit, Edwards (1991) differentiates between two forms, namely demands-abilities fit, referring to the fit between an individual’s knowledge and skills and the job’s requirements, and needs-supplies fit, which is defined as the compatibility between an employee’s needs, desires, or preferences and the resources and rewards provided by the job (Kristof-Brown et al., 2005).
As suggested by Bakker and Ererdi (2022), person-job fit, and especially the needs-supplies fit perspective, can help to explain and understand the motivation for negotiating and granting i-deals. Having access to tailored benefits, such as i-deals, can enhance the fit between an individual and the job. When employees receive benefits that match their individual needs and preferences, they are more likely to feel satisfied and engaged in their work, which can improve their job performance and increase their commitment to the organization (Bakker & Ererdi, 2022; Kristof-Brown et al., 2005).
Profiles of individual needs
For decades, organizational psychology researchers have sought to explain what drives employees to show certain attitudes and behaviors. Various streams in this research area have developed, including content-based approaches, context-based approaches, and process-based approaches (Kanfer et al., 2017; Steers et al., 2004). A prominent focus has been on content-based approaches studying individual needs, referred to as internal tensions that influence individuals’ cognitive processes (Kanfer, 1990). These content-based approaches conceptualize individual needs as personality dispositions, that is, stable characteristics that drive human behavior (Kanfer et al., 2017).
Murray’s (1938) pioneering work on needs and McClelland’s (1987) conceptualization of need theory have spurred research on differences between individuals’ needs. Need theory suggests that individuals’ needs at work can be classified into the basic needs for achievement (mastering challenging tasks to grow at work), power (influencing and dominating others at the workplace), affiliation (obtaining acceptance in the workgroup and having close and harmonious relationships with others), and autonomy (being self-directed, rather than being directed by others) (Heckert et al., 2000; Kanfer et al., 2017; Steers et al., 2004). Although, at first glance, it appears that need theory neglects the need for autonomy, a closer examination reveals that autonomy is considered as a basic need in early conceptualizations of need theory: Murray (1938) defines the need for autonomy as a desire “to resist influence or coercion. To defy an authority or seek freedom in a new place. To strive for independence” (p. 82). Building on this, McClelland (1987) distinguishes “power over oneself” (a drive to control one’s own actions) from “power over others” (a drive to compel others). The classification of the individual needs for achievement, power, affiliation, and autonomy provides valuable insights into the complexities of human motivation and has been supported by empirical studies across various contexts, such as work environments, educational settings, or social interactions (e.g., Fagenson, 1992; Friedman & Mandel, 2011; Taormina, 2009).
The four needs can be either implicit (subconsciously aroused) or explicit (consciously aroused) (McClelland et al., 1989), where the former lead to affective preferences and behavioral impulses, and the latter determine cognitive choices and are closely related to the development of individual goals (Kehr, 2004). Needs are not mutually exclusive, but instead individuals are driven by the simultaneous occurrence of multiple needs (Chen et al., 2017; Moran et al., 2012). In addition, the importance of a particular need varies between individuals (McClelland, 1987).
Although the conceptualization of individual needs suggests that the combination of individuals’ needs drives their behavior, prior studies have mainly investigated individual needs in isolation using variable-centered approaches. These studies have examined the relationship between certain needs and other variables, either focusing on a single need or analyzing it in the presence of other needs (e.g., Barrick et al., 2002; Halbesleben & Bowler, 2007; Ng & Lucianetti, 2016). As a result, little is known about the co-occurrence of the needs for achievement, power, affiliation, and autonomy and the role of their interplay in employees’ attitudes and behaviors. Therefore, we introduce a person-centered approach to analyze combinations of individual needs. According to Gabriel et al. (2015, p. 865), “person-centered approaches allow researchers to understand how variables operate conjointly and within people.” These approaches suggest that individuals in a population are members of homogeneous subgroups that can be represented by profiles (Morin et al., 2017). By shifting the attention from a focus on variables to a focus on individuals, person-centered approaches pay more attention to how combinations of variables occur in subgroups and how these variables conjointly shape behavior (Hofmans et al., 2020).
Based on prior research, we expect individuals to differ in the degree to which they are driven by needs, resulting in weak, moderate, and strong profiles of individual needs. In other words, we anticipate quantitative differences among the profiles. This can be expected because previous studies that have analyzed motivational profiles revealed that individuals differ in their overall levels of motivation (e.g., Moran et al., 2012; Tóth-Király et al., 2021; Van den Broeck et al., 2013). In addition, we anticipate to identify profiles that differ qualitatively by reflecting individuals who are driven primarily by a certain need or a combination of certain needs that are in contrast to other profiles. This is in line with previous studies dealing with combinations of individual needs, as conceptualized by McClelland (1987). For example, studies conducted among Swedish managers revealed that the majority was primarily driven by a certain need that was more dominant than the other needs (Andersen, 2010, 2018). Another study focusing on accountants yielded that the need for achievement was the dominant need among this occupational group (Street & Bishop, 1991). Above that, in several studies, the needs for achievement and power are highly correlated with each other, indicating that they often tend to co-occur (e.g., Barrick et al., 2002; Duffy & Lilly, 2013; Taormina, 2009). Against this background, the first research question (RQ1) is:
RQ1: Do distinct profiles of individual needs (i.e., achievement, power, affiliation, and autonomy) exist that vary quantitatively and qualitatively?
I-deals as outcomes of profiles of individual needs
As i-deals differ in terms of their content (Rousseau et al., 2006), studies have identified five major types of i-deals: development i-deals (personalized development opportunities), task i-deals (individually desirable tasks), scheduling flexibility i-deals (customized work schedules), location flexibility i-deals (locally flexible work arrangements), and financial i-deals (personalized financial arrangements) (Hornung et al., 2014; Rosen et al., 2013). Whereas research on outcomes of i-deals on the individual level flourished during the last decade, individual-level antecedents of i-deals have received little attention. However, some studies have identified characteristics and behaviors of employees that influence the extent to which they seek and obtain i-deals (Liao et al., 2016). For instance, Hornung et al. (2008) and Tang and Hornung (2015) found a positive relationship between employees’ personal initiative and the successful negotiation of development i-deals, and Rosen et al. (2013) found that employees’ political skills positively relate to the successful negotiation of location flexibility i-deals.
With regard to personality dispositions, Ng and Lucianetti (2016) investigated the extent to which individual needs relate to i-deals using a variable-centered approach. They found positive relationships between the needs for achievement and power and employees’ perceptions of their own i-deals. Given those results, we contend that employees’ combinations of individual needs influence the extent to which they negotiate and obtain certain types of i-deals. For example, employees showing a combination of high levels of the needs for achievement and power might seek development and task i-deals to enhance certain skills and grow in the organization (Bal & Vossaert, 2019; Ng & Lucianetti, 2016) or financial i-deals because they feel entitled to special financial arrangements (Bal, 2017). In contrast, employees who have high levels of the need for affiliation in combination with low levels of the needs for autonomy and power might refrain from negotiating any type of i-deal because they worry that individual treatment will upset their colleagues (Ng & Lucianetti, 2016). In addition, employees showing a combination of high levels of the needs for autonomy and achievement might seek flexibility-related i-deals, as they want to be free to work anytime and anywhere to enhance their work-life balance and/or productivity (Bal, 2017; Bal & Vossaert, 2019). Accordingly, the second research question (RQ2) is:
RQ2: How does the membership in profiles of individual needs relate to different types of i-deals successfully negotiated by employees?
Study 1: Identifying profiles of individual needs
Sample
Data were collected using an online survey that was fielded between August and September 2020. The survey targeted employees with any length of work experience, and in any industry. Participants were recruited via snowball sampling by distributing the survey among professionals on German professional networking platforms (e.g., LinkedIn, Xing). In line with the Helsinki Declaration, the voluntary nature of participation and the anonymity of the data was assured. Completing the questionnaire took the participants an average of 8.26 minutes. A total of 171 employees completed the survey, among whom one participant was excluded for failing attention checks. Beyond that, we measured social desirability using a scale developed and validated by Satow (2012). This scale consists of two items that measure the potential influence of social-desirability bias with values between 2 and 10. Following Satow’s (2012) recommendation, we excluded six participants with values higher than 8, as these values indicate responses influenced by social-desirability bias. The final sample consisted of 164 employees. Of this final sample, 61.00 percent were women, and the average age was 33.71 years. The participants’ organizational tenure ranged from less than a year to 45 years, with an average of 6.34 years. 25.60 percent of the sample had leadership responsibility.
Measures
We measured individual needs using Heckert et al.’s (2000) Needs Assessment Questionnaire. The Needs Assessment Questionnaire has demonstrated better internal consistency than Steers and Braunstein’s (1976) Manifest Needs Questionnaire (Heckert et al., 2000; Lawrence & Jordan, 2009). As there is no validated German version of this scale yet, it was translated from English to German using a translation/back-translation procedure (Brislin, 1986). The measure consisted of 20 items covering four basic individual needs: the needs for achievement (e.g., “I try to perform my best at work”), power (e.g., “I seek an active role in the leadership of a group”), affiliation (e.g., “When I have a choice, I try to work in a group instead of by myself”), and autonomy (e.g., “In my work projects, I try to be my own boss”). Participants indicated for each item the extent to which the statements apply to themselves on a five-point scale. Confirmatory factor analysis (CFA) and content-related considerations resulted in the exclusion of five items (see the section including the analyses and results). Therefore, the final construct consisted of five items that measured the need for achievement (α = .83), four that measured the need for power (α = .81), two that measured the need for affiliation (ρ = .76), and four that measured the need for autonomy (α = .71) (the included and excluded items are given in full in the supplementary material).
We also collected data on four other variables providing important information about the sample: gender (0 = male, 1 = female), age, organizational tenure, and leadership responsibility (0 = no leadership responsibility, 1 = leadership responsibility). These variables were included because prior research suggests their potential relevance to employees’ individual needs and their negotiation of i-deals. For instance, research indicates that the need for affiliation tends to be more pronounced among women compared to men (Duncan & Peterson, 2010) and that the need for power is more dominant among leaders as opposed to individuals without leadership responsibility (Andersen, 2018). Furthermore, research on i-deals suggests, for example, that men are more likely than women to successfully negotiate financial i-deals (Ho & Tekleab, 2016) and that i-deals, in general, are more prevalent among younger employees compared to older employees (Liao et al., 2016). Another study has demonstrated a positive relationship between organizational tenure and the negotiation of i-deals, as employees with higher tenure typically possess greater negotiation power due to their specific human capital (Lee et al., 2015). Table 1 presents study 1’s descriptive statistics and correlations.
Table 1
Descriptive statistics and correlations (study 1).
| VARIABLE | M | SD | 1 | 2 | 3 | 4 | 5 | 6 | 7 | |
|---|---|---|---|---|---|---|---|---|---|---|
| 1 | achievement | 4.09 | .58 | |||||||
| 2 | power | 3.36 | .74 | .39*** | ||||||
| 3 | affiliation | 3.15 | .91 | .05 | .18* | |||||
| 4 | autonomy | 3.79 | .63 | .31*** | .40*** | –.16* | ||||
| 5 | gender | .61 | .52 | .06 | –.18* | –.05 | .03 | |||
| 6 | age | 33.71 | 10.60 | –.18* | –.12 | –.06 | –.05 | –.08 | ||
| 7 | tenure | 6.34 | 9.04 | –.27*** | –.20** | –.01 | –.17* | –.05 | .74*** | |
| 8 | leadership | .26 | .44 | .17* | .41*** | .09 | .14 | –.10 | .19* | .08 |
[i] Note: n = 164. Gender was coded as 0 = male, 1 = female. Leadership was coded as 0 = no leadership responsibility, 1 = leadership responsibility. * p < .05. ** p < .01. *** p < .001.
Analyses and results
Before conducting latent profile analysis, we tested the factorial structure of the measure used (Spurk et al., 2020). We assessed model fit using the comparative fit index (CFI), the Tucker-Lewis index (TLI), and the root mean square error of approximation (RMSEA). Values near and above .95 for CFI and TLI and below .08 for RMSEA indicate good model fit (Hu & Bentler, 1999). CFA of the first model tested indicated poor fit (χ2 (164) = 317.219, p < .001, CFI = .85, TLI = .83, RMSEA = .08). Five items had factor loadings that were below the accepted threshold of .5 (Hair et al., 2010), resulting in low reliability and a lack of construct validity. These items were also problematic with regard to their content. For example, while some of the items that measure the need for affiliation addressed an individual’s need for affiliation at work (e.g., “I spend a lot of time at work talking to other people”) or with respect to working in groups (e.g., “When I have a choice, I try to work in a group instead of by myself”), another item addressed an individual’s need for affiliation in general (e.g., “I am a ‘people’ person”). Similar problems with the measure were found in a validation study (Lawrence & Jordan, 2009) that respecified the measurement model by deleting five items. Following this procedure, we, too, deleted the problematic items. CFA of the respecified model yielded acceptable to good model fit (χ2 (84) = 135.063, p < .001, CFI = .93, TLI = .92, RMSEA = .06) and each individual-need item loaded significantly on its specified factor. To investigate the distinctiveness of the four needs, we compared the four-factor model to several two- and three-factor models as well as a one-factor model. Compared to the four-factor model, all other models were statistically inferior (detailed results of this comparison can be found in the supplementary material). Therefore, we could use the four-factor structure for further analysis as it accurately represents the distinct nature of the four needs.
To examine RQ1, we conducted latent profile analysis using the robust maximum likelihood (MLR) estimator in Mplus 7.4 (Muthén & Muthén, 2015). To identify homogeneous subgroups among employees in terms of their combinations of individual needs, we estimated one to nine profiles for the needs for achievement, power, affiliation, and autonomy. We considered various fit indices to identify the best-fitting model solution: the Akaike Information Criterion (AIC), the Bayesian Information Criterion (BIC), the sample-size adjusted BIC (SABIC), the Approximate Weight of Evidence Criterion (AWE), the Vuong-Lo-Mendell-Rubin adjusted likelihood ratio test (VLMR-LRT), the bootstrapped likelihood ratio test (BLRT), entropy, and average posterior probabilities. Low levels of AIC, BIC, SABIC, and AWE suggest good model fit, and high entropy suggests good class separations (Asparouhov & Muthén, 2014). The VLMR-LRT and the BLRT provide p-values indicating whether an additional profile improves model fit (Nylund-Gibson & Choi, 2018). Hence, comparing a profile solution against the solution with one less profile should result in a p-value smaller than .05 (Jung & Wickrama, 2008). The average posterior probabilities reflect the accuracy of classification in each profile. Values higher than .70 indicate well-separated profiles (Nagin, 2005; Nylund-Gibson & Choi, 2018). Table 2 displays the statistical results from the latent profile analysis. AIC and SABIC suggest that the five-profile solution is ideal, and BIC and AWE have the lowest values on the two-profile solution. The VLMR-LRT-statistic also suggests that the two-profile solution is the best-fitting model. Because the two-profile solution has a low entropy value and has only two quantitatively distinct profiles, thus lacking theoretical plausibility, the two-profile solution is not considered the best-fitting model solution. In contrast, the five-profile solution yields quantitatively and qualitatively distinct profiles of high theoretical interest and an adequate entropy value (Wang et al., 2017). The significant BLRT-statistic also suggests that the five-profile solution improves model fit compared to the four-profile solution. Moreover, all profiles in this solution have sufficient size, containing at least five percent of the total sample, and the posterior probabilities indicate a high likelihood of accurate assignment to the correct profiles (the posterior probabilities can be found in the supplementary material) (Nagin, 2005; Nylund-Gibson & Choi, 2018; Spurk et al., 2020). Therefore, considering the fit indices and theoretical plausibility, the five latent profiles yield the best-fitting model solution.
Table 2
Statistical results from the latent profile analysis (study 1).
| MODEL | LL | #FP | AIC | BIC | SABIC | AWE | VLMR (P) | BLRT (P) | ENTROPY |
|---|---|---|---|---|---|---|---|---|---|
| 1 profile | –699.887 | 8 | 1415.78 | 1440.57 | 1415.25 | 1435.04 | NA | NA | NA |
| 2 profiles | –674.577 | 13 | 1375.15 | 1415.45 | 1374.30 | 1406.46 | .03 | .00 | .55 |
| 3 profiles | –666.166 | 18 | 1368.33 | 1424.13 | 1367.14 | 1411.68 | .38 | .06 | .70 |
| 4 profiles | –660.542 | 23 | 1367.09 | 1438.38 | 1365.57 | 1422.48 | .46 | 1.00 | .79 |
| 5 profiles | –650.071 | 28 | 1356.14 | 1442.94 | 1354.29 | 1423.58 | .26 | .01 | .76 |
| 6 profiles | –645.301 | 33 | 1356.60 | 1458.90 | 1354.42 | 1436.08 | .34 | .67 | .79 |
| 7 profiles | –640.623 | 38 | 1357.25 | 1475.04 | 1354.74 | 1448.77 | .69 | 1.00 | .77 |
| 8 profiles | -634.261 | 43 | 1354.52 | 1487.82 | 1351.68 | 1458.09 | .49 | 1.00 | .81 |
| 9 profiles | -629.202 | 48 | 1354.40 | 1503.20 | 1351.23 | 1470.01 | .40 | 1.00 | .83 |
[i] Note: LL: model log-likelihood. #fp: number of free parameters. AIC: Akaike Information Criterion. BIC: Bayesian Information Criterion. SABIC: sample-size adjusted BIC. AWE: Approximate Weight of Evidence Criterion. VLMR: Vuong-Lo-Mendell-Rubin adjusted likelihood ratio test. BLRT: bootstrapped likelihood ratio test.
The results of the five-profile solution are shown graphically in Figure 1. Profile 1 (5% of the sample), the smallest profile, is characterized by extremely low levels of the needs for achievement, power, and affiliation and low levels of the need for autonomy, so the profile is termed undriven. Profile 2 (52% of the sample), the largest profile and labeled moderately driven, consists of employees who have average levels of all four needs. Profile 3 (21% of the sample), labeled affiliation-driven, has high levels of the need for affiliation, extremely low levels of the need for autonomy, and low levels of the needs for achievement and power. Profile 4 (8% of the sample), labeled autonomy-driven, is characterized by extremely high levels of the need for autonomy, high levels of the needs for achievement and power, and extremely low levels of the need for affiliation. Finally, those in profile 5 (14% of the sample) show extremely high levels of the needs for power and affiliation and high levels of the needs for achievement and autonomy, so this profile is termed highly driven.
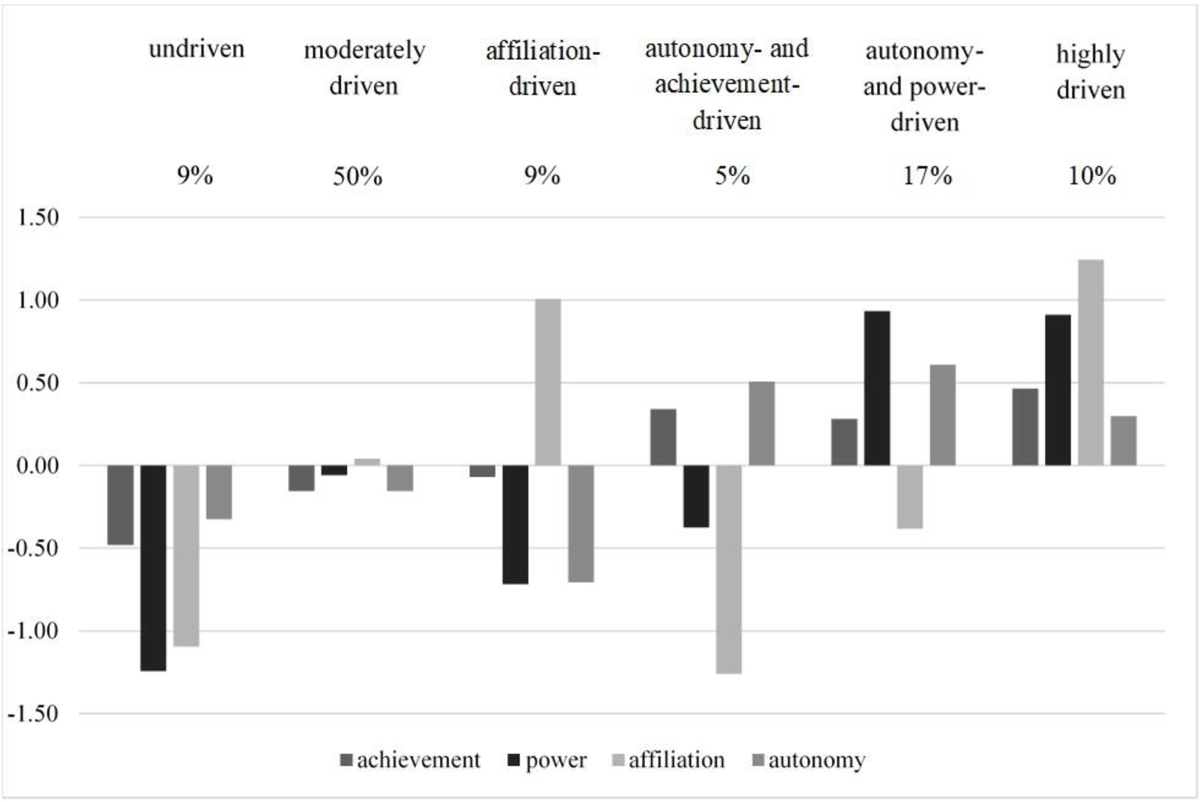
Figure 1
Five-profile solution for employees’ combinations of individual needs (study 1).
Descriptive differences of the five-profile solution can be found in the supplementary material. Additional multinomial logistic regression analysis using the R3STEP command in Mplus 7.4 (Muthén & Muthén, 2015) revealed significant differences among the profiles with respect to leadership responsibility. Employees who have leadership responsibility are significantly more likely to belong to profile 5 (highly driven) than they are to the profiles 1 (undriven), 2 (moderately driven), and 3 (affiliation-driven). In addition, employees who have leadership responsibility are also significantly less likely to belong to profile 1 (undriven) than they are to any other profile.
Regarding RQ1, the results of study 1 provide evidence of the existence of distinct profiles of individual needs that vary quantitatively and qualitatively. Whereas profiles 1 (undriven), 2 (moderately driven), and 5 (highly driven) differ in the levels of individual needs in general, profiles 3 (affiliation-driven) and 4 (autonomy-driven) differ in the quality of individual needs. However, these findings are based on a relatively small sample of rather young employees. Against this background, it is essential to investigate the replicability of the profiles of individual needs in a larger and more representative sample (Spurk et al., 2020). Hence, study 2 again addresses RQ1 by investigating the profiles’ replicability in a sample exceeding the recommended minimum sample size of 500 (Ferguson et al., 2020; Nylund et al., 2007). In addition, RQ2 is addressed in study 2 by analyzing how the membership in profiles of individual needs is related to the successful negotiation of i-deals.
Study 2: Profile replication and the relationship between profile membership and i-deals
Sample
We collected data using an online survey that was fielded in December 2020. The survey was distributed via an online panel that was operated by respondi AG, which recruits participants for academic survey projects. As in study 1, the survey targeted employees with any length of work experience and in any industry, and the voluntary nature of participation and the anonymity of the data was assured. Participants received .40 euro in compensation per completed questionnaire. On average, it took 7.35 minutes to answer the questionnaire. A total of 601 employees completed the survey, among whom five participants were excluded for failing attention checks and 43 participants were excluded due to high values in the scale detecting socially desirable answer tendencies (Satow, 2012). The final sample consisted of 553 employees. 59.90 percent of the participants were women. The participants averaged 45.08 years, and their organizational tenure ranged from less than a year to 45 years, with an average of 11.86 years. 28.90 percent of the sample had leadership responsibility.
Measures
We measured individual needs using Heckert et al.’s (2000) Needs Assessment Questionnaire, which we adapted based on the results of the CFA conducted in study 1. Accordingly, the measure consisted of the same items used in study 1: five items that measured the need for achievement (α = .83), four that measured the need for power (α = .83), two that measured the need for affiliation (ρ = .82), and four that measured the need for autonomy (α = .60).
Since, to date, there is no single comprehensive measure that captures the various types of i-deals identified in the literature, we integrated scales from prior studies. For this measure, respondents indicated the extent to which they had successfully negotiated individual arrangements in the areas of development opportunities (five items from Tang & Hornung, 2015; e.g., “customized learning and qualification opportunities”; α = .92), special tasks (three items from Hornung et al., 2014; e.g., “work tasks that suit my personal interest”; α = .86), temporally flexible working conditions (three items from Hornung et al., 2014; e.g., “extra flexibility in starting and ending my workday”; α = .86), locally flexible working conditions (two items from Tang & Hornung, 2015; e.g., “special arrangements on my location of work”; ρ = .81), and customized financial arrangements (four items from Rosen et al., 2013; e.g., “a compensation arrangement that is tailored to fit me”; α = .93). Respondents rated the extent to which they had obtained these i-deals on a five-point scale (the items are given in full in the supplementary material).
As in study 1, we collected other variables: gender (0 = male, 1 = female), age, organizational tenure, and leadership responsibility (0 = no leadership responsibility, 1 = leadership responsibility). Table 3 presents study 2’s descriptive statistics and correlations.
Table 3
Descriptive statistics and correlations (study 2).
| VARIABLE | M | SD | 1 | 2 | 3 | 4 | 5 | 6 | |
|---|---|---|---|---|---|---|---|---|---|
| 1 | achievement | 3.87 | .62 | ||||||
| 2 | power | 3.02 | .87 | .27*** | |||||
| 3 | affiliation | 2.88 | .98 | .12** | .23*** | ||||
| 4 | autonomy | 3.68 | .64 | .23*** | .41*** | –.16*** | |||
| 5 | development i-deals | 2.56 | 1.10 | .21*** | .37*** | .14** | .13** | ||
| 6 | task i-deals | 2.90 | 1.11 | .22*** | .30*** | .10* | .13** | .73*** | |
| 7 | scheduling flexibility i-deals | 2.77 | 1.23 | .13** | .16*** | –.02 | .16*** | .49*** | .57*** |
| 8 | location flexibility i-deals | 2.46 | 1.25 | .15*** | .20*** | –.04 | .22*** | .55*** | .55*** |
| 9 | financial i-deals | 2.34 | 1.17 | .19*** | .24*** | .05 | .08 | .64*** | .65*** |
| 10 | gender | .60 | .49 | .09* | –.20*** | –.05 | –.11* | –.16*** | –.12** |
| 11 | age | 45.08 | 10.67 | –.04 | .08 | –.17** | .11** | –.11** | –.04 |
| 12 | tenure | 11.86 | 10.43 | –.04 | .10* | –.11* | .14*** | .04 | .03 |
| 13 | leadership | .29 | .45 | .15*** | .46*** | .13** | .26*** | .27*** | .21*** |
| VARIABLE | 7 | 8 | 9 | 10 | 11 | 12 | |||
| 7 | scheduling flexibility i-deals | ||||||||
| 8 | location flexibility i-deals | .62*** | |||||||
| 9 | financial i-deals | .55*** | .54*** | ||||||
| 10 | gender | –.02 | –.06 | –.11* | |||||
| 11 | age | .00 | .01 | –.03 | –.11** | ||||
| 12 | tenure | .02 | .08 | –.04 | –.18*** | .47*** | |||
| 13 | leadership | .05 | .12** | .19** | –.23*** | .06 | .12** |
[i] Note: n = 553. Gender was coded as 0 = male, 1 = female. Leadership was coded as 0 = no leadership responsibility, 1 = leadership responsibility. * p < .05. ** p < .01. *** p < .001.
Analyses and results
Before conducting latent profile analysis, we tested the factorial structure of the measure used to capture individual needs, applying the same fit indices as in study 1. CFA indicated acceptable to good model fit (χ2 (84) = 294.478, p < .001, CFI = .93, TLI = .91, RMSEA = .07), and each individual-need item loaded significantly on its specified factor. As in study 1, we investigated the distinctiveness of the four needs by comparing the four-factor model to several two- and three-factor models as well as a one-factor model. Again, the four-factor model yielded the best model fit, so it was used for further analysis (detailed results of this comparison can be found in the supplementary material).
In addition, we also conducted CFA to test the factorial structure of the measure used to capture the different types of i-deals. The results indicated good model fit of the five-factor model (χ2 (109) = 261.98, p < .001, CFI = .98, TLI = .97, RMSEA = .05) and each item loaded significantly on its specified factor. The distinctiveness of the five types of i-deals was investigated by comparing the five-factor model to two-, three- and four-factor models as well as a one-factor model. The five-factor model yielded the best model-fit, so this factorial structure accurately represents the different types of i-deals under investigation (detailed results of this comparison can be found in the supplementary material).
To address RQ1, we tested the replicability of the profiles of individual needs that were identified in study 1. Conducting latent profile analysis using the robust maximum likelihood (MLR) estimator in Mplus 7.4 (Muthén & Muthén, 2015), we again estimated one to nine profiles. Table 4 provides information on the profile solutions’ fit indices. The results show that the indices are not particularly clear with regard to the best-fitting model solution: Whereas AIC and SABIC continue to decrease with the addition of latent profiles, BIC has the lowest value on the four-profile solution, and AWE has the first lowest value on the six-profile solution. Accordingly, we examined the four-to-six-profile solutions for their theoretical plausibility and found that adding a fifth and sixth profile resulted in another well-defined and qualitatively distinct profile. In addition, the entropy value and the posterior probabilities of the six-profile solution show that subjects can be allocated to the correct profile with reasonable certainty, and the significant VLMR-LRT-statistic and BLRT-statistic suggest that the six-profile solution has an improved model fit compared to the five-profile solution (the posterior probabilities can be found in the supplementary material) (Nagin, 2005; Nylund-Gibson & Choi, 2018). All profiles in this solution have sufficient size, containing at least five percent of the total sample (Spurk et al., 2020). For these reasons, the six-profile solution is deemed the best-fitting model solution.
Table 4
Statistical results from the latent profile analysis (study 2).
| MODEL | LL | #FP | AIC | BIC | SABIC | AWE | VLMR (P) | BLRT (P) | ENTROPY |
|---|---|---|---|---|---|---|---|---|---|
| 1 profile | –2532.22 | 8 | 5080.44 | 5114.96 | 5089.57 | 5099.71 | NA | NA | NA |
| 2 profiles | –2456.78 | 13 | 4939.56 | 4995.66 | 4954.39 | 4970.87 | .00 | .00 | .58 |
| 3 profiles | –2433.57 | 18 | 4903.14 | 4980.82 | 4923.68 | 4946.49 | .20 | .00 | .62 |
| 4 profiles | –2415.61 | 23 | 4877.21 | 4976.47 | 4903.45 | 4932.61 | .23 | .00 | .68 |
| 5 profiles | –2402.57 | 28 | 4861.15 | 4981.98 | 4893.09 | 4928.58 | .26 | .00 | .66 |
| 6 profiles | –2387.80 | 33 | 4841.59 | 4984.00 | 4879.24 | 4921.07 | .01 | .00 | .69 |
| 7 profiles | –2378.79 | 38 | 4833.57 | 4995.56 | 4876.93 | 4925.10 | .58 | .00 | .71 |
| 8 profiles | –2365.84 | 43 | 4817.68 | 5003.24 | 4866.74 | 4921.25 | .37 | .00 | .80 |
| 9 profiles | –2353.53 | 48 | 4791.04 | 5019.75 | 4851.51 | 4918.67 | .53 | .00 | .81 |
[i] Note: LL: model log-likelihood. #fp: number of free parameters. AIC: Akaike Information Criterion. BIC: Bayesian Information Criterion. SABIC: sample-size adjusted BIC. AWE: Approximate Weight of Evidence Criterion. VLMR: Vuong-Lo-Mendell-Rubin adjusted likelihood ratio test. BLRT: bootstrapped likelihood ratio test.
The results of the six-profile solution are shown graphically in Figure 2. Profile 1 (9% of the sample) is characterized by extremely low levels of the needs for power and affiliation and low levels of the needs for achievement and autonomy. Because of its similarity to profile 1 in study 1, this profile is also labeled undriven. Profile 2 (50% of the sample), the largest profile, consists of employees with average levels of all four individual needs, so this profile is termed moderately driven, like profile 2 in study 1. Profile 3 (9% of the sample) indicates high levels of the need for affiliation, extremely low levels of the needs for power and autonomy, and average levels of the need for achievement. Because of its similarity to profile 3 in study 1, this profile is also labeled affiliation-driven. Profile 4 (5% of the sample) is characterized by high levels of the needs for autonomy and achievement, extremely low levels of the need for affiliation, and low levels of the need for power, so the profile is termed autonomy- and achievement-driven. Profile 5 (17% of the sample) is characterized by extremely high levels of the needs for power and autonomy, high levels of the need for achievement, and low levels of the need for affiliation, so the profile is termed autonomy- and power-driven. Finally, employees in profile 6 (10% of the sample) show extremely high levels of the needs for power and affiliation as well as high levels of the needs for achievement and autonomy, so this profile is labeled highly driven, like profile 5 in study 1.
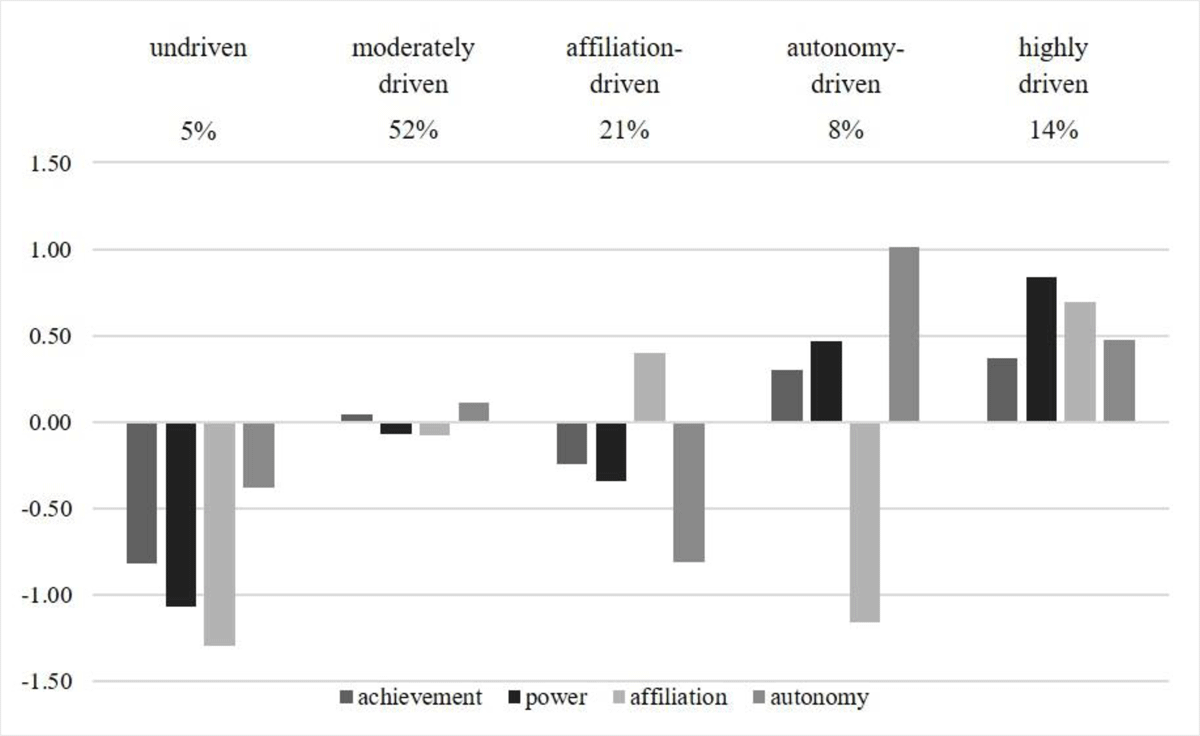
Figure 2
Six-profile solution for employees’ combinations of individual needs (study 2).
The descriptive differences of the six-profile solution can be found in the supplementary material. Additional multinomial logistic regression analysis using the R3STEP command in Mplus 7.4 (Muthén & Muthén, 2015) revealed significant differences among the profiles with respect to organizational tenure and leadership responsibility. Employees with a high organizational tenure are significantly more likely to belong to profile 5 (autonomy- and power-driven) than they are to profile 6 (highly driven). Moreover, employees who have leadership responsibility are significantly more likely to belong to profile 5 (autonomy- and power-driven) than they are to the profiles 1 (undriven) and 2 (moderately driven). In addition, employees who have leadership responsibility are also significantly more likely to belong to profile 6 (highly driven) than they are to the profiles 1 (undriven) and 2 (moderately driven).
With regard to RQ1, the results of study 2 also provide evidence of the existence of distinct profiles of individual needs that vary quantitatively and qualitatively. Whereas profiles 1 (undriven), 2 (moderately driven), and 6 (highly driven) differ in their levels of individual needs in general, profiles 3 (affiliation-driven), 4 (autonomy- and achievement-driven), and 5 (autonomy- and power-driven) differ in the quality of individual needs.
To gather evidence regarding RQ2 and compare the profiles’ differences in terms of i-deal negotiation, we ran the BCH procedure in Mplus 7.4 (Muthén & Muthén, 2015), which is based on Wald’s chi-square tests (Spurk et al., 2020). Table 5 reports the results regarding the differences in the profiles.
Table 5
Differences in the negotiation of i-deals across profiles.
| OUTCOME VARIABLE | PROFILE 1 UNDRIVEN | PROFILE 2 MODERATELY DRIVEN | PROFILE 3 AFFILIATION-DRIVEN | PROFILE 4 AUTONOMY-AND ACHIEVEMENT-DRIVEN | PROFILE 5 AUTONOMY-AND POWER-DRIVEN | PROFILE 6 HIGHLY DRIVEN | Wald’s χ2 | PROFILE DIFFERENCES |
|---|---|---|---|---|---|---|---|---|
| development i-deals | 1.57 (.17) | 2.55 (.08) | 2.22 (.22) | 2.29 (.30) | 2.88 (.15) | 3.45 (.20) | 74.02*** | 1 < 2***, 3*, 5***, 6*** 2 < 6*** 3 < 5*, 6*** 4 < 6** 5 < 6* |
| task i-deals | 2.21 (.21) | 2.92 (.08) | 2.32 (.23) | 2.69 (.33) | 3.10 (.16) | 3.75 (.18) | 47.51*** | 1 < 5***, 6*** 2 < 6*** 3 < 2*, 5**, 6*** 4 < 6** 5 < 6* |
| scheduling flexibility i-deals | 2.17 (.24) | 2.86 (.10) | 2.03 (.24) | 3.12 (.34) | 2.92 (.17) | 3.12 (.22) | 21.43** | 1 < 2**, 4*, 5**, 6** 3 < 2**, 4**, 5**, 6** |
| location flexibility i-deals | 1.82 (.23) | 2.51 (.10) | 1.54 (.19) | 3.00 (.36) | 2.83 (.18) | 2.69 (.22) | 41.34*** | 1 < 2**, 4*, 5***, 6** 3 < 4***, 5***, 6*** |
| financial i-deals | 1.61 (.20) | 2.42 (.10) | 1.79 (.20) | 2.22 (.30) | 2.55 (.17) | 2.93 (.22) | 33.19*** | 1 < 2**, 5***, 6*** 2 < 6* 3 < 2**, 5**, 6*** |
[i] Note: Estimated M (SD) are indicated. All scales were 5-point scales. Comparisons were conducted with the BCH-procedure in Mplus 7.4. * p < .05. ** p < .01. *** p < .001.
The overall Wald’s chi-square tests show that there were significant differences in all types of i-deals investigated. The results regarding development i-deals and task i-deals demonstrate that profile 6 (highly driven) has the highest levels of these types of i-deals (with significant differences from all other profiles), followed by the profiles 5 (autonomy- and power-driven) and 2 (moderately driven). In contrast, profile 1 (undriven) has the lowest levels of development and task i-deals, followed by the profiles 3 (affiliation-driven) and 4 (autonomy- and achievement-driven). With regard to flexibility-related i-deals, profile 4 (autonomy- and achievement-driven) has the highest levels of these types of i-deals, whereas profile 5 (autonomy- and power-driven) has the second-highest levels of location flexibility i-deals, and profile 6 (highly driven) has the second-highest levels of scheduling flexibility i-deals. The profiles 1 (undriven) and 3 (affiliation-driven) have significantly lower levels of scheduling flexibility i-deals and location flexibility i-deals than any other profile. Profile 6 (highly driven) has the highest levels of financial i-deals, followed by the profiles 5 (autonomy- and power-driven) and 2 (moderately driven). Similar to the case of flexibility-related i-deals, the profiles 1 (undriven) and 3 (affiliation-driven) have significantly lower levels of financial i-deals than any other profile except profile 4 (autonomy- and achievement-driven). Clearly, with respect to RQ2, the results show that profiles of individual needs relate to the successful negotiation of certain types of i-deals.
Discussion
Building on the Theory of Work Adjustment and the concept on needs-supplies fit, this study aimed to identify profiles of individual needs and analyze how these profiles relate to the successful negotiation of different types of i-deals. To examine RQ1 empirically and identify profiles of individual needs, we conducted latent profile analysis using two samples. Study 1, which was performed with a relatively small and young sample, identified five latent profiles (i.e., undriven, moderately driven, affiliation-driven, autonomy-driven, and highly driven). Study 2, which was conducted with a larger and more representative sample, identified six latent profiles (i.e., undriven, moderately driven, affiliation-driven, autonomy- and achievement-driven, autonomy- and power-driven, and highly driven), most of which are remarkably similar to the five-profile solution identified in study 1. The findings of both studies indicate that some employees are consistently driven by relatively high, moderately high, or relatively low levels of individual needs (profiles 1 (undriven), 2 (moderately driven), and 5 (highly driven) in study 1 and profiles 1 (undriven), 2 (moderately driven), and 6 (highly driven) in study 2) and that some employees are primarily driven by only one or two needs (profiles 3 (affiliation-driven) and 4 (autonomy-driven) in study 1 and profiles 3 (affiliation-driven), 4 (autonomy- and achievement-driven), and 5 (autonomy- and power-driven) in study 2). Thus, both studies provide evidence of profiles of individual needs that differ both quantitatively and qualitatively.
However, there are also some differences between the profiles identified in the two samples. While study 1’s profile 4 is characterized by extremely high levels of need for autonomy and so is named autonomy-driven, study 2 identified two profiles that are characterized by high levels of need for autonomy—the autonomy- and achievement-driven and autonomy- and power-driven profiles—these profiles differ in terms of other needs. Above that, some of the profiles also differ with respect to their sizes. Whereas profile 3 (affiliation-driven) makes up 21 percent of the sample in study 1, it makes up only 9 percent of the sample in study 2. In contrast, profile 4 (autonomy-driven) makes up 8 percent of the sample in study 1, while the profiles that carry high levels of the need for autonomy in study 2 make up 5 percent (profile 4 (autonomy- and achievement-driven)) and 17 percent (profile 5 (autonomy- and power-driven)) of that sample.
The differences in the profiles identified in the two samples are likely to be at least in part due to the different sample sizes (N = 164 in study 1 vs. 553 in study 2). Meyer et al. (2019) also observed that studies with larger sample sizes tend to identify more profiles than studies with smaller sample sizes do. For their part, Klotz et al. (2018) found differences in the profiles identified in a smaller and a larger sample and argued that contextual factors that influence the samples’ composition play a role in shaping the profiles. In our studies, the considerable difference in the average age between the two samples (M = 33.71 and SD = 10.60 in study 1 vs. M = 45.08 and SD = 10.67 in study 2) may have led to differences in the profiles. Although individual needs have been conceptualized as stable personality characteristics (Kanfer et al., 2017), during the last decades, research has revealed the role of the environment in changes in personality characteristics (Denzinger & Brandstätter, 2018). While individual needs usually emerge during childhood, changing circumstances and new experiences (e.g., parenthood, job changes) can lead to changes in the importance of particular needs during adulthood (e.g., Roberts et al., 2006; Specht et al., 2011). These changes may have led to differences between the two samples we studied, which show more individuals driven by the need for affiliation in the younger sample and more individuals driven by the need for autonomy in the older sample.
The results of study 2 also address RQ2 by revealing how profiles of individual needs relate to i-deals. More specifically, our results suggest that employees’ membership in profiles relates to their successful negotiation of certain types of i-deals. For example, employees who belong to profile 6 (highly driven) seek the most development, task, and financial i-deals. As these employees have high levels of all four individual needs, they are particularly motivated to enhance their skills and grow in their organizations and feel entitled to receive special treatment (Bal, 2017; Bal & Vossaert, 2019). Another finding is that employees who belong to profile 4 (autonomy- and achievement-driven) seek the most scheduling flexibility and location flexibility i-deals. Since these employees are primarily driven by the needs for autonomy and achievement, they look for ways to achieve more flexibility at work to enhance their work-life balance and/or their productivity (Bal, 2017; Bal & Vossaert, 2019; Las Heras et al., 2017). We also identified groups of employees who largely refrain from negotiating any type of i-deal. In the case of profile 3 (affiliation-driven), their restraint may be due to worrying that the individual treatment will upset their colleagues. For individuals who are primarily driven by the need for affiliation, it might be more important to fit into the group and not upset anyone than it is to receive individual treatment (Ng & Lucianetti, 2016).
Overall, then, our findings provide a nuanced understanding of the relationship between employees’ individual needs and their successful negotiation of i-deals. This contribution is due not only to the profile-based approach, but also to the integration of various types of i-deals. Since our findings indicate that the types of i-deals that employees seek based on their profile membership differ to a great extent, they emphasize the need to distinguish among types of i-deals, instead of treating i-deals as a single dimension (Liao et al., 2016). By doing so, more accurate insights into the antecedents of i-deals can be achieved.
Theoretical Contributions and Practical Implications
This study contributes to different streams of literature. First, the person-centered approach to the study of individual needs extends research on personality dispositions as an important variable in organizational psychology research. The approach pays attention to how combinations of individual needs occur in subgroups and how they interact to shape behavior. Thereby, our findings contribute to a more nuanced and detailed understanding of employees’ individual needs and emphasize that individuals are not driven by a single need but by the simultaneous occurrence of multiple needs.
Second, the study contributes to the i-deals literature by determining how profiles of individual needs relate to i-deals and revealing why some employees are more likely to seek certain types of i-deals than others. Although calls for more research on the role of employees’ personality dispositions in the negotiation of i-deals have been made (e.g., Liao et al., 2016; Ng & Lucianetti, 2016), the topic has received little attention. We fill this critical gap in the literature by gathering empirical evidence regarding the relationship between individual needs and the successful negotiation of i-deals. By adopting a needs-supplies fit perspective (Edwards, 1991; Kristof-Brown et al., 2005) on i-deals, our findings demonstrate that i-deals can be understood as resources provided by organizations to fulfil individual needs and thus help to improve person-job fit (Bakker & Ererdi, 2022).
Third, our findings also highlight the need to differentiate among types of i-deals because employees show considerable differences in the types of i-deals they seek depending on their membership in certain profiles of individual needs. The differentiation is important because studies have revealed that obtaining a certain type of i-deal results in different attitudes and behaviors among employees (e.g., Hornung et al., 2014; Rosen et al., 2013; Rousseau et al., 2009).
From a practical perspective, the results of our study highlight that employees differ considerably in their combinations of individual needs. Accordingly, instead of using a one-size-fits-all approach, managers should support employees in adapting their working conditions to their individual needs and preferences. The results of our study suggest that some employees are more likely to seek and obtain certain types of i-deals than others. For example, employees who are highly driven by the needs for achievement and power are more likely to seek development, task, and financial i-deals, while employees who are primarily driven by the need for autonomy are more likely to seek flexibility-related i-deals. To maximize the utility of i-deals, managers should consider employees’ individual needs and grant i-deals to employees who attach high importance to them (Ng & Lucianetti, 2016).
Managers can grant i-deals as a resource in order to improve the compatibility between their employees and the job, which in turn can lead to positive outcomes for employees and employers, such as increased job satisfaction, organizational commitment, reduced turnover intentions (Kristof-Brown et al., 2005) as well as increased perceptions of organizational justice and well-being (Roczniewska et al., 2018). However, managers should also keep in mind the potential downsides of i-deals. The results of our study show that, depending on their combinations of individual needs, some employees are likely to seek and obtain i-deals, while others are likely to refrain from negotiating them at all. Hence, our results support the concern Bal and Lub (2015) raised that i-deals could trigger a “Matthew effect” (Rigney, 2010), widening the gap between employees who receive individual treatment and employees who do not. To avoid negative social consequences of i-deals, managers should carefully consider justice-related concerns before granting i-deals (Lee et al., 2022).
Limitations and Directions for Future Research
In addition to its contributions, our study has limitations that future research should address. First, the cross-sectional design used in this study does not allow us to draw causal conclusions from our results. Hence, future longitudinal studies could contribute to the validation of the findings of this study.
Second, our results may be subject to common-method bias because all variables were collected from self-reported measures. Given the latent character of most of our constructs, drawing on self-reported measures is almost unavoidable and CFA provides evidence of the discriminant validity of the measures used. However, future studies should collect the measures of i-deals from multiple sources (i.e., employees, supervisors, and co-workers) to verify that perceptions of i-deals are consistent.
Third, we cannot rule out social-desirability bias in the responses of some participants. We took methodological steps to mitigate this bias. For instance, we assured the participants that they could respond honestly. Nevertheless, future studies could consider additional steps to alleviate social-desirability bias like measuring variables at different points in time (Podsakoff et al., 2003).
Fourth, the scales used to assess employees’ needs for affiliation and autonomy, which are part of the Needs Assessment Questionnaire (Heckert et al., 2000), demonstrated low reliability and construct validity in our study. Consequently, some items from these scales had to be excluded to achieve a satisfactory model fit in the CFAs. While the Needs Assessment Questionnaire has shown better internal consistency compared to Steers and Braunstein’s (1976) Manifest Needs Questionnaire in previous validation studies (Heckert et al., 2000; Lawrence & Jordan, 2009), it does have limitations in adequately measuring the complex needs for affiliation and autonomy within the German-speaking context and contemporary times. Therefore, future research is encouraged to develop more reliable and valid scales to measure individual needs.
Another limitation of our study is related to the operationalization of i-deals. Building on existing measures, we captured i-deals that employees had successfully negotiated but did not differentiate between i-deals that had been requested and those that had been obtained, so we neglected the possibility that employees had requested but not received i-deals. Since research has demonstrated that the denial of i-deals is not rare (e.g., Bayazit & Bayazit, 2019), future research should differentiate requests from receipt to provide a more nuanced understanding of the negotiation process of i-deals.
Furthermore, unmeasured cultural variables may have influenced our results. For example, employees in highly individualistic cultures may be more likely to seek i-deals in order to pursue their own interests than employees in highly collectivistic cultures are (Liao et al., 2016). In addition, in cultures with high power distance, employees may be less likely to seek i-deals than in cultures with low power distance (Laulié et al., 2021). Future studies could also investigate whether the structure of profiles of individual needs is consistent across cultures, as individual needs can also be influenced by culture (Van Emmerik et al., 2010).
Finally, it is important to note that our data collection took place at the end of 2020, coinciding with the lockdown period in Germany due to the COVID-19 pandemic. Given that individual needs are regarded as stable personality characteristics (Kanfer et al., 2017), it seems unlikely that the lockdown had a strong impact on employees’ individual needs. However, it has to be acknowledged that extraordinary circumstances like the COVID-19 pandemic may sometimes exert an influence on individuals’ psychological requirements (Denzinger & Brandstätter, 2018). For example, while our study did not specifically address the perceived social isolation experienced by the survey participants, it is conceivable that social isolation during the lockdown may have led to alterations in the prominence of certain needs, particularly the need for affiliation. In addition, research indicates that lockdowns during the COVID-19 pandemic have promoted the prevalence of i-deals, which may have led to particularly high levels of i-deals captured in our study (Anand & Rofcanin, 2022).
Additional File
The additional file for this article can be found as follows:
Supplementary File 1
CFA results, average posterior pobabilities, descriptive differences of the profile-solutions, items for the measurement of individual needs and idiosyncratic deals. DOI: https://doi.org/10.16993/sjwop.220.s1
Competing Interests
The authors have no competing interests to declare.