
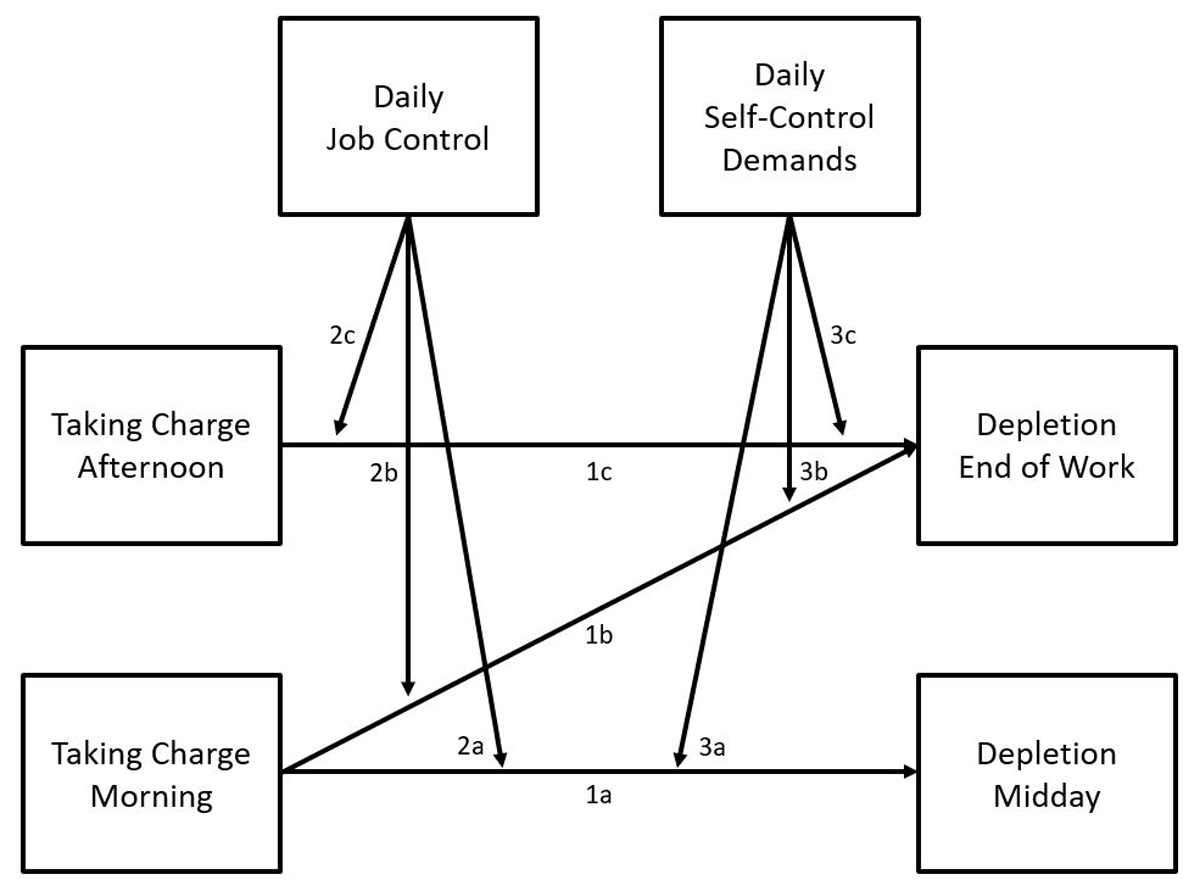
Figure 1
Conceptual Model.
Table 1
Means, Standard Deviations, ICCs, and Correlations among Study Variables.
| Mbt | SDbt | SDwi | ICC | 1 | 2 | 3 | 4 | 5 | 6 | 7 | 8 | 9 | 10 | 11 | 12 | 13 | |
|---|---|---|---|---|---|---|---|---|---|---|---|---|---|---|---|---|---|
| 1. TC Afternoon | 2.14 | .83 | .72 | .57 | .93 | .40*** | .12** | .09* | .00 | .14** | –.05 | –.06 | .17*** | .09* | –.14*** | –.07 | .08* |
| 2. TC Morning | 2.18 | .78 | .75 | .52 | .99*** | .92 | .04 | .14** | .07 | .11* | .02 | .03 | .11** | .15*** | –.05 | –.02 | .07 |
| 3. IRB Afternoon | 4.06 | .49 | .54 | .45 | –.07 | –.08 | .76 | .25*** | –.10* | .15** | –.15** | –.08 | .18*** | .08* | –.15*** | –.09* | –.02 |
| 4. IRB Morning | 4.02 | .46 | .58 | .39 | –.14 | –.14 | .97*** | .79 | –.08* | .09* | –.07 | –.26*** | .09* | .26*** | –.14*** | –.22*** | –.08* |
| 5. D SC Demands | 2.64 | .67 | .57 | .58 | .18 | .19* | .18 | –.39*** | .87 | .06 | .24*** | .21*** | –.17*** | –.13** | .30*** | .22*** | .13* |
| 6. D Job Control | 3.70 | .72 | .76 | .47 | .20* | .19* | .39*** | .28** | –.06 | .91 | –.07 | –.10* | .08 | .03 | –.03 | –.00 | .06 |
| 7. Negative Affect (t3) | 1.43 | .35 | .44 | .39 | –.02 | –.03 | –.33** | –.44*** | .53*** | –.11 | .81 | .39*** | –.34*** | –.16*** | .44*** | .22*** | .13** |
| 8. Negative Affect (t2) | 1.45 | .35 | .44 | .39 | .08 | .08 | –.38*** | –.44*** | .50*** | –.12 | .97*** | .79 | –.16*** | –.30*** | .18*** | .42*** | .17** |
| 9. Positive Affect (t3) | 3.04 | .59 | .59 | .51 | .33** | .35** | .23* | .17 | –.10 | .30** | –.23* | –.22* | .88 | .31*** | –.52*** | –.20*** | –.11** |
| 10. Positive Affect (t2) | 2.81 | .58 | .52 | .55 | .35** | .38*** | .25* | .18 | –.10 | .24* | –.24* | –.21* | .89*** | .85 | –.18*** | –.48*** | –.20*** |
| 11. Depletion (t3) | 2.05 | .71 | .69 | .51 | .05 | .05 | –.47*** | –.45*** | .53*** | –.29*** | .58*** | .61*** | –.42*** | –.29** | .91 | .36*** | .20*** |
| 12. Depletion (t2) | 1.70 | .58 | .56 | .52 | .10 | .11 | .41*** | –.45*** | .51*** | –.11 | .63*** | .68*** | –.36*** | –.37*** | .88*** | .90 | .33*** |
| 13. Depletion (t1) | 1.68 | .58 | .58 | .51 | .02 | .05 | –.32*** | –.39*** | .43*** | –.04 | .72*** | .75*** | –.31** | –.40*** | .71*** | .88*** | .89 |
[i] Note. Mean Cronbach’s Alphas over the ten workdays are displayed in bold. Intercorrelations above the diagonal refer to the within level (n = 963), below the diagonal to the between-level (N = 136). t1, t2, t3 refer to the measurement points (morning, midday, afternoon). D = Daily, SC = Self-control, TC = Taking Charge, IRB = In-role-behavior, bt = between-level, wi = within-level.
* p < 05. ** p < .01. *** p < .001.
Table 2
Unstandardized Within-Person Coefficients from One Overall Multi-Level Path Analysis Predicting Depletion at Midday and at the End of Work.
| WITHIN-LEVEL PREDICTORS | DEPLETION MIDDAY (T2) | DEPLETION END OF WORK (T3) | |||||||
|---|---|---|---|---|---|---|---|---|---|
| ESTIMATE | SE | z | 95% CI | ESTIMATE | SE | z | 95% CI | ||
| Controls | |||||||||
| Negative Affect (t2) | .326 | .05 | 6.004*** | [.22, .43] | – | – | – | – | |
| Positive Affect (t2) | –.359 | .05 | –7.533*** | [–.45, –.26] | – | – | – | – | |
| Negative Affect (t3) | – | – | – | – | .372 | .07 | 5.748*** | [.25, .50] | |
| Positive Affect (t3) | – | – | – | – | –.427 | .04 | –11.252*** | [–.50, –.35] | |
| In-Role Behavior Morning (t2) | –.050 | .03 | –1.610 | [–.11, .01] | –.047 | .04 | –1.161 | [–.13, .03] | |
| In-Role Behavior Afternoon (t3) | – | – | – | – | –.016 | .04 | –0.353 | [–.10, .07] | |
| Model Variables | |||||||||
| Depletion Morning (t1) | .194 | .04 | 5.352*** | [.12, .27] | .079 | .04 | 2.037* | [.00, .15] | |
| Depletion Midday (t2) | – | – | – | – | .213 | .05 | 4.380*** | [.12, .31] | |
| Taking Charge Morning (t2) | .005 | .02 | 0.222 | [–.04, .05] | –.014 | .02 | –0.670 | [–.06, .03] | |
| Taking Charge Afternoon (t3) | – | – | – | – | –.055 | .03 | –2.252* | [–.10, –.01] | |
| Daily Self-Control Demands (t3) | .086 | .03 | 2.741** | [.03, .15] | .152 | .04 | 3.409** | [.06, .24] | |
| Daily Job Control (t3) | .013 | .02 | 0.555 | [–.03, .06] | .014 | .04 | 0.341 | [–.07, .10] | |
| Interaction Terms | |||||||||
| TC Morning × Daily Job Control | –.017 | .04 | –0.475 | [–.09, .05] | –.159 | .04 | –3.612*** | [–.25, –.08] | |
| TC Morning × Daily SC Demands | .024 | .04 | 0.591 | [–.06, .11] | .018 | .05 | 0.339 | [–.08, .12] | |
| TC Afternoon × Daily Job Control | – | – | – | – | .056 | .04 | 1.579 | [–.01, .13] | |
| TC Afternoon × Daily SC Demands | – | – | – | – | .052 | .05 | 1.002 | [–.05, .15] | |
| Residual Variance | .198 | .02 | 10.692*** | [.16, .23] | .273 | .02 | 11.607*** | [.23, .32] | |
| Within-Person R Square | 36.1% | .03 | 10.853*** | 42.8% | .03 | 12.937*** | |||
[i] Note. N = 136, n = 963. Unstandardized estimates from one overall analysis predicting Depletion Midday and Depletion End of Work. When controlling for reverse causality, the pattern of results remains. When not controlling for affect and/or in-role behavior, the pattern of results remains. When specifying both parts (i.e., on depletion at midday and depletion at the end of work) in separate models, the pattern of results remains. When controlling for day of study or weekday, results do not change. t1, t2, t3 refer to the measurement points (morning, midday, afternoon). TC = Taking Charge, SC = Self-Control, CI = confidence interval.
* p < 05. ** p < .01. *** p < .001.
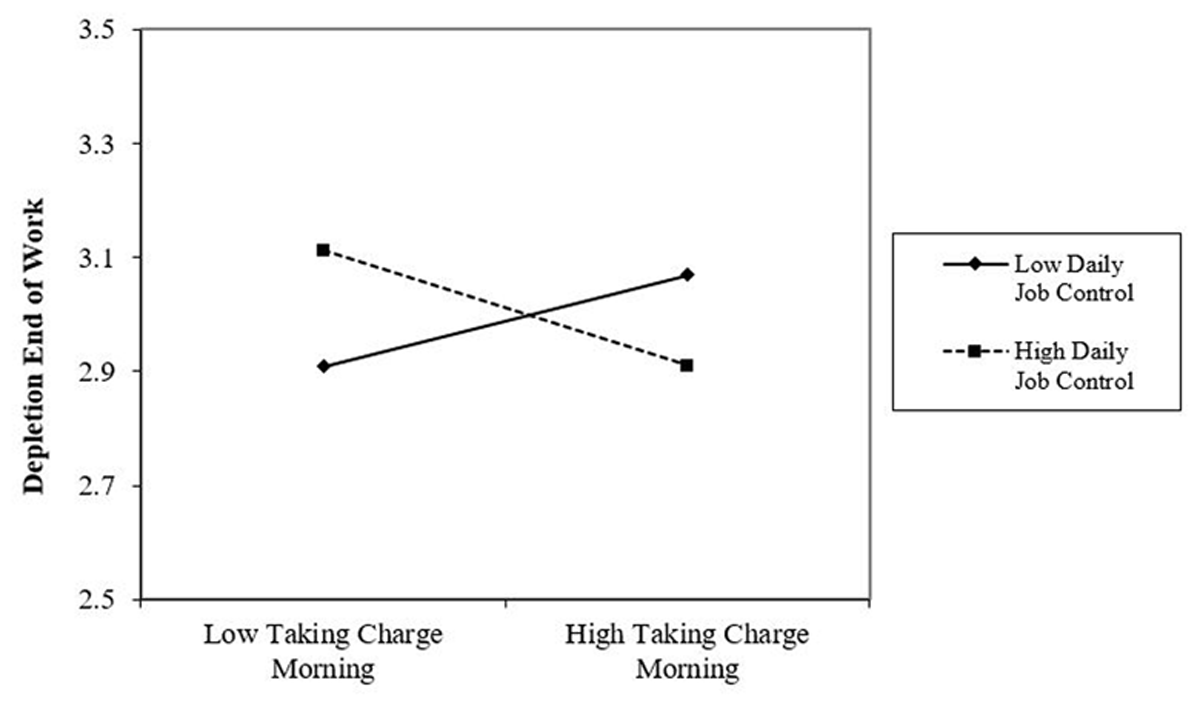
Figure 2
Moderation of Daily Job Control on the Relationship of Proactive Behavior in the Morning with Depletion at the End of Work.
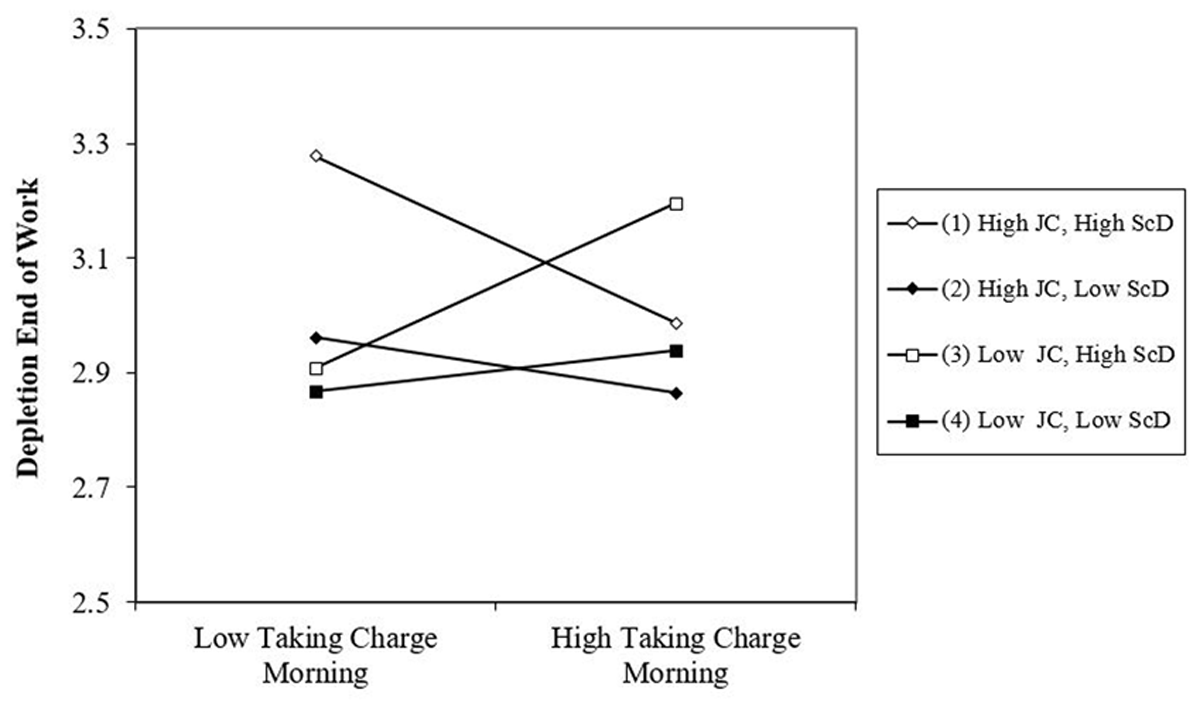
Figure 3
Three-Level Moderation of Daily Job Control and Daily Self-Control Demands on the Relationship of Proactive Behavior in the Morning with Depletion at the End of Work.
Note. JC = Daily Job Control, ScD = Daily Self-Control Demands.