
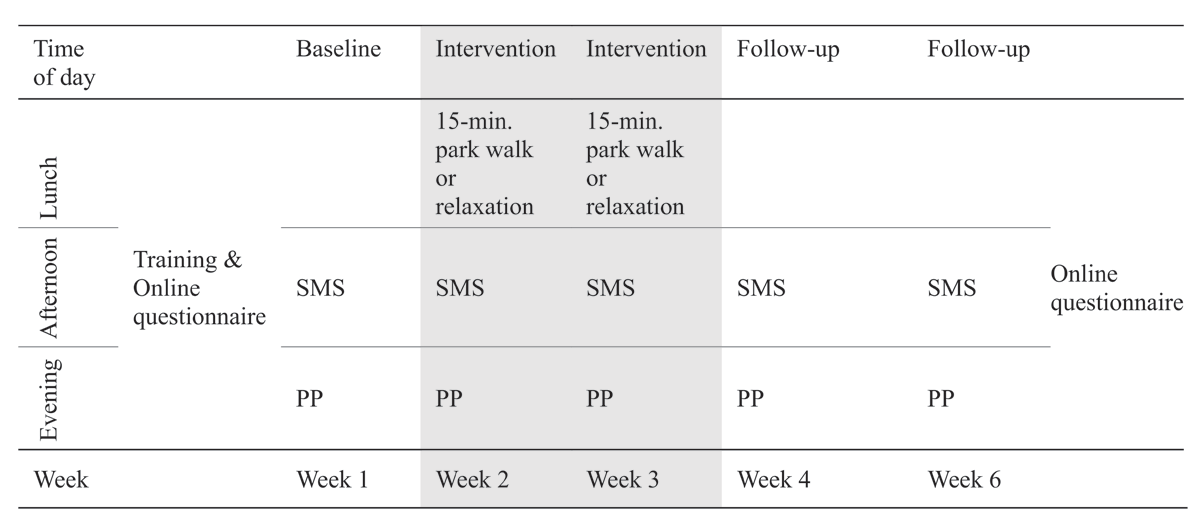
Figure 1
Study design. Daily data were collected twice a week, on Tuesdays and Thursdays. The intervention exercise was completed every day from Monday to Friday during the two intervention weeks. SMS = SMS questionnaire sent to participants’ cell phones; PP = pencil-and-paper questionnaire.
Table 1
Means, standard deviations, and zero-order correlations between study variables.
| M | SD | 1. | 2. | 3. | 4. | 5. | 6. | 7. | 8. | 9. | |
|---|---|---|---|---|---|---|---|---|---|---|---|
| 1. Work hours | 7.64 | 0.76 | – | 0.01 | –0.07 | 0.03 | –0.13** | –0.07* | –0.05 | –0.22** | –0.21** |
| 2. Park walkinga | 0.24 | 0.23 | –0.10 | – | –0.01 | –0.06 | 0.05 | 0.08* | 0.11** | –0.04 | 0.04 |
| 3. Relaxation exerciseb | 0.21 | 0.24 | 0.29** | –0.75** | – | –0.16** | 0.03 | 0.03 | 0.05 | 0.03 | 0.07 |
| 4. Fatigue (1–7) | 3.81 | 1.15 | –0.01 | 0.04 | –0.02 | – | –0.28** | –0.04 | 0.004 | –0.04 | 0.03 |
| 5. Positive affect (1–7) | 4.85 | 0.93 | 0.12 | 0.02 | 0.15 | –0.36** | – | 0.02 | –0.05 | 0.05 | 0.14** |
| 6. Evening physical exercise | 0.57 | 0.37 | –0.06 | –0.04 | –0.04 | –0.18 | 0.08 | – | 0.42** | –0.16** | 0.20** |
| 7. Evening physical activity in nature | 0.31 | 0.33 | –0.20 | 0.01 | –0.07 | –0.27** | 0.14 | 0.32** | – | –0.05 | 0.11** |
| 8. Evening social activities | 1.97 | 1.07 | –0.11 | –0.05 | –0.05 | –0.25* | 0.22* | 0.09 | 0.11 | – | 0.18** |
| 9. Evening relaxation (1–5) | 3.94 | 0.61 | –0.29** | 0.09 | –0.17 | –0.28** | 0.31** | 0.17 | 0.18 | 0.20 | – |
[i] Notes: Correlations below the diagonal are between-person level correlations (person means aggregated over the repeated daily observations; N = 97), correlations above the diagonal are within-person (day level) correlations (N = 970). a 0 = no, 1 = yes, a park walk during lunch break; b 0 = no, 1 = yes, a relaxation exercise during lunch break.
* p < 0.05, ** p < 0.01.
Table 2
Multi-level regression analyses.
| VARIABLE | EVENING PHYSICAL EXERCISE | EVENING PHYSICAL ACTIVITY IN NATURAL SURROUNDINGS | SOCIAL ACTIVITIES | |||||||||||||||
|---|---|---|---|---|---|---|---|---|---|---|---|---|---|---|---|---|---|---|
| MODEL 1 | MODEL 2 | MODEL 1 | MODEL 2 | MODEL 1 | MODEL 2 | |||||||||||||
| EST | SE | T | EST | SE | T | EST | SE | T | EST | SE | T | EST | SE | T | EST | SE | T | |
| Intercept | 0.67 | 0.07 | 10.34 | 0.69 | 0.07 | 10.10 | 0.28 | 0.06 | 4.93 | 0.28 | 0.06 | 4.87 | 2.00 | 0.17 | 11.64 | 2.06 | 0.18 | 11.63 |
| Within-person results | ||||||||||||||||||
| Time (diary day) | –0.01 | 0.01 | –1.90 | –0.02 | 0.01 | –2.22* | 0.004 | 0.01 | 0.75 | 0.003 | 0.01 | 0.53 | 0.01 | 0.01 | 0.81 | 0.02 | 0.02 | 1.41 |
| Work hours | –0.04 | 0.02 | –1.81 | –0.04 | 0.03 | –1.48 | –0.02 | 0.02 | –1.31 | –0.03 | 0.02 | –1.46 | –0.27 | 0.04 | –6.02*** | –0.29 | 0.05 | –5.58*** |
| Park walkinga | 0.14 | 0.05 | 2.69** | 0.16 | 0.06 | 2.70** | 0.16 | 0.05 | 3.49*** | 0.20 | 0.05 | 3.80*** | –0.10 | 0.11 | –0.84 | –0.12 | 0.12 | –0.97 |
| Relaxation exerciseb | 0.07 | 0.06 | 1.17 | 0.06 | 0.06 | 0.88 | 0.07 | 0.05 | 1.44 | 0.10 | 0.06 | 1.82 | 0.16 | 0.12 | 1.28 | 0.08 | 0.13 | 0.59 |
| Afternoon fatigue | –0.01 | 0.02 | –0.70 | –0.0002 | 0.02 | –0.02 | –0.01 | 0.04 | –0.37 | |||||||||
| Afternoon PAc | –0.002 | 0.03 | –0.09 | –0.03 | 0.02 | –1.32 | 0.02 | 0.05 | 0.38 | |||||||||
| Between-person results | ||||||||||||||||||
| Work hours | –0.02 | 0.06 | –0.44 | –0.05 | 0.06 | –0.84 | –0.08 | 0.05 | –1.72 | –0.10 | 0.05 | –2.10* | –0.12 | 0.16 | –0.80 | –0.13 | 0.16 | –0.81 |
| Park walkinga | –0.26 | 0.27 | –0.94 | –0.26 | 0.28 | –0.96 | –0.08 | 0.23 | –0.35 | –0.07 | 0.22 | –0.30 | –0.68 | 0.75 | –0.90 | –1.18 | 0.77 | –1.54 |
| Relaxation exerciseb | –0.23 | 0.27 | –0.85 | –0.26 | 0.28 | –0.92 | –0.06 | 0.23 | –0.27 | –0.07 | 0.23 | –0.31 | –0.59 | 0.74 | –0.80 | –1.26 | 0.77 | –1.62 |
| Afternoon fatigue | –0.08 | 0.04 | –1.97 | –0.09 | 0.03 | –2.86** | –0.20 | 0.11 | –1.82 | |||||||||
| Afternoon PAc | 0.01 | 0.05 | 0.29 | 0.03 | 0.04 | 0.62 | 0.26 | 0.14 | 1.86 | |||||||||
| Model fit statistics | ||||||||||||||||||
| Level-1 intercept variance (SE) | 0.31(0.56) | 0.31(0.56) | 0.20(0.45) | 0.21(0.46) | 1.24(1.11) | 1.18(1.09) | ||||||||||||
| BIC | 1528.41 | 1367.12 | 1163.35 | 1078.33 | 2682.62 | 2324.95 | ||||||||||||
| AIC | 1477.33 | 1299.95 | 1117.14 | 1015.95 | 2635.99 | 2261.96 | ||||||||||||
| –2*log(lh) | 1455.33 | 1269.95 | 1097.14 | 987.95 | 2615.99 | 2233.96 | ||||||||||||
[i] Notes: All variables were measured at the day level. a 0 = no, 1 = yes, a park walk during lunch break; b 0 = no, 1 = yes, a relaxation exercise during lunch break. cPA = Positive affect. BIC = Bayesian Information Criterion; AIC = Akaike’s Information Criterion. When comparing nested models, the smallest indices indicate the best model fit.
* p < 0.05, ** p < 0.01, *** p < 0.001.
Table 3
Multi-level regression analyses predicting evening relaxation.
| MODEL 1 | MODEL 2 | |||||
|---|---|---|---|---|---|---|
| EST | SE | T | EST | SE | T | |
| Intercept | 3.88 | 0.10 | 37.33 | 3.99 | 0.10 | 39.50 |
| Within-person results | ||||||
| Time (diary day) | 0.01 | 0.01 | 1.13 | 0.01 | 0.01 | 0.81 |
| Work hours within | –0.17 | 0.03 | –5.44*** | –0.09 | 0.04 | –2.51* |
| Park walking withina | 0.15 | 0.08 | 1.88 | 0.14 | 0.09 | 1.59 |
| Relaxation exercise withinb | 0.14 | 0.09 | 1.64 | 0.09 | 0.10 | 0.95 |
| Afternoon fatigue within | 0.04 | 0.03 | 1.62 | |||
| Afternoon positive affect within | 0.11 | 0.04 | 2.99** | |||
| Between-person results | ||||||
| Work hours between | –0.20 | 0.09 | –2.31* | –0.18 | 0.08 | –2.10* |
| Park walking betweena | –0.004 | 0.42 | –0.01 | –0.46 | 0.39 | –1.18 |
| Relaxation exercise betweenb | –0.28 | 0.42 | –0.65 | –0.84 | 0.40 | –2.12* |
| Afternoon fatigue between | –0.06 | 0.06 | –1.07 | |||
| Afternoon positive affect between | 0.24 | 0.07 | 3.34** | |||
| Model fit statistics | ||||||
| Level-1 intercept variance (SE) | 0.75(0.86) | 0.76(0.87) | ||||
| BIC | 2143.74 | 1857.53 | ||||
| AIC | 2092.39 | 1789.92 | ||||
| –2*log(lh) | 2070.39 | 1759.92 | ||||
[i] Notes: All variables were measured at the day level. a 0 = no, 1 = yes, a park walk during lunch break; b 0 = no, 1 = yes, a relaxation exercise during lunch break. BIC = Bayesian Information Criterion; AIC = Akaike’s Information Criterion. When comparing nested models, the smallest indices indicate the best model fit.
* p < 0.05, ** p < 0.01, *** p < 0.001.