
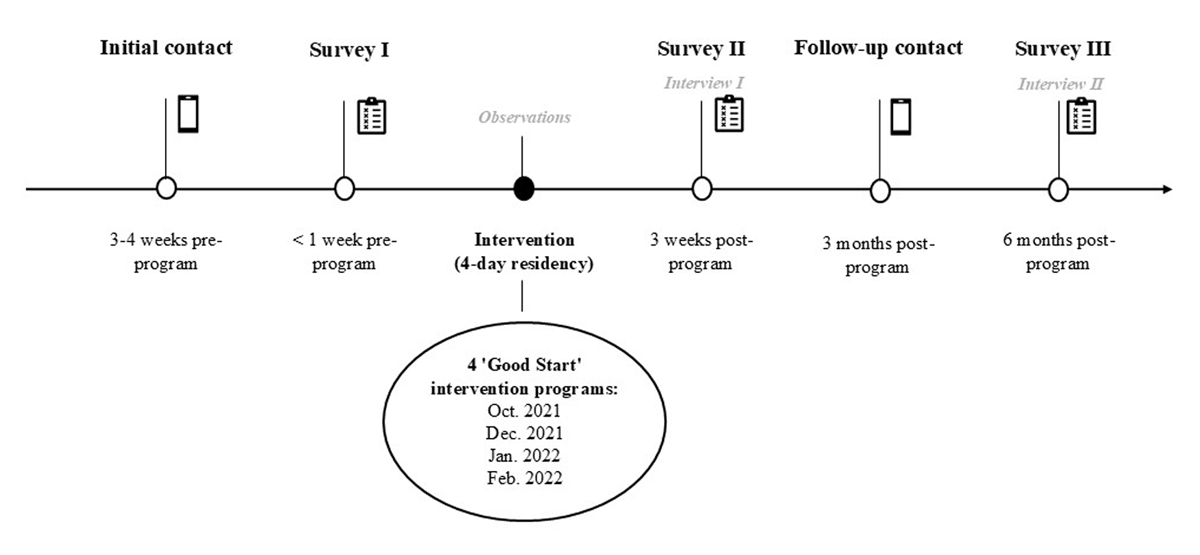
Figure 1
Timeline of evaluation.
*Intervention refers to the four-day intensive residency at the Elsass Foundation’s location.
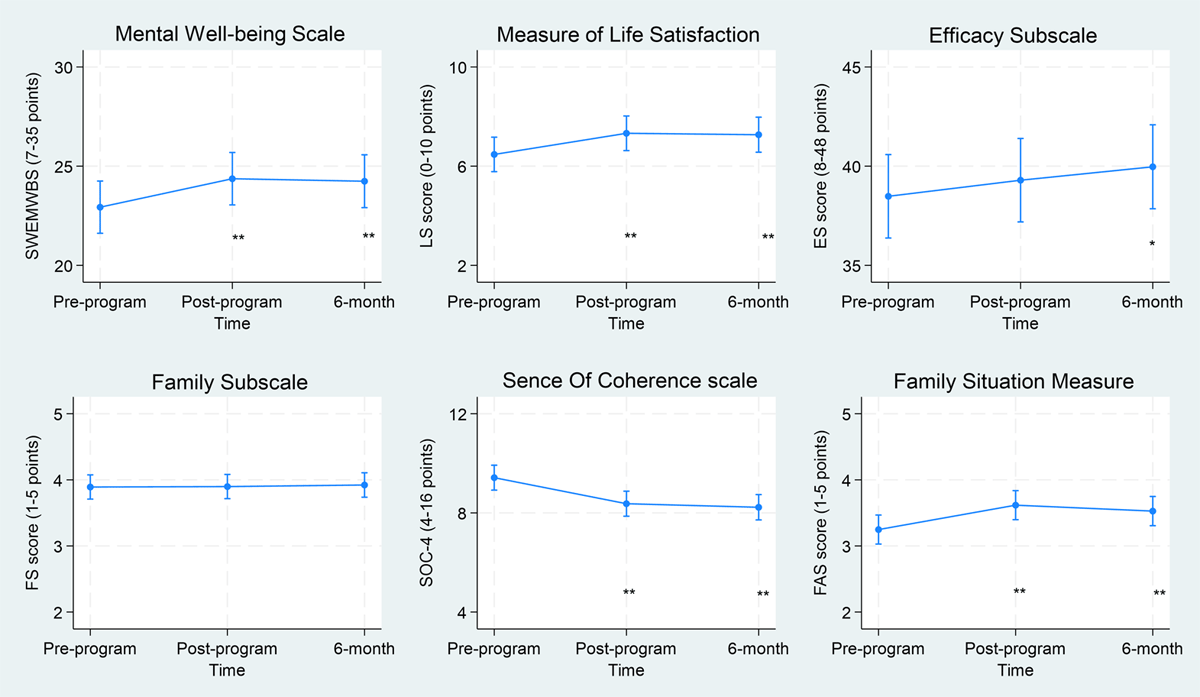
Figure 2
Margins plots illustrating predicted mean scores with 95% confidence intervals. Outcomes include parenting well-being (Short Warwick-Edinburgh Mental Well-being Scale), life satisfaction (Measure of Life Satisfaction), sense of coherence (Sense of Coherence Scale), parenting efficacy (Efficacy Subscale), family empowerment (Family Subscale), and family situation (Family Situation Measure) at each time point. Asterisks indicate statistically significant differences: p < 0.05 (*), p < 0.01 (**).
Table 1
Descriptive characteristics of parents and their children with cerebral palsy.
| VARIABLE | N |
|---|---|
| Characteristics of parents | n = 38 |
| Role | |
| Mother/father, n (%) | 19 (50) /19 (50) |
| Age groups, n (%) | |
| ≤40 | 32 (84) |
| >40 | 6 (16) |
| Highest level of education, n (%) | |
| Vocational Education or Short-cycle higher education | 14 (37) |
| Medium or long-cycle higher education | 24 (63) |
| Employment, n (%) | |
| Full-time | 25 (66) |
| Part-time | 7 (18) |
| Unemployed, leave, homemaker | 6 (16) |
| Characteristics of children | n = 19 |
| Sex, n (%) | |
| Girl, boy, n (%) | 8 (42)/11 (58) |
| Age group, n (%) | |
| 0–1 years | 13 (68) |
| 2–3 years | 3 (16) |
| 4–5 years | 3 (16) |
| 6 years | 0 (0) |
| Severity of cerebral palsy | |
| GMFCS Levels I | 5 (26) |
| GMFCS Levels II & III | 11 (58) |
| GMFCS Levels IV & V | 3 (16) |
[i] GMFCS, Gross Motor Function Classification System.
Table 2
Means, standard deviations, and range for outcome measures at pre-, post-program and six-month follow-up assessment.
| VARIABLE | n | MEAN | SD | RANGE (MIN, MAX.) |
|---|---|---|---|---|
| Short version of Warwick-Edinburgh Mental Well-being Scale (SWEMWBS) (7–35) | ||||
| Baseline (pre-program) | 38 | 22.9 | 3.6 | 17.4–32.6 |
| Post (three weeks) | 37 | 24.5 | 3.1 | 18.6–32.6 |
| Six-month follow-up | 35 | 24.3 | 3.1 | 19.3–35.0 |
| Life Satisfaction (0–10) | ||||
| Baseline (pre-program) | 38 | 6.5 | 2.2 | 2.0–10.0 |
| Post (three weeks) | 37 | 7.4 | 1.6 | 4.0–10.0 |
| Six-month follow-up | 35 | 7.3 | 1.6 | 4.0–10.0 |
| Parenting Sence Of Competence Scale (PSOC) | ||||
| Efficacy Subscale (8–48) | ||||
| Baseline (pre-program) | 37 | 38.6 | 6.3 | 19.0–45.0 |
| Post (three weeks) | 37 | 39.4 | 4.9 | 22.0–48.0 |
| Six-month follow-up | 35 | 39.9 | 4.8 | 26.0–47.0 |
| Family Empowerment Scale (FES) | ||||
| Family Subscale (1–5) | ||||
| Baseline (pre-program) | 37 | 3.9 | 0.5 | 2.8–4.8 |
| Post (three weeks) | 37 | 3.9 | 0.4 | 3.0–5.0 |
| Six-month follow-up | 35 | 3.9 | 0.4 | 2.9–4.8 |
| Sense Of Coherence scale (SOC-4) (4–16) | ||||
| Baseline (pre-program) | 38 | 9.4 | 1.2 | 7.0–12.0 |
| Post (three weeks) | 37 | 8.3 | 1.6 | 5.0–12.0 |
| Six-month follow-up | 35 | 8.2 | 1.3 | 4.0–11.0 |
| Family situation measure | ||||
| How is the situation in the family and around the child in general? (1–5) | ||||
| Baseline (pre-program) | 37 | 3.3 | 0.5 | 1.5–4.2 |
| Post (three weeks) | 37 | 3.6 | 0.5 | 2.0–4.7 |
| Six-month follow-up | 35 | 3.5 | 0.6 | 2.3–4.7 |
Table 3
Changes in outcome measures over time. The table presents beta coefficients, confidence intervals, p-values for changes, and percentage changes from pre- to post-program at three-week and six-month follow-up assessments.
| VARIABLE | BETA COEFFICIENTS (β) | CONFIDENCE INTERVALS (95%CI) | P VALUE | CHANGE % |
|---|---|---|---|---|
| Short version of Warwick-Edinburgh Mental Well-being Scale (SWEMWBS) (7–35) | ||||
| Baseline (pre-program) | 22.9 (reference) | |||
| Post (three weeks) | 1.5 | 0.7; 2.4 | <0.001 | 6.6 |
| Six-month follow-up | 1.3 | 0.4; 2.2 | 0.004 | 5.7 |
| Life Satisfaction (0–10) | ||||
| Baseline (pre-program) | 6.5 (reference) | |||
| Post (three weeks) | 0.9 | 0.3; 1.4 | 0.001 | 13.9 |
| Six-month follow-up | 0.8 | 0.3; 1.3 | 0.004 | 12.3 |
| Parenting Sence Of Competence Scale (PSOC) | ||||
| Efficacy Subscale (8–48) | ||||
| Baseline (pre-program) | 38.6 (reference) | |||
| Post (three weeks) | 0.8 | –0.3; 2.0 | 0.166 | 2.1 |
| Six-month follow-up | 1.5 | 0.3; 2.7 | 0.015 | 3.9 |
| Family Empowerment Scale (FES) | ||||
| Family Subscale (1–5) | ||||
| Baseline (pre-program) | 3.9 (reference) | |||
| Post (three weeks) | 0.01 | –0.12; 0.10 | 0.902 | 0.3 |
| Six-month follow-up | 0.03 | –0.16; 0.11 | 0.668 | 0.8 |
| Sense Of Coherence scale (SOC-4) | ||||
| Baseline (pre-program) | 9.4 (reference) | |||
| Post (three weeks) | –1.1 | –1.4; –0.7 | <0.001 | 11.7 |
| Six-month follow-up | –1.2 | –1.6; –0.8 | <0.001 | 12.8 |
| Family situation measure | ||||
| How is the situation in the family and around the child in general? (1–5) | ||||
| Baseline (pre-program) | 3.3 (reference) | |||
| Post (three weeks) | 0.4 | 0.3; 0.5 | <0.001 | 12.1 |
| Six-month follow-up | 0.3 | 0.2; 0.4 | <0.001 | 9.1 |
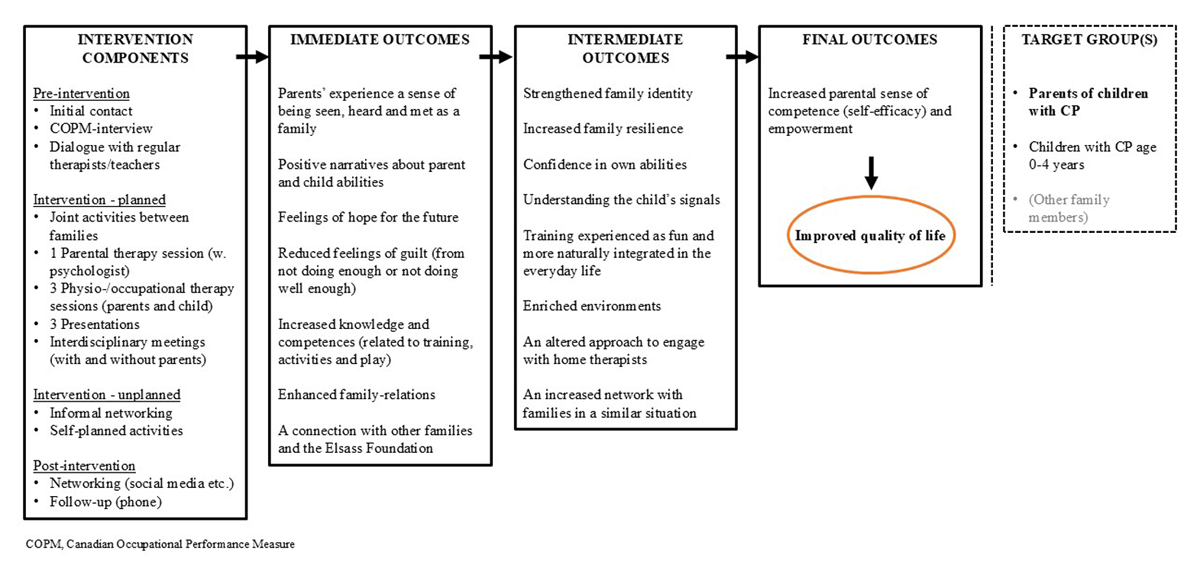
Appendix 1
A condensed version of the logical model used in evaluating the family-centered program good Start.