
Table 1
Sociodemographic characteristics of the participants.
| INTERVIEW | CITY OF RESIDENCE | EDUCATIONAL SETTING | LEVEL OF REQUIRED SUPPORTS |
|---|---|---|---|
| 1 | Santiago | Regular school with support | Moderate |
| 2 | Santiago | Regular school with support | Mild |
| 3 | Santiago | Regular school with support | Moderate |
| 4 | Santiago | Regular school with support | Mild |
| 5 | Santiago | Regular school with support | Mild |
| 6 | Viña del mar | Regular school with support | Mild |
| 7 | Rancagua | Special School | Moderate |
| 8 | Rancagua | Special School | Mild |
| 9 | Rancagua | Special School | Moderate |
| 10 | Viña del mar | Regular school with support | Mild |
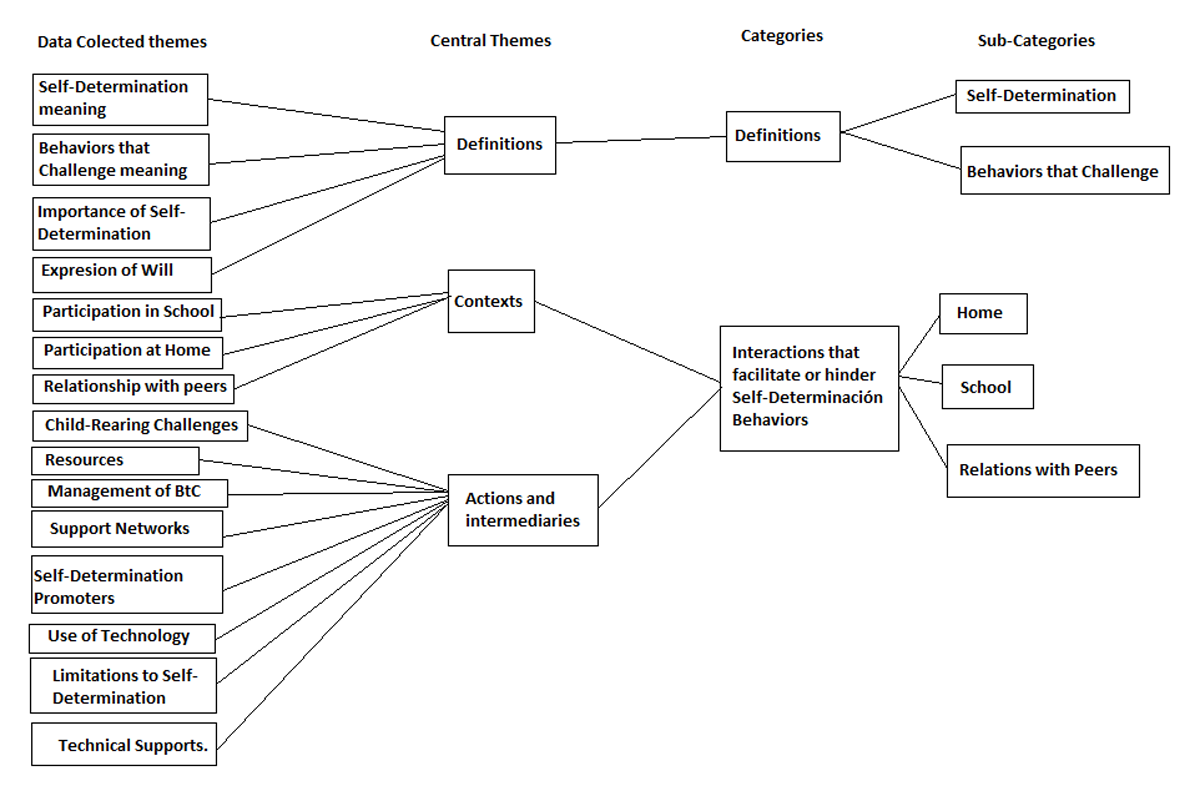
Figure 1
Sequential stages of data coding conducted for the final analysis.
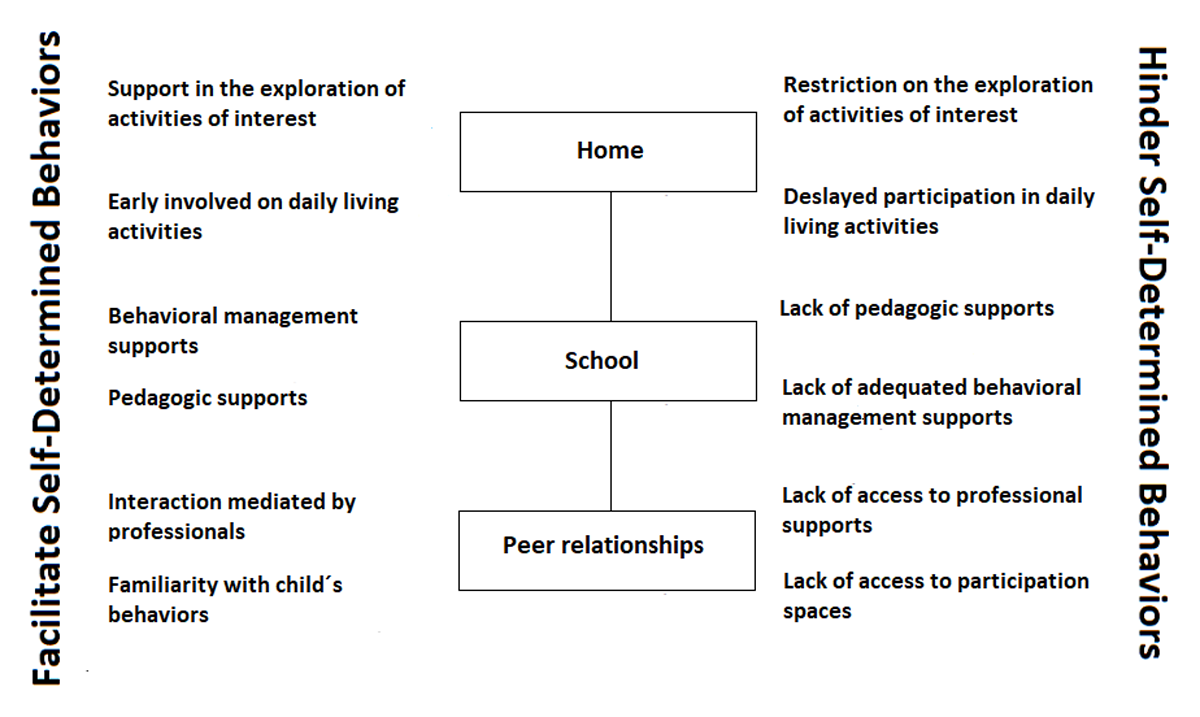
Figure 2
Graphic representation of the key findings that emerged from the interviews.