
Table 1
Population Trends on Croatian Islands at the Turn of the 21st Century.
| CENSUS YEAR | TOTAL POPULATION IN CROATIA | POPULATION CHANGE IN CROATIA | TOTAL POPULATION ON ISLANDS | POPULATION CHANGE ON ISLANDS (% CHANGE) | SHARE OF ISLAND POPULATION IN TOTAL POPULATION OF CROATIA (%) |
|---|---|---|---|---|---|
| 1991 | 4,784,265 | – | 124,306 | – | 2.60 |
| 2001 | 4,437,460 | –7.2 | 122,418 | –1.5 | 2.76 |
| 2011 | 4,284,889 | –3.4 | 124,745 | +1.9 | 2.92 |
| 2021 | 3,871,833 | –9.6 | 120,437 | –3.5 | 3.11 |
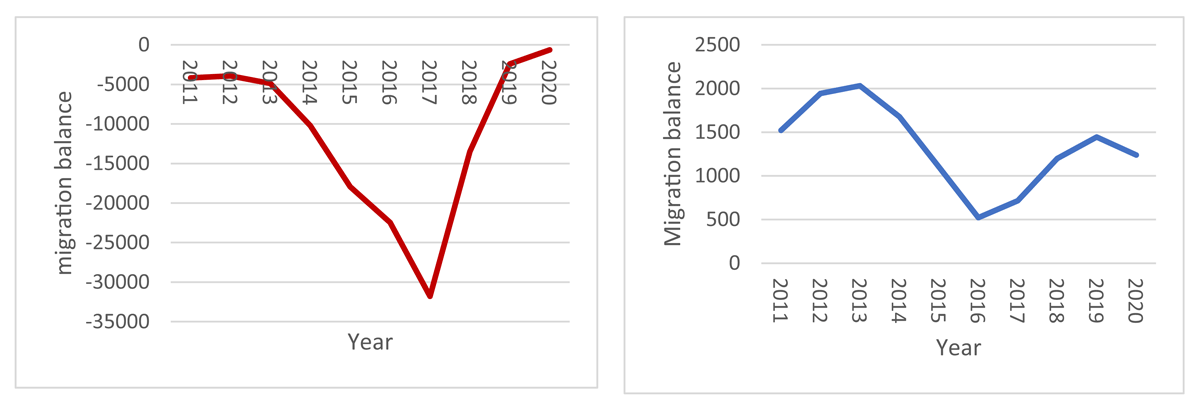
Figure 1
Migration balance in Croatia (left) and on Croatian islands (right) from 2011 to 2020.
Source: Croatian Bureau of Statistics (2020). Immigrant and emigrant population by settlements, 2011 to 2020.
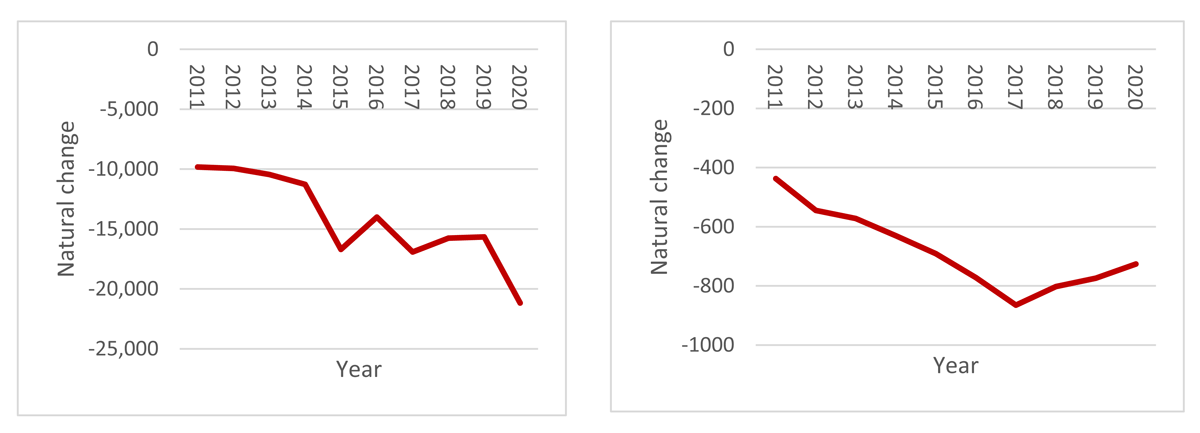
Figure 2
Natural change in Croatia (left) and on Croatian islands (right) from 2011 to 2020.
Source: Croatian Bureau of Statistics (2021).
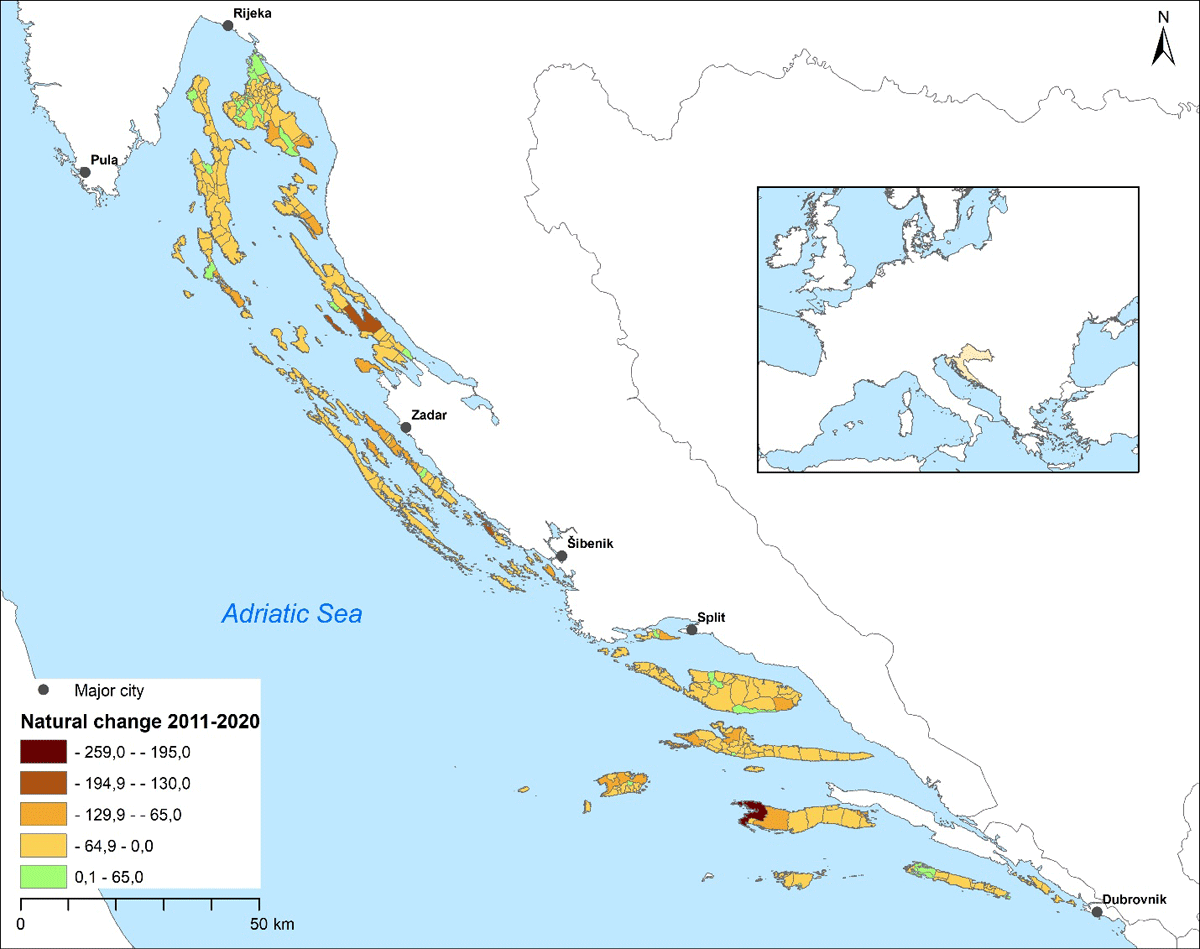
Figure 3
Natural change in island settlements from 2011 to 2020.
Source: Made using Croatian Bureau of Statistics, Vital statistics of the Republic of Croatia: Number of births and deaths from 2011 to 2020.
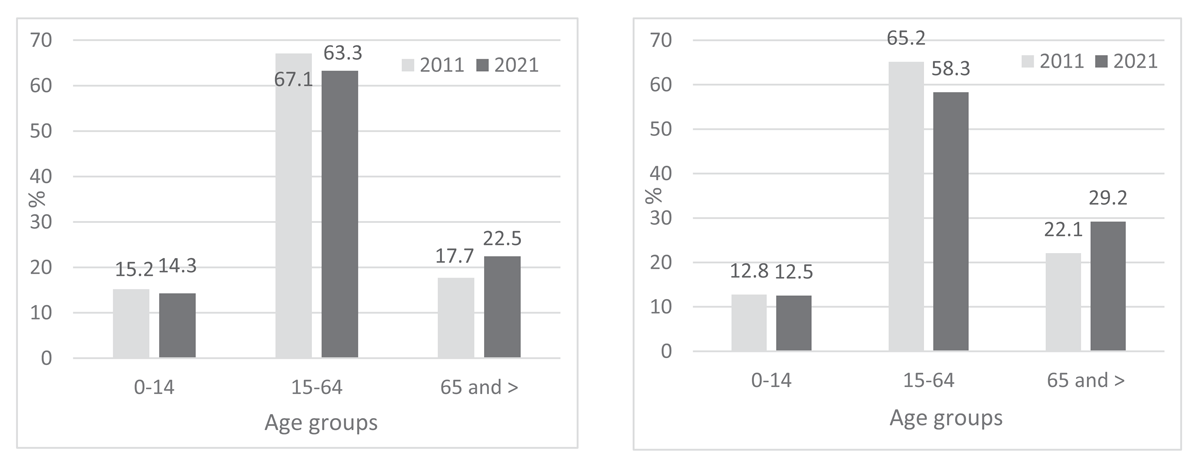
Figure 4
Population according to the main age groups in Croatia (left) and on the Croatian islands (right) in 2011 and 2021.
Source: Croatian Bureau of Statistics (2013); Croatian Bureau of Statistics (2021a).
Table 2
Total population vs. number of active island resident cards on 31 islands where cards number exceed the official population.
| ISLAND | TOTAL POPULATION IN 2021 (A) | NO. OF ACTIVE ISLANDER CARDS (27 JANUARY 2026) (B) | RELATIVE DIFFERENCE BETWEEN A AND B | ISLAND | TOTAL POPULATION IN 2021 (A) | NO. OF ACTIVE ISLANDER CARDS (27 JANUARY 2026) (B) | RELATIVE DIFFERENCE BETWEEN A AND B |
|---|---|---|---|---|---|---|---|
| Biševo | 23 | 38 | +65.2% | Premuda | 65 | 121 | +86.2% |
| Cres | 2849 | 2887 | +1.3% | Rava | 67 | 107 | +59.7% |
| Drvenik Mali | 119 | 153 | +28.6% | Rivanj | 23 | 43 | +87.0% |
| Drvenik Veliki | 170 | 251 | +47.6% | Sestrunj | 45 | 80 | +77.8% |
| Dugi otok | 1691 | 2098 | +24.1% | Silba | 344 | 431 | +25.3% |
| Ilovik | 106 | 118 | +11.3% | Susak | 139 | 189 | +36.0% |
| Ist | 146 | 186 | +27.4% | Svetac/Sv. Andrija | 2 | 3 | +50.0% |
| Iž | 516 | 653 | +26.6% | Šolta | 1975 | 2258 | +14.3% |
| Kaprije | 186 | 248 | +33.3% | Ugljan | 5666 | 6138 | +8.3% |
| Koločep | 231 | 255 | +10.4% | Unije | 66 | 74 | +12.1% |
| Lastovo | 747 | 754 | +0.9% | Vele Srakane | 4 | 7 | +75.0% |
| Lopud | 278 | 283 | +1.8% | Vis | 3287 | 3322 | +1.1% |
| Molat | 190 | 267 | +40.5% | Zlarin | 293 | 302 | +3.1% |
| Olib | 117 | 146 | +4.8% | Zverinac | 55 | 68 | +23.6% |
| Ošljak | 35 | 54 | +54.3% | Žirje | 147 | 191 | +29.9% |
| Pašman | 2884 | 3053 | +59% | TOTAL | 22466 | 24788 | +10.3% |
[i] Source: Croatian Bureau of Statistics (2021a). Population by age and sex, by settlements, 2021 Census; Number of of active island resident cards, Agency for Coastal Line Maritime Transport, January 27th 2026.
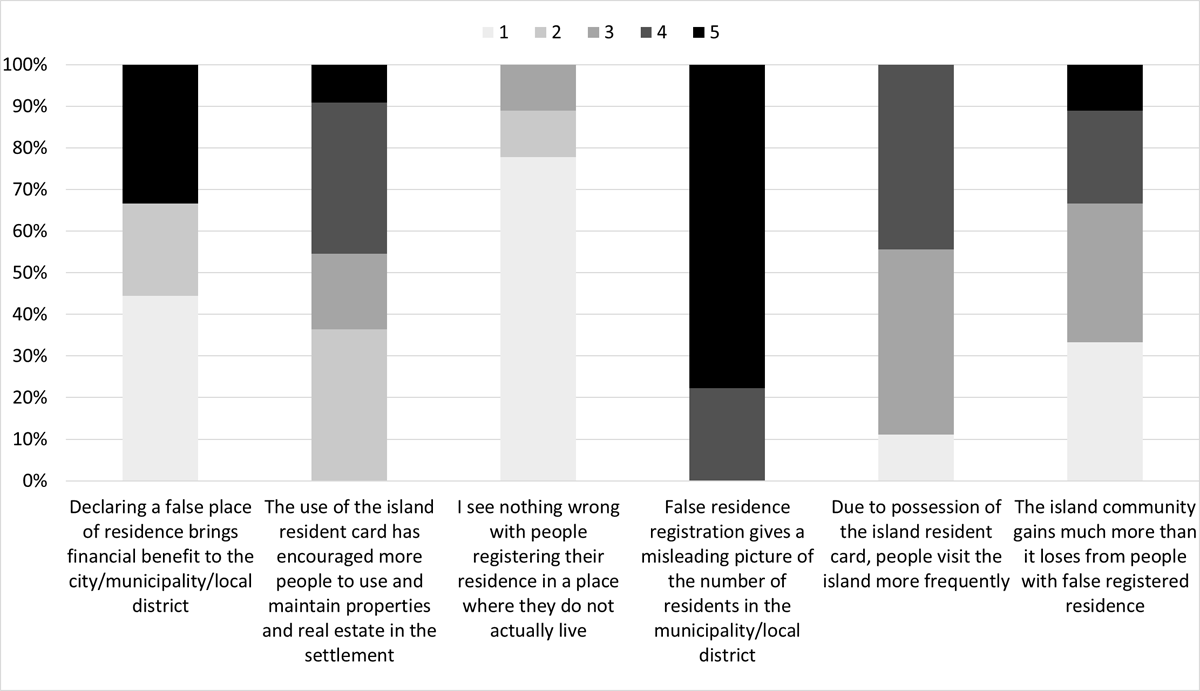
Figure 5
Perceptions of island mayors, municipal heads, and local council chairpersons on the presence and impact of fictitious residents in their communities. Percentage of responses by Likert scale rating (1 = Strongly Disagree, 2 = Disagree, 3 = Neither Agree nor Disagree, 4 = Agree, 5 = Strongly Agree).
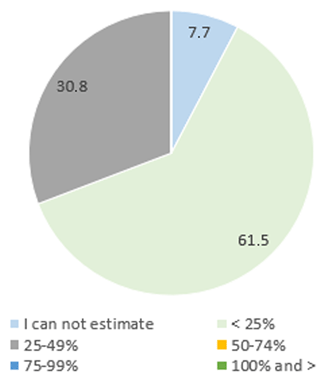
Figure 6
Respondents’ estimates of the proportion of residents with false registrations within the total population of their towns, municipalities, or local districts.