
Table 1
Groups’ Average Pre-Test Scores, After Imputation, for Participants Responding at Pre-Test, Pre-Test and Post-Test, and Pre-Test and Follow-Up.
| MEASURE | CIP | IDI | CONTROL |
|---|---|---|---|
| Pre-test respondents (N = 468) | |||
| CIP-56 | 168.0 | 167.1 | 171.4 |
| CDSE-SF | 91.8 | 91.7 | 89.6 |
| CTI* | 88.6 | 93.0 | 90.9 |
| SWLS | 26.9 | 27.2 | 26.3 |
| N | 112 | 112 | 244 |
| Pre- and post-test respondents (N = 336) | |||
| CIP-56 | 166.5 | 166.7 | 170.2 |
| CDSE-SF | 92.3 | 91.5 | 89.9 |
| CTI* | 89.1 | 94.0 | 91.3 |
| SWLS | 26.7 | 27.2 | 26.3 |
| N | 74 | 87 | 175 |
| Pre- and follow-up respondents (N = 225) | |||
| CIP-56 | 168.4 | 167.2 | 168.5 |
| CDSE-SF | 91.2 | 91.5 | 91.1 |
| SWLS | 26.6 | 27.3 | 26.7 |
| N | 51 | 52 | 122 |
[i] Note. CIP-56 = Career Indecision Profile, CDSE-SF = Career Decision Self-Efficacy-Short Form, CTI = Career Thoughts Inventory, SWLS = Satisfaction With Life Scale.
*CTI mean scores are calculated from a 1 to 4 response scale, but not the traditional 0 to 3 scale.
Table 2
Short Term Effects of Group on Participants’ Progress on Four Outcome Measures (Univariate ANCOVAS).
| MEASURE | F | DF | P | η2 |
|---|---|---|---|---|
| CIP-56 | 2.682 | 2, 325 | .070 | .016 |
| CDSE-SF | 5.192 | 2, 325 | .006 | .031 |
| CTI | 1.031 | 2, 325 | .358 | .006 |
| SWLS | 5.957 | 2, 325 | .003 | .035 |
[i] Note. CIP-56 = Career Indecision Profile, CDSE-SF = Career Decision Self-Efficacy-Short Form, CTI = Career Thoughts Inventory, SWLS = Satisfaction With Life Scale.
N = 336.
Table 3
Adjusted Mean Difference Scores by Group at Post-Test (N = 336).
| MEASURE | CIP (N = 74) | IDI (N = 87) | CONTROL (N = 175) |
|---|---|---|---|
| M (SE) | M (SE) | M (SE) | |
| CIP-56 | –12.36 (2.63) | –4.90 (2.31) | –6.70 (1.74) |
| CDSE-SF | 6.30 (1.32)a | 2.32 (1.16) | 1.51 (.87)a |
| CTI | –.4.89 (1.99) | –1.31 (1.75) | –3.52 (1.32) |
| SWLS | 1.96 (.49)b | –.16 (.43)bc | 1.12 (.32)c |
[i] Note. CIP-56 = Career Indecision Profile, CDSE-SF = Career Decision Self-Efficacy-Short Form, CTI = Career Thoughts Inventory, SWLS = Satisfaction With Life Scale.
SE = Standard Error. Progress from pre-test is indicated by lower scores for CIP-56 and CTI and higher scores on CDSE-SF and SWLS.
ap < .001. bp < .01. cp < .05.
Table 4
Adjusted Mean Difference Scores by Group At Follow-Up (N = 225).
| LIST | CIPa | IDIb | CONTROLc |
|---|---|---|---|
| M (SE) | M (SE) | M (SE) | |
| CIP-56 | –12.39 (4.78) | –4.01 (4.59) | –2.50 (3.32) |
| CDSE-SF | 1.75 (1.96) | –.25 (1.88) | –.32 (1.36) |
| SWLS | –.24 (.66) | –1.13 (.64) | –.49 (.46) |
[i] Note. CIP-56 = Career Indecision Profile, CDSE-SF = Career Decision Self-Efficacy-Short Form, SWLS = Satisfaction with Life Scale. Progress from pre-test is indicated by lower scores for CIP-56 and higher scores on CDSE-SF and SWLS.
SE = Standard Error.
na = 51. nb = 52. nc = 122.
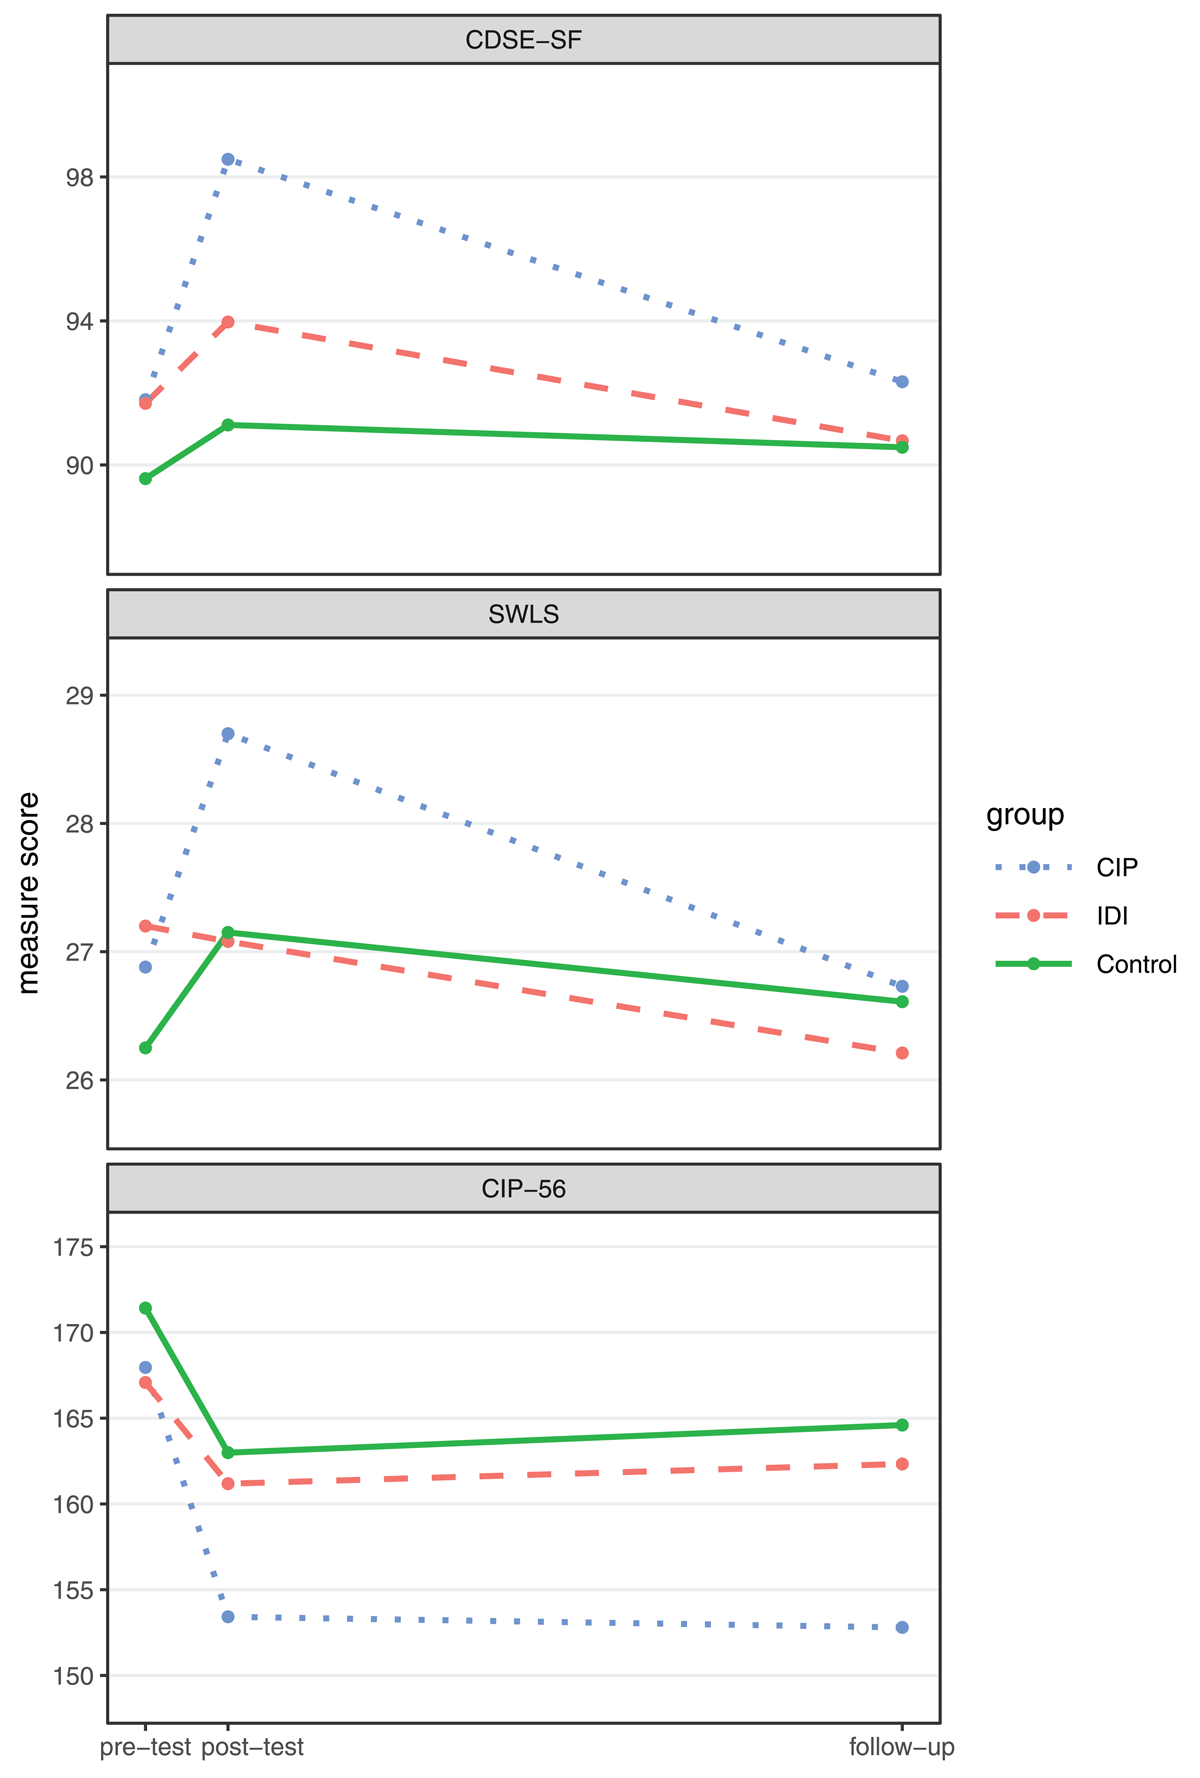
Figure 1
Group means on CSDSE-SF, SWLS and CIP-56 at Pre-Test, Post-Test and Follow-Up.