
Table 1
Research-based design process in the Feeler prototype design.
| Research stage | Description | Main outcomes |
|---|---|---|
| Contextual Inquiry | 6 semi-structured interviews with graduate students; 4 subject-expert interviews 4 days of observation and field note-taking in a university library environment Literature review 3 focus group interviews (n = 15) conducted with graduate students to explore the relation between learning, well-being, and physiological data Questionnaire distributed to 14 graduate students before and after the participatory design sessions | – Recognition of self-awareness and meditation as valuable skills in learning and well-being – Challenges in reflecting and focusing on the academic task due to constant access to social media – Gap between research and practice regarding the use of physiological data in learning – Positive attitudes regarding self-monitoring |
| Participatory Design | 3 participatory design workshops (n = 14) with graduate students; a design game was created to improve communication with the participants and support the data collection 2 presentations and feedback sessions during the lab’s open door event on the first 2 lightweight prototypes made out of cardboard and plywood | Participants’ artifacts had a shared interest in proposing: – Design solutions that respect data ownership and privacy – Other forms of self-monitoring (emotions, time dedicated, etc.) – Reflection as a separate task at the end of the process |
| Product Design | Design studio work produced 4 prototypes, 2 of which are functional | – Personas – Scenarios with use cases – Feeler paper prototype – Feeler plywood prototype |
| Prototype as Hypothesis | Production of functional prototypes in a Fab Lab (hardware) and design studio (software) | – Feeler v.1.0 – Feeler v.2.0 |
Table 2
Coding template used to analyze the qualitative data collected from the prototype testing.
| C1a: No Expectations | The person does not express a particular interest, question, or expectation about the prototype or the EEG data. |
| C1b: Not Understanding | The person cannot make sense of the EEG values or the way these data are visualized. |
| C2a: Integration | The user relates the data to what is already known. The user seeks relations among the data. |
| C2b: Curiosity | The person expresses interest in the data or in how certain activities affect her or his mental states. The person formulates questions and identifies aspects she or he would like to know more about. |
| C3a: Puzzlement | The participant feels surprised when he or she discovers values that do not correspond to her or his previous assumptions. The participant is unable to explain why the data monitored by the system differ from what she or he experienced during the session. |
| C3b: Appropriation | The person interprets the data (makes inferences) and builds her or his explanation for how the raw data connects to her or his experiences. The person identifies how the prototype might benefit her or his learning process. The person also determines the authenticity of the ideas and feelings that resulted during the session. |
| C3c: Transformation | The user’s views about how his or her brain activity affects her or his study activity have changed. This new understanding motivates the user to make a change in her or his study habits or practices. |
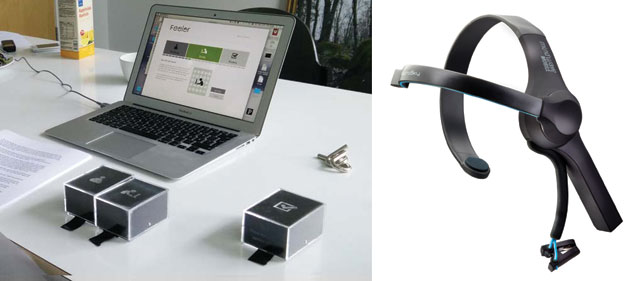
Figure 1
Feeler blocks, digital app, and EEG monitoring device.
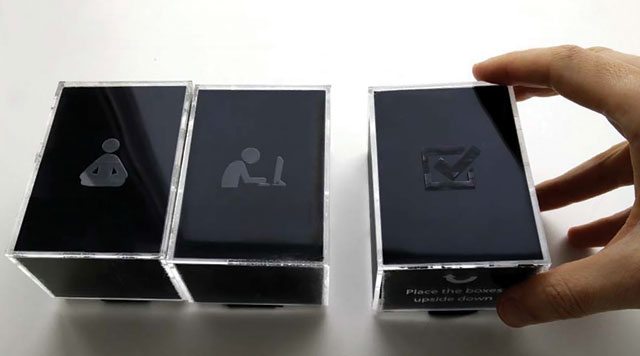
Figure 2
To connect the Feeler smart objects, the user needs to place them next to each other.
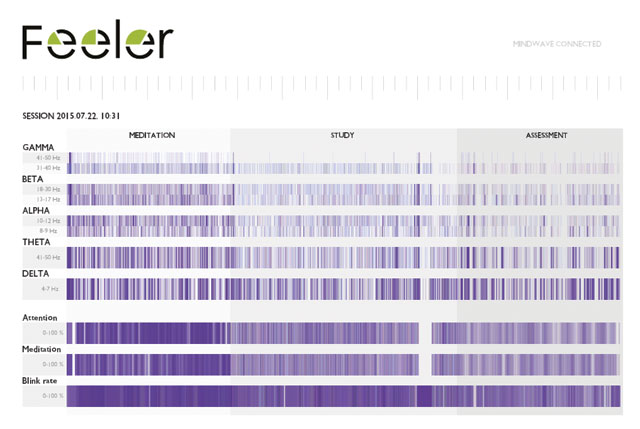
Figure 3
Screen capture of the data visualization for one session.