
Table 1
Summary of data collected and its use in the design and analysis of the problem-identification process.
| DATA TYPE | DESCRIPTION | USE IN DESIGN | USE IN ANALYSIS |
|---|---|---|---|
| Grant Application | Written document | Planning the partnership | Record of the initiation team’s plan for the NIC, with whom, and around what problem |
| Participant Observation | Initiation team observations | Record for ideas to pursue, people to contact | Used to identify features |
| Emailed reflections from convening participants | Follow up emails asking for feedback on the meeting and asking them to nominate schools or educators that we should follow up with | Nominated connections were contacted for listening conversations. | Feedback was used to identify what features stood out to participants. |
| Expert Convening Report | Summary of the organization of the meeting, attendees, major themes | The summary was used for initial definitions and tensions. | The Description and summary provided a set of features and tracked evolving understanding of the problem-solution space. |
| Google sheet with notes from phone calls and visits | After each listening conversation, we would fill out a form with the person’s answers, any other notes, and whether this contact would be a good follow up for the NIC. (See Appendix A for the question protocol.) | This document was the focus of meetings to make sense of what we were hearing in the statewide conversations. | The spreadsheet of responses provided a record of who from the initiation team was doing the phone calls and visits, who was contracted, and a record of the content of their conversation. |
| Meeting notes | One Google document, including when the meeting was, who was present, the agenda, and notes on conversation, and shared with the team for collaborative input and/or correction | Record of decisions, follow up actions, and debriefs | The meeting notes provided a chronology of actions and sequence of problem articulation. |
| Research Group Meeting Presentation and Meeting Summary | The team created a set of slides to describe the listening process and present the three possible problem-solution pairs. After the meeting, I wrote up a description of the conversation. | The slides generated conversation about which problem-solution pair would be selected. The meeting summary was used to share the decision with team members who were not present. | The presentation slides plus the meeting summary provided the primary source of data for how we made the decision to select conferring protocols. |
| Partnership Memo | At the conclusion of NIC activities, we wrote memos summarizing PiPNIC activities. I wrote a semi-structured, meta-design memo, focused on network-level activities. The memo integrated data sources described in this table and the team cross-checked each memo for accuracy. | Not applicable | Triangulated source of the chronology and features of activities |
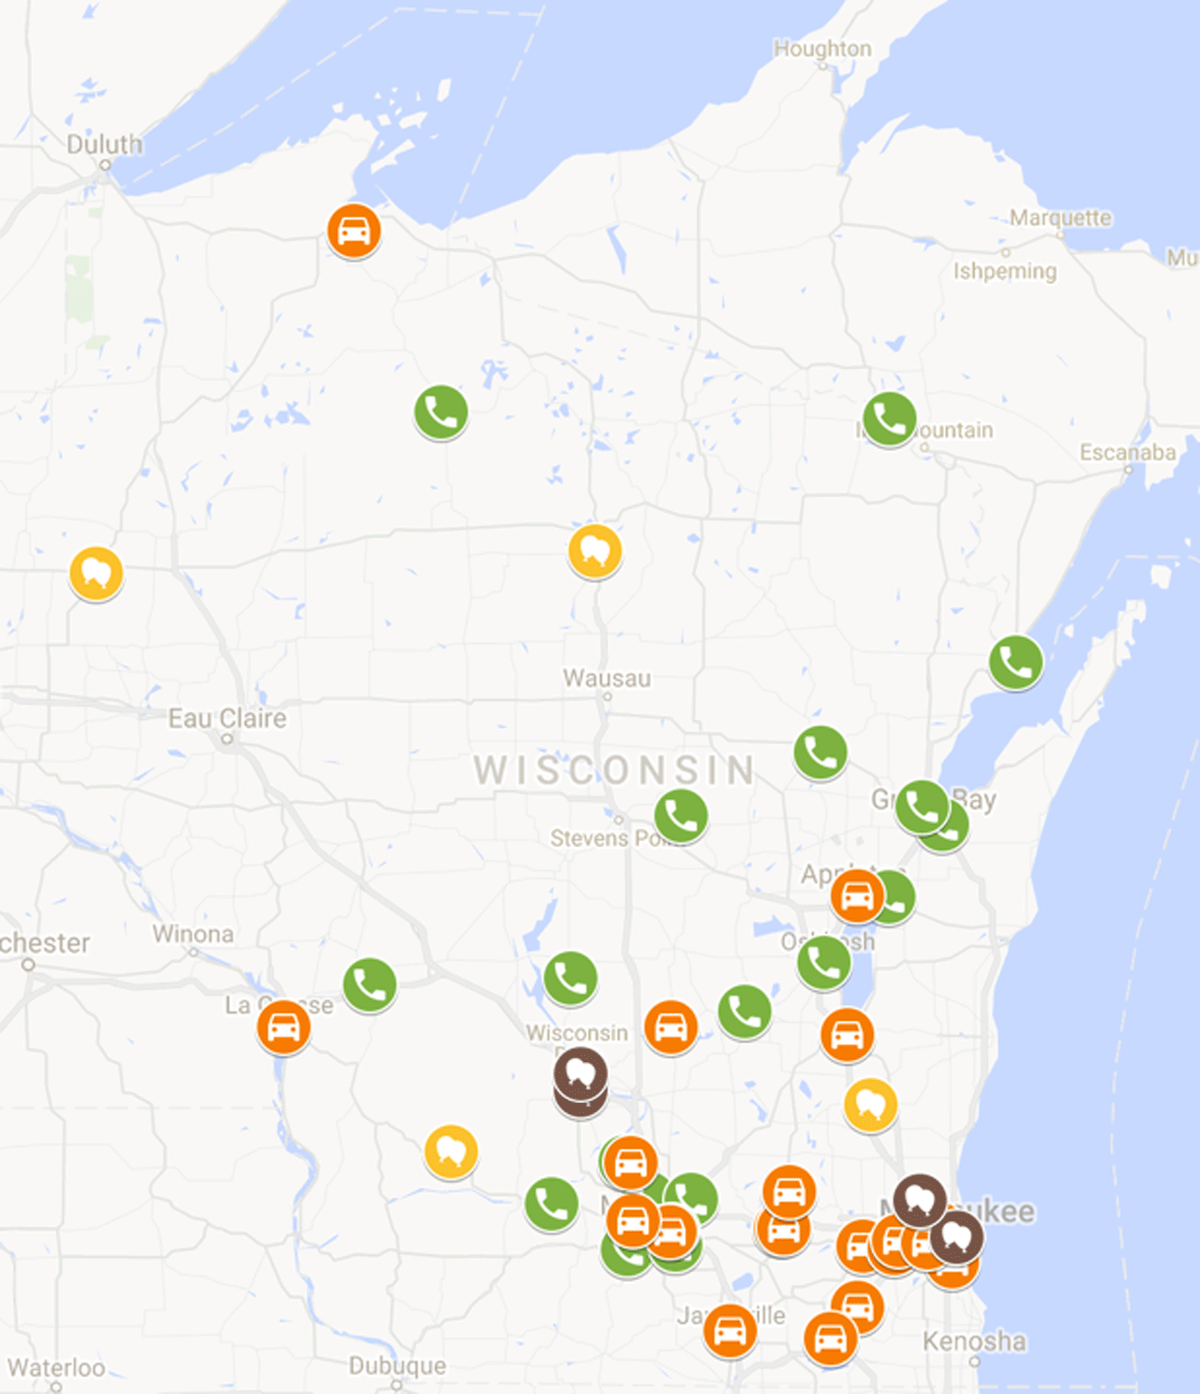
Figure 1
Map of listening conversations: phone calls (green phones), data coach conversations (yellow balloons), visits (orange cars), and conferences (brown balloons).
Table 2
Sequence of questions that the initiation team asked in conversations with educators and in conversation with each other.
| DATE | SOURCE | QUESTION | OPERATOR |
|---|---|---|---|
| 7 Jun 2016 | Team Meeting Notes | “How do teachers know when students are learning?” | How |
| “What are the design opportunities for schools to improve their ability to know that students are learning?” | What | ||
| 29 Jul 2016 | Convening Presentation Slides | “What kinds of data, systems, and tools should be included in a SLDS?” | What |
| “What are current data practices?” | What | ||
| 19 Aug 2016 | Listening Tour Questions | “What kinds of things are you excited about in terms of student learning this fall?” | What |
| “Tell us about the kinds of information your school collects to document student learning?” | Tell us about | ||
| “How does your team define student learning in your school?” | How | ||
| “What role do students play in those discussions of data?” | What | ||
| “How do students have an opportunity to show what they know?” | How | ||
| 12 Sep 2016 | Initiation Team Meeting Notes | “What kinds of schools take the leap to helping students use data to guide their own learning?” | What |
| “What data do teachers collect about student learning and how are students using their own learning data?” | What and how | ||
| 7 Nov 2016 | Initiation Team Meeting Notes | “What are the micropieces that [teachers] are already assessing in their goal setting/initial conversations, check in conversations, and project finalization meetings?” | What |
Table 3
Summary of reasons for and against each problem-solution pair.
| POSSIBLE PROBLEM-SOLUTION PAIR | REASONS TO SELECT THIS PROBLEM | REASONS NOT TO SELECT THIS PROBLEM |
|---|---|---|
| Develop a survey of validated measures of non-cognitive learning |
|
|
| Standardize the student personalized learning plan (PLP) to incorporate state and local data |
|
|
| Develop a common protocol for conferring |
|
|
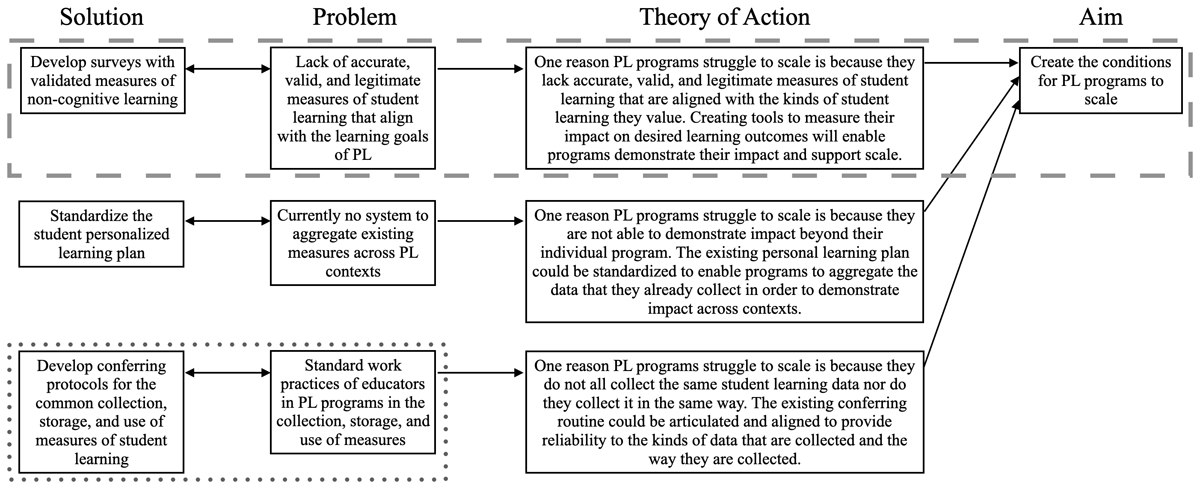
Figure 2
Map of the three solution-problem pairs, including their theory of action or how them might impact the aim. The first pair, highlighted in the dashed line, was the problem initially conceived by the research team, whereas the third pair, highlighted by the dotted line, was the pair that the initiation team selected.