
Introduction
In today’s competitive work environment, where information and circumstances are constantly evolving while time is still limited, individuals are expected to keep up with that pace. These expectations, in other words, 21st-century abilities are regarded as the ability to take initiative, to critically think, to learn how to learn, to work in cooperation, to pose questions, and to self-regulate (P21, 2019). In the constructivist approach, individuals are often not passive recipients, but play an active role in their learning; teachers are often not transmitters, but mainly guides in learning; learners obverse realities in the outer world while being involved in the formation process of information through social interaction. Reflecting educational systems, which are designed with the constructivist approach, on education processes is at least as important as enabling students to acquire these abilities. The teaching system that will be used while describing the design of Jonassen’s (1999) “constructivist learning environment design framework (CLEs)” environment, should also encourage learners to solve problems and produce. Through design-based learning, which is effective in enabling learners to obtain 21st-century abilities and whose popularity has been increasing in the past few years, learners improve their learning skills by developing an application, software, or product in a design-based manner. Learners’ technological abilities must be competent enough for design-based learning to be effectively implemented in a classroom environment. In the literature, there are various scales, which assess technological competency, such as those of ISTE (2016), European Commission (2013), Europass (2015), ECDL, n.d., and NETg, n.d.. However, these scales have been developed with items, which are not based on an educational framework and only assess competencies related to hardware, operating system, and application software. This study aims at determining competencies areas, which will build on the technological competencies of learners studying in design-based learning environments based on constructivist teaching approaches, and developing a scale that will assess the aforementioned.
Conceptual Framework
Design-based learning (DBL), which helps learners to obtain 21st-century abilities such as problem-solving, collaborative work, active learning, and critical thinking (Chandrasekaran et al., 2013), is a technique in which learners use design methodology to produce creative and innovative practical solutions to problems (Nelson, 2004). Design-based learning environments, where learners create their cognitive structures as a result of the design processes (Kolodner et al., 1998), increase learners’ motivation as well as interest and curiosity in the subject (Doppelt & Schunn, 2008; Gardner, 2012) while improves academic success by helping learners develop creative and critical thinking skills (Doppelt, 2009). DBL increases not only academic performance but also associates real-life problems and experiences with teaching programs (Lee & Breitenberg, 2010).
DBL is an approach that is effective in teaching and learning complex and difficult subjects (Apedoe et al., 2008). In their 8-week study, in which they used the DBL approach in biology education, Ellefson et al. (2008) found out that DBL is an effective tool for learners to learn complex subjects, especially such as biology. In the research conducted by Mehalik, Doppelt, & Schuun (2008) with the participation of 10 teachers and 587 eighth grade students, in which learners designed an electrical alarm system for 4 weeks, it was found out that the DBL approach is effective in obtaining basic science conceptions and retention. In their study on transferring information obtained by learners via DBL to a design problem, Fortus, Krajcik, Dershimer, Marx, & Mamlok-Naaman (2005) observed that 149 students succeeded at learning subject content and transferring the learned information to a new design assignment. In a study conducted by Kim et al., (2015), which thoroughly investigated DBL activities with the exploratory method and the participation of fifth-grade students, it was found out that education that is designed with the DBL approach is interesting, enjoyable, and contextual. Furthermore, learners in DBL environments obtain creative thinking skills as a result of design activities (Davis, 1998; Kafai, 1995; Seitamaa-Hakkarainen, 2011).
DBL creates the basis of constructivist learning since it requires the production of a product, teachers to support learners to be active, to work in collaboration as well as to socially interact with each other in the process of learning (Kafai, 1995; Ke, 2014). CLEs framework is an ideal one to design DBL environments with its expectations from teachers and students as well as its explanatory descriptions about the process of learning. Learning is organized around a project or problem instead of subject content and thereby enables learners to acquire critical thinking skills and self-learning management skills (Duffy & Cunningham, 1996).
In the design of DBL activities created based on constructivist learning, information and communication technology is used to both support the process and facilitate learning. In such learning environments, technology enables the communication channels between learners to be increased and collaborative learning to continue outside the classroom (Feyzi Behnagh & Yasrebi, 2020; Levy, 1997). The technology that enables the simulation of difficult and dangerous situations allows the efficient use of time. Thus, with technology, students can focus more on problem-solving or product development. For this reason, it is important to determine the technologies that will be needed in DBL environments and to build on the competencies of these technologies to be used by students. In line with this need, the technologies that can be used in the stages of the CLEs framework have been tried to be determined by scanning the studies that are the subject of technology in the literature. CLEs framework has five essential components shown in Figure 1.
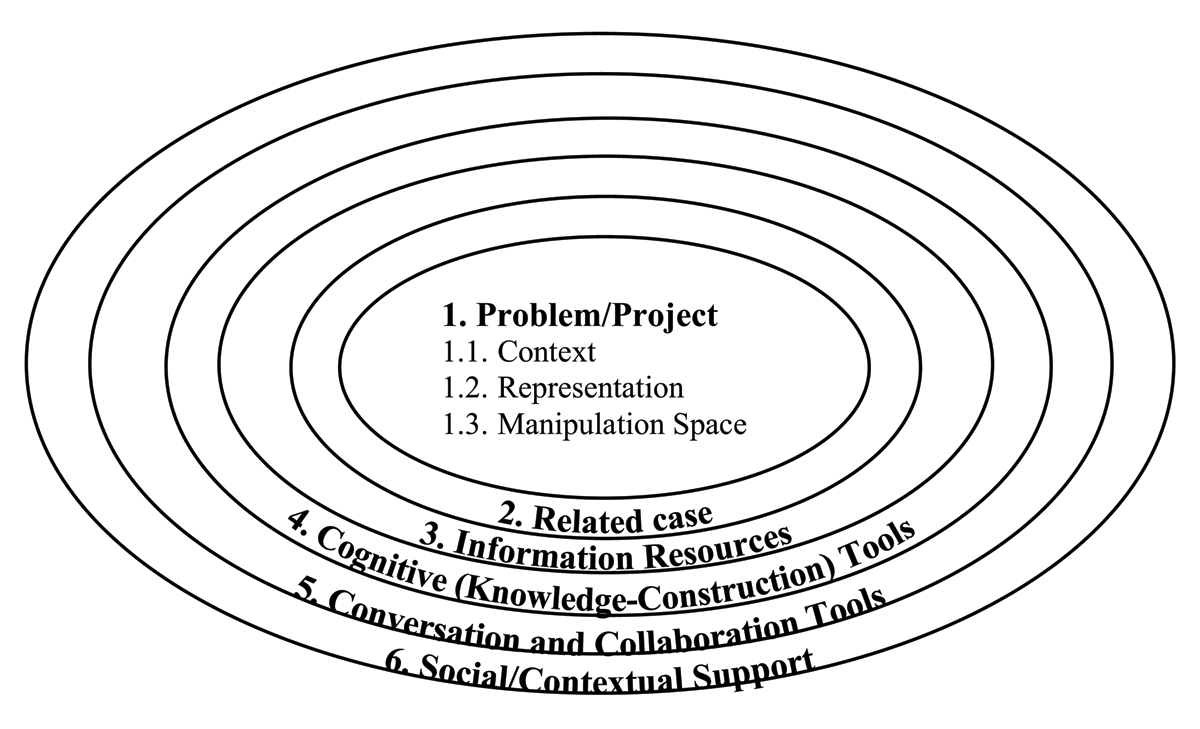
Figure 1
Jonassen’s Framework for a Constructivist Learning Environment (Jonassen, 1999).
Problem/Project
The focus of CLEs comprises a question, problem, or project (Jonassen, 1999). Learning is organized around a project or problem instead of subject content and thereby enables learners to acquire critical thinking skills and self-learning management skills (Duffy & Cunningham, 1996).
Problem context
Problem context refers to the environment of a problem or the environment, in which the project is formed or comes to life, as well as the effective elements and stakeholders of this environment. Problem database websites, through which students and teachers can search for and filter problem descriptions, are appropriate for revealing the context of a problem. Thus, students will have a summary view of solved problems, unsolved problems and their possible solutions, progress reports, and comments.
Problem representation
Problem representation is the presentation of the stakeholders, environment, and elements of the problem explained in the context, from various aspects to the students. Podcasting, which can be used for observing these aspects, enables learners to learn fundamental conceptions, while; allowing learners to observe the relationship between these conceptions and real-life (Besser et al., 2021; Mitchell et al., 2021; Moryl, 2013). Concept maps, which are used as an environment for constructivist learning activities (Cañas et al., 2003), is a significant tool to reveal the meta-cognitive skills of learners (Brondfield et al., 2019; Marzano & Miranda, 2021; Novak, 1990; Shin & Jeong, 2021).
Manipulation space
Problem manipulation space is an environment where learners can test and see the results of the hypotheses they developed for the solution to the problem or the phases they developed for the project. The technologies to be used in this phase vary according to the content of the studied subject. These technologies could be data analysis software, which is one of the simulation tools of the virtual world, or a manipulation media for electronic spreadsheet software.
Related cases
This element is for improving learners’ experiences of determining a solution strategy, which may be missing for a newly encountered problem. Video search engines, which improve critical thinking skills and in-depth learning (Clifton & Mann, 2011; Palla & Sheikh, 2020; Ruggieri, 2020), are appropriate for determining which solution strategy is the most suitable for the problem. Also, video search engines enable learners to engage in the learning environment while allowing them to see the elements of the environment in detail (Guo et al., 2014; Halpern et al., 2020).
Information Resources
It is possible to include many technologies in the learning environment when it comes to information resources, which are required to understand the problem. Technologies such as search engines, which improve individual’s self-regulation skills while providing enriched search strategies with peer collaboration (Lazonder, 2001; Mracek, 2019), e-museum, which can be used for understanding difficult subjects and developing different perspectives (Çalık et al., 2016; Neill, 2008), online questionnaires, which can be used to collect data from individuals living in different geographies (Sue & Ritter, 2011), and RSS, which is the digital way to obtain information about course-related and non-course-related subjects, are the source technologies that learners can obtain information about the problem.
Cognitive (Knowledge-Construction) Tools
Cognitive tools enable learners to focus on the cognitive processes that are relevant to the solution to the problem. Language translation software, which is quick and free-of-charge at translating foreign languages that are obstacles for the academic success of learners (Chung & Ahn, 2021; Lee & Briggs, 2021; Muzdalifah & Handayani, 2020; van Rensburg et al., 2012), is one of the technologies helping students focus on the problem. Office tools are essential technologies used by learners for writing reports on a problem as well as presenting and creating graphics. Multimedia creation and editing software, which are required for editing multimedia collected in the process of data collection, are sought by learners in the process of problem-solving. Digital calendar applications are necessary for learners to focus on collaborative solution processes throughout the research process.
Conversation and Collaboration Tools
Conversation and collaboration tools refer to the media, which will enable social interaction among learners as well as access to, storage, and editing of information collected through such interactions. It is believed that social media, which is frequently used by students in all areas of their everyday life, can be used as an effective tool for learning (Bozanta & Mardikyan, 2017). In their study, which lasted for 8 weeks with the participation of 40 graduate students, Zhang, Chen, de Pablos, Lytras, & Sun (2016) discovered that social media increases teamwork in collaborative learning environments. E-mails are convenient communication environments for collaborative learning since they enable interaction between two learners or between the learner and teacher (Warschauer, 1995). Online communication applications support learning and teaching processes by developing collaborative works in learning environments (Cassany et al., 2019; Kapoor et al., 2019; Ngaleka & Uys, 2013; So, 2016). In their exploratory study, Bouhnik & Deshen (2014) found out that as a learning platform, WhatsApp has positive aspects such as access to educational materials, promoting sharing among learners, creating dialogue, easy communication with teachers, and continuation of extracurricular learning. It is believed that cloud technologies increase the quality of education (Arroyo et al., 2020; Gurung et al., 2016) by supporting collaborative studying (Bakla, 2020; El Mhouti et al., 2016; Savelyeva et al., 2021) while maximizing the share of resources in a learning environment. In the study conducted by Lin, Wen, Jou, & Wu (2014), which evaluated the education delivered in cloud-based learning environments through tests, questionnaires, and interviews, it was concluded that learning environments strengthen the reflection skills of learners while increasing their motivation. Google Doc provides a collaborative editing environment for learners. In their study, Ishtaiwa & Aburezeq (2015) concluded that Google Docs improves student-student, student-teacher, student-content, and student-interface interaction.
Wikis, which refer to web pages with content that can be created and edited by one person or multiple people, are also an effective way to collaboratively create information (Duffy & Bruns, 2006; Kim & Kim, 2020; Li et al., 2021). In their study, in which the impact of the wiki on learning outputs is examined by conducting a meta-analysis on 25 pieces of research, Trocky & Buckley (2016) found out that learners’ writing and collaborative working skills have increased. Forums, where dialogue occurs through discussions and messages, are effective tools in promoting communication and cooperation in learning environments (Ioannou et al., 2015). In the research carried out by Shana (2009) with the participation of 54 distance-education students, it was detected that the course success of the experimental group, which received an education with a discussion forum, was better than that of the control group, whose education did not include a discussion forum, moreover; it was found out that the attitude of the first group was more positive towards distance-education than the attitude of the other group. Blogs provide collaborative learning environments that increase social interaction and cognitive engagement (Erdogdu & Eskimen, 2020; Gurer, 2020; Noel, 2015). In the study carried out by Amir, Ismail, & Hussin (2011) with the participation of 80 students taking English language teaching course, they analyzed the questionnaire and blog entry records and concluded that blogs improve learners’ collaborative writing skills while promoting high autonomy in peer interaction. E-portfolios offer not only a collaborative learning environment for learners (Habeeb & Ebrahim, 2019; Lam, 2020) but also support their career development (Luchoomun et al., 2010). In the study conducted by Jimoyiannis & Tsiotakis (2016) with the participation of 24 undergraduate students, it was found out that e-portfolios increase motivation and engagement by supporting learners’ collaborative studies.
By allowing mass communication, video conferences enable cooperation among learners (Nilsen, 2011). With their features such as making edits by users and adding multimedia, geographical information systems, which emerged as a result of the impact of Web 2.0 technologies on mapping, have been collaboratively used in learning environments for the past few years. Google Maps provides a collaborative study environment that improves learners’ reading, writing, speaking, and listening skills, as a result of the audio, visuals, videos, and routes left by learners on an interactive map as well as their edits on the map (Sokolik, 2011). 3-D virtual worlds, which promote learner-learner and learner-content interaction (Warburton et al., 2009), support constructivist learning environments (Dickey, 2003; Jarmon et al., 2009).
Social/Contextual Support
Social/Contextual support refers to developing solution adaptations by taking into account the environment, where the problem occurred. In order to solve possible problems, learners must be able to perform basic technical skills such as connecting a projector device, connecting to a network, and solving technological problems, whilst keeping their digital skills updated.
With the use of Web 2.0 applications in learning environments, online learning brings all possible risks of the internet to the learning environments (Chen & He, 2013). Learners will actively participate in the process of learning and teaching in situations, in which they feel safe. The following headings should be taken into consideration for the digital safety of learners and teachers in learning environments (Europass, 2015; European Commission, 2013):
Updating the system, using antivirus software, identity theft, password security, security settings, device security, danger, risk, and measures
Spam
Individual privacy
Cyberbullying
Health risks
Education is the reflection of the dynamics and culture of a society (Giavrimis et al., 2009). In information societies, the norms, which are regarded as significant by individuals of digital environments, should also be taken into consideration by learners in digital learning environments. These norms can be listed as (Europass, 2015; European Commission, 2013):
Ethics
Online dignity
Personal rights
Cultural and intergenerational variety
Copyrights and licenses
Netiquette
Communication rules
Communities of practice are a group of people who share their interests, desires, and problems related to a specific subject and deepen their knowledge and experience as a result of the interactions that occur with these exchanges (Wenger et al., 2002). In this environment, individuals have the opportunity to search and share information, to build trust and interaction with each other, and to apply what they have learned in the community in real life (Snyder et al., 2003). Therefore, communities of practice are considered as a technology under the title of social/contextual support in constructivist learning environments. Virtual communities of practice, which is the digital version of communities of practice, an important tool in revealing the culture, context, and activities of the problem (Brown et al., 1989).
Learners’ technology competencies are a prerequisite for achieving targeted learning outcomes through design-based learning. Teachers wishing to implement this method should check whether this prerequisite is met or not. This is critical to ensuring an effective and efficient learning process. At the same time, it is of importance in terms of enabling teachers to evaluate learners and themselves on a technological basis before education starts in design base learning environment. It is thought that the development of technology competencies scale for design-based learning environments in which teachers can use in a wide range, easily and safely will fill an important gap in the field.
Methodology
The literature has been reviewed in-depth in this study, moreover; 36 technological competency areas relevant to the CLEs framework and 198 items questioning the applicability of these areas in the learning environment have been built on. Scale items were presented to one measurement evaluation specialist and two information communication technology specialists for their opinion, afterwards, technology competency areas and items that were not considered suitable for use in learning environments at the secondary level were removed from the scale. And 26 technology competency areas and 131 items under these areas were created. The draft scale items were evaluated for checking the readability level with a group of 8 students by the focus group interview method. After this interview, the names of frequently used websites and technology applications have also been added to the technology competency domains. The name of a technology competency area was also changed after this interview. The 131-item draft scale collected data from 152 middle school students aged 9–13 years in a large city setting of Turkey in the 2018–2019 academic year. In order to determine the construct validity of the scale, principal component analysis was conducted for each technology competency area in the scale. Apart from the two technology competency areas, a one-factor structure has emerged for each of the 24 technology competency areas. In these two technology competency areas, two-factor structures emerged. Total variance explained values in these factors were about 77% and 79%. An item with close similar factor load values in two factors was extracted from the scale. The scale was completed with 26 technology competency areas and 130 items under these areas.
Study Group
The study group consisted of 152 students studying at a secondary middle school in a large city setting in Turkey. 77 (50.7%) of these students were male and 75 (49.3%) were female. 4 of the students (2.6%) were 9 years old, 2 (1.3%) were 10 years old, 18 (11.8%) were 11 years old, 30 (19.7%) were 12 years old and 98 (64.5%) were 13 years old. Table 1 shows the computer and internet usage rates of the students.
Development of the scale
The scale development process is based on Jonassen’s CLEs framework, which provides a general framework for constructivist learning environments. The literature was reviewed in-depth to determine the technologies appropriate to the stages and sub-headings of the framework. Data collection tools that measure the 21st-century skills of individuals such as digital competencies and digital citizenship have also been examined. And those that are applicable to learning environments were evaluated. As a result of the literature review, 36 technology competency areas that are likely to be used in the design-based learning environments represented in Table 2 have been reached. And a question pool of 198 items was created which questions the use of these technologies in learning environments.
Table 2
Technological Competency Areas Achieved as a result of Literature Review.
| CLEs Framework | Technology Competency Areas Related to The Framework | Related Literature |
|---|---|---|
| 1.Problem/Project | ||
| a. Problem Context | Video Display, Problem Database Websites | (Guo et al., 2014), (Dershowitz & Treinen, 1998) |
| b. Problem Representation | Podcasting, Concept Maps, Virtual Communities of Practice | (Besser et al., 2021), (Mitchell et al., 2021), (Moryl, 2013), (Novak, 1990), (Brown et al., 1989), (Brondfield et al., 2019), (Marzano & Miranda, 2021), (Shin & Jeong, 2021) |
| c. Manipulation Space | Simulation tools, Data Analysis Software, Electronic Spreadsheet Software | (Jonassen, 1999) |
| 2.Related Case | Search Engines, Video Search Engines | (Lazonder, 2001), (Mracek, 2019), (Clifton & Mann, 2011), (Palla & Sheikh, 2020), (Ruggieri, 2020), (Halpern et al., 2020), |
| 3.Information Resources | Digital Library Databases, Google Scholar, E-Museums, Online Questionnaires, RSS | (Borgman et al., 2000), (Cothran, 2011), (Çalık et al., 2016), (Neill, 2008), (Sue & Ritter, 2011) |
| 4.Cognitive (Knowledge-Construction) Tools | Language Translation Software, Office Software, Pdf Editing Software, Audio and Video Editing Software, Digital Calendar Application, Digital Note-Taking Application | (Chung & Ahn, 2021), (Lee & Briggs, 2021), (Muzdalifah & Handayani, 2020), (van Rensburg et al., 2012), |
| 5.Conversation And Collaboration Tools | Social Media, E-Mail, Online Communication Applications, Cloud Technologies, Google Doc, Wiki, Forums, Blogs, E-Portfolios, Video Conference Software, Reference Management Software, Geographical Information Systems, Learning Management Systems, 3-D Virtual Worlds | (Bozanta & Mardikyan, 2017), (Zhang et al., 2016), (Warschauer, 1995), (Cassany et al., 2019), (Kapoor et al., 2019), (Ngaleka & Uys, 2013), (So, 2016),(Bouhnik & Deshen, 2014),(El Mhouti et al., 2016), (Arroyo et al., 2020), (Bakla, 2020), (Gurung et al., 2016), (Savelyeva et al., 2021), (Lin et al., 2014), (Ishtaiwa & Aburezeq, 2015), (Duffy & Bruns, 2006), (Kim & Kim, 2020), (Li et al., 2021) (Trocky & Buckley, 2016), (Ioannou et al., 2015), (Shana, 2009), (Erdogdu & Eskimen, 2020), (Gurer, 2020), (Noel, 2015), (Amir et al., 2011), (Habeeb & Ebrahim, 2019), (Lam, 2020), (Luchoomun et al., 2010), (Jimoyiannis & Tsiotakis, 2016), (Nilsen, 2011), (Basri & Patak, 2015), (Sokolik, 2011), (Lonn & Teasley, 2009), (Warburton et al., 2009), (Dickey, 2003) |
| 6.Social/Contextual Support | Social/Contextual Support | (Chen & He, 2013), (Europass, 2015), (European Commission, 2013), |
This pool of questions was evaluated by one measurement evaluation specialist and two information communication technology specialists. As a result of the expert review, it was decided to remove 10 technology competency areas and 67 items under these areas, to include 2 technology competency areas (7 items in these) under a different frame title, and to change the name of 1 technological competency area. Details of these changes are given below:
The “Video Display” technology competency area has been removed because it does not meet the problem context title.
The “Data Analysis Software” area was removed as the “Electronic Spreadsheet Software” area was considered sufficient.
The “Search Engines” area under the “Related Case framework” title was taken under the “Information Resources” framework title.
The “Digital Library Databases” and “Google Scholar” areas were omitted because it was thought that the “Search Engines” would be sufficient instead of these areas.
The “PDF Editing Software”, “Digital Note-Taking Application”, “Reference Management Software” and “Learning Management Systems” areas were removed considering that they would be very specific for secondary school level learning environments.
The “Audio and Video Editing Software” area has been changed to the “Creating/Editing multimedia” area.
The “Google Docs” area has been removed due to the “Cloud Technologies” area being considered sufficient.
The fact that 15 items under the “Social/Contextual Support” area included IT technicians have been considered as unsuitable for secondary school level learning environments and has been removed.
The items of the “Virtual Communities of Practice” area were included in this area because they were considered to be suitable for the “Social/Contextual Support” area.
As a result, the scale which consists of 26 technology competency areas and 131 items under these areas presented in Table 3 were developed.
Table 3
Technological Competency Areas as a Result of Field Expert Review.
The scale items were evaluated with a group of 8 students by the focus group interview method. As a result of the focus group interview, it was found out that the students had difficulties understanding the meaning of the technology competency domain names. For this reason, after consulting with experts, it was deemed appropriate to add the frequently used web site and technology application names to the technology competency domain names as examples. Examples of this arrangement are presented in Table 4. Some student opinions regarding this assessment are as follows:
“I don’t know what cloud technologies are, but I use Google Drive.”
“I didn’t hear the geographical information systems, but I did an address search on my phone and went there.”
“I have difficulty understanding the technological competency domain name in some items.”
“It is good to give examples alongside common names.”
Table 4
Technological Competency Areas and Application Examples Related To These Areas.
| Technological Competency Areas | Favorite Application Example |
|---|---|
| Search Engines | Google, Yandex, etc. |
| Office Software | Microsoft Word, Microsoft Excel, Microsoft PowerPoint, Microsoft Access, etc. |
| Social Media | Facebook, Twitter, Instagram, etc. |
| Google Gmail, Microsoft Outlook, etc. | |
| Online Communication Applications | WhatsApp, Google Hangout, etc. |
| Cloud Technologies | Google Drive, Microsoft OneDrive, Dropbox, etc. |
After the focus group interview, it was decided to write the “RSS” technology competency area with a clear statement as the “Web Feeds” and the design-based learning technological competency areas are finalized in Table 5.
Table 5
Technological Competency Areas Organized as a Result of the Focus Group Interview.
| CLEs Framework | Technology Competency Areas Related To The Framework | Related Literature |
|---|---|---|
| 1.Problem/Project | ||
| a. Problem Context | Problem Database Websites | (Dershowitz & Treinen, 1998) |
| b. Problem Representation | Podcasting, Concept Maps | (Besser et al., 2021), (Mitchell et al., 2021), (Moryl, 2013), (Novak, 1990), (Brown et al., 1989), (Brondfield et al., 2019), (Marzano & Miranda, 2021), (Shin & Jeong, 2021) |
| c. Manipulation Space | Simulation Tools (Packet tracer, OrCad, Proteus etc.), Electronic Spreadsheet Software (Microsoft Excel, etc.) | (Jonassen, 1999) |
| 2.Related Case | Video Search Engines (YouTube, etc.) | (Clifton & Mann, 2011), (Palla & Sheikh, 2020), (Ruggieri, 2020), (Halpern et al., 2020) |
| 3.Information Resources | Search Engines (Google, Yandex, etc.), E-Museums, Online Questionnaires, Web Feeds (RSS) | (Lazonder, 2001), (Mracek, 2019), (Çalık et al., 2016), (Neill, 2008), (Sue & Ritter, 2011) |
| 4.Cognitive (Knowledge-Construction) Tools | Language Translation Software (Google Translate, etc.), Office Software (Microsoft Word, Microsoft Excel, Microsoft PowerPoint, Microsoft Access etc.), Creating/Editing Multimedia, Digital Calendar Application | (Chung & Ahn, 2021), (Lee & Briggs, 2021), (Muzdalifah & Handayani, 2020), (van Rensburg et al., 2012) |
| 5.Conversation And Collaboration Tools | Social Media (Facebook, Twitter, Instagram, etc.), E-Mail (Google Gmail, Microsoft Outlook, etc.), Online Communication Applications (WhatsApp, etc.), Cloud Technologies (Google Drive, Microsoft OneDrive, Dropbox), Wiki (Wikimedia, etc.), Forums, Blogs (WordPress, etc.), E-Portfolios, Video Conference Software (Adobe Connect, Skype, etc.), Geographical Information Systems (Google Maps, Yandex Maps, etc.), 3-D Virtual Worlds. | (Bozanta & Mardikyan, 2017), (Zhang et al., 2016), (Warschauer, 1995), (Cassany et al., 2019), (Kapoor et al., 2019), (Ngaleka & Uys, 2013),(So, 2016),(Bouhnik & Deshen, 2014),(El Mhouti et al., 2016), (Arroyo et al., 2020), (Bakla, 2020), (Gurung et al., 2016), (Savelyeva et al., 2021), (Lin et al., 2014), (Ishtaiwa & Aburezeq, 2015), (Duffy & Bruns, 2006), (Kim & Kim, 2020), (Li et al., 2021) (Trocky & Buckley, 2016), (Ioannou et al., 2015), (Shana, 2009), (Erdogdu & Eskimen, 2020), (Gurer, 2020), (Noel, 2015), (Amir et al., 2011), (Habeeb & Ebrahim, 2019), (Lam, 2020), (Luchoomun et al., 2010), (Jimoyiannis & Tsiotakis, 2016), (Nilsen, 2011), (Basri & Patak, 2015), (Sokolik, 2011), (Lonn & Teasley, 2009), (Warburton et al., 2009), (Dickey, 2003) |
| 6.Social/Contextual Support | Social/Contextual Support | (Chen & He, 2013), (Europass, 2015), (European Commission, 2013), (Brown et al., 1989). |
Implementation of the Scale
The scale was administered online to 152 students in secondary middle school in a large city setting of Turkey on 20 computers in the IT class. The average response to the questionnaire by 152 students was 15.96 minutes. The researcher took part in the IT class during the students’ responses to the scale.
Analysis of the Scale
A large number of variables and the correlation of many of these variables make it difficult to evaluate the data set. In such cases, the use of principal component analysis (PCA) to interpret the variance-covariance structure of the variable set through the linear combination of variables by removing the dependency structure is a very effective method (Ersungur et al., 2007). PCA aims to express important information from a data set with a new variable array under the name of principal components. PCA is the method that best explains the variance used in interpreting the reliability of the test compared to other factor extraction methods under various sample sizes and common variance conditions. (Karaman et al., 2017). It is an ideal method for size reduction, especially on a large data set (Abdi & Williams, 2010). In the study, PCA was used in order to reduce the technology dimensions determined by the literature review in line with the purpose of the study. Orthogonal and oblique rotation methods are used to provide a more interpretable factor structure in PCA. In the study, the varimax rotation of Kaiser (Kaiser, 1958) which is the most preferred orthogonal rotation method in the literature (Jackson, 2005; Kleinbaum et al., 1988), was preferred. Since the original variables tend to be associated with a basic component with each rotation, the varimax rotation method is considered an easily interpretable return operation (Abdi & Williams, 2010). During principal component analysis, Kaiser-Meyer-Olkin (KMO) and Bartlett values were determined.
Findings
Kaiser-Meyer-Olkin (KMO) and Barlett analyses were conducted to test whether the data obtained from the study group were suitable for principal component analysis. As a result of the analysis, (KMO) values in each technology competency area ranged from 0.694 to 0.919, while Barlett significance values were found to be p = 000. KMO and Barlett test results are presented in Table 6. As the KMO value approaches 1 between 0.60–1, the adequacy of the data obtained from the sample goes to perfection (Tabachnick & Fidell, 2013). Barlett value should be at p < .05 significance level (Tavşancıl, 2002). With these results, it was evaluated that the data set was suitable for principal component analysis.
Table 6
KMO and Bartlett Test Values.
| CLEs Framework | Technology competency areas related to the framework | Item No | KMO | Barlett | ||
|---|---|---|---|---|---|---|
| Chi-Square | df | Sig. | ||||
| PROBLEM/PROJECT (1–19) | Problem Context | 1–4 | 0.789 | 183.161 | 6 | .000 |
| Problem Representation | 5–11 | 0.864 | 364.515 | 21 | .000 | |
| Manipulation Space | 12–19 | 0.886 | 497.761 | 28 | .000 | |
| RELATED CASE (20–24) | Video Search Engines | 20–24 | 0.754 | 279.483 | 10 | .000 |
| INFORMATION RESOURCES (25–40) | Search Engines | 25–28 | 0.798 | 221.587 | 6 | .000 |
| E-Museums | 29–31 | 0.741 | 264.863 | 3 | .000 | |
| Online Questionnaires | 32–36 | 0.856 | 356.270 | 10 | .000 | |
| Web Feeds (RSS) | 37–40 | 0.768 | 295.677 | 6 | .000 | |
| COGNITIVE (KNOWLEDGE-CONSTRUCTION) TOOLS (41–59) | Language Translation Software | 41–43 | 0.704 | 201.205 | 3 | .000 |
| Office Software | 44–47 | 0.823 | 331.317 | 6 | .000 | |
| Creating/Editing Multimedia | 48–56 | 0.848 | 919.431 | 36 | .000 | |
| Digital Calendar Application | 57–59 | 0.726 | 196.967 | 3 | .000 | |
| CONVERSATION AND COLLABORATION TOOLS (60–121) | Social Media | 60–64 | 0.850 | 329.331 | 10 | .000 |
| 65–70 | 0.842 | 533.527 | 15 | .000 | ||
| Online Communication Applications | 71–75 | 0.899 | 509.148 | 10 | .000 | |
| Cloud Technologies | 76–84 | 0.919 | 1287.437 | 36 | .000 | |
| Wiki | 85–91 | 0.918 | 945 | 137 | .000 | |
| Forums | 92–97 | 0.904 | 763.727 | 15 | .000 | |
| Blogs | 98–103 | 0.912 | 939.931 | 15 | .000 | |
| E-Portfolios | 104–108 | 0.843 | 578.537 | 10 | .000 | |
| Video Conference Software | 109–114 | 0.900 | 906.020 | 15 | .000 | |
| Geographical Information Systems | 115–117 | 0.694 | 214.042 | 3 | .000 | |
| 3-D Virtual Worlds | 118–121 | 0.818 | 388.586 | 6 | .000 | |
| SOCIAL/CONTEXTUAL SUPPORT (122–131) | Social/Contextual Support | 122–131 | 0.917 | 1094.918 | 45 | .000 |
As a result of the suitability of the principal component analysis (PCA) of the data, PCA was started to evaluate the factor structure. Analysis was performed separately for each title under the CLEs framework title. PCA was performed by varimax rotation. Information about factor load values and the number of factors after rotation is presented in Table 7.
Table 7
Communalities Extraction, Component Matrix, Total Variance Explained, and Cronbach’s Alpha Values.
| CLEs Framework | Technology competency areas related to the framework | Items | Communalities Extraction | Component Matrix | Total Variance Explained | Cronbach’s alpha | |
|---|---|---|---|---|---|---|---|
| Cumulative | Number of factors | ||||||
| PROBLEM/PROJECT (1–19) | Problem Context | 1–4 | >0.639 | >0.799 | 67.980 | 1 | 0.942 |
| Problem Representation | 5–11 | >0.456 | >0.676 | 58.543 | 1 | ||
| Manipulation Space | 12–19 | >0.620 | >0.729 | 60.518 | 2 | ||
| >0.760 | 75.499 | ||||||
| RELATED CASE (20–24) | Video Search Engines | 20–24 | >0.495 | >0.703 | 59.271 | 1 | 0.817 |
| INFORMATION RESOURCES (25–40) | Search Engines | 25–28 | >0.574 | >0.758 | 69.254 | 1 | 0.953 |
| E-Museums | 29–31 | >0.831 | >0.912 | 85.678 | 1 | ||
| Online Questionnaires | 32–36 | >0.456 | >0.675 | 70.824 | 1 | ||
| Web Feeds (RSS) | 37–40 | >0.678 | >0.823 | 75.513 | 1 | ||
| COGNITIVE (KNOWLEDGE-CONSTRUCTION) TOOLS (41–59) | Language Translation Software | 41–43 | >0.689 | >0.830 | 77.611 | 1 | 0.953 |
| Office Software | 44–47 | >0.692 | >0.832 | 77.933 | 1 | ||
| Creating/Editing Multimedia | 48–56 | >0.707 | >0.783 | 65.162 | 2 | ||
| >0.874 | 79.368 | ||||||
| Digital Calendar Application | 57–59 | >0.743 | >0.862 | 80.048 | 1 | ||
| CONVERSATION AND COLLABORATION TOOLS (60–121) | Social Media | 60–64 | >0.596 | >0.772 | 70.022 | 1 | 0.989 |
| 65–70 | >0.539 | >0.734 | 68.178 | 1 | |||
| Online Communication Applications | 71–75 | >0.695 | >0.833 | 77.629 | 1 | ||
| Cloud Technologies | 76–84 | >0.634 | >0.797 | 80.405 | 1 | ||
| Wiki | 85–91 | >0.784 | >0.885 | 84.024 | 1 | ||
| Forums | 92–97 | >0.788 | >0.888 | 82.091 | 1 | ||
| Blogs | 98–103 | >0.806 | >0.898 | 85.968 | 1 | ||
| E-Portfolios | 104–108 | >0.808 | >0.899 | 85.344 | 1 | ||
| Video Conference Software | 109–114 | >0.828 | >0.910 | 87.367 | 1 | ||
| Geographical Information Systems | 115–117 | >0.760 | >0.872 | 80.632 | 1 | ||
| 3-D Virtual Worlds | 118–121 | >0.742 | >0.862 | 82.110 | 1 | ||
| SOCIAL/CONTEXTUAL SUPPORT (122–131) | Social/Contextual Support | 122–131 | >0.586 | >0.765 | 71.192 | 1 | 0.953 |
Problem Context technology competency area in Problem/Project framework title includes 4 items. The lowest factor load value of these 4 items is 0.639. And the only factor that emerges explains 67.980% of the variance. There are 7 items in the problem representation technology competency area, while the lowest factor load value of these 7 items is 0.456. And 58.453% of the variance is explained by the only factor that occurs. The manipulation space technology competency area has 8 items, while the lowest factor load value of these 8 items is 0.620. An item in this technology competency area has been removed because the load values in the two factors are very close to each other. The total variance explanation rate of two factors emerging in the manipulation space technology competency area is 60.518%. The Cronbach’s alpha value of these 19 items under the framework title of Problem/Project (1–19) was calculated as 0.942.
Video search engines are the only technology competency area in the Related Case framework title. And there are 5 items in this technology competency area. The lowest factor load value of these items is 0.495. The Cronbach’s alpha value of this factor dimension, which explains 59.271% of the total variance, is 0.817.
Search Engines technology competency area in Information Resources framework title includes 4 items. The lowest factor load value of these 4 items is 0.574. And the only factor that emerges explains 69.254% of the variance. There are 3 items in the E-Museums technology competency area, while the lowest factor load value of these 3 items is 0.831. And 85.678% of the variance is explained by the only factor that occurs. Online Questionnaires technology competency area has 5 items, while the lowest factor load value of these 5 items is 0.456. And the only factor that emerges explains 70.824% of the variance. Web Feeds (RSS) technology competency area includes 4 items. The lowest factor load value of these 4 items is 0.678. And the only factor that emerges explains 75.513% of the variance. The Cronbach’s alpha value of these 16 items under the framework title of Information Resources (25–40) was calculated as 0.953.
Language Translation Software technology competency area in Cognitive (Knowledge-Construction) Tools framework title includes 3 items. The lowest factor load value of these 3 items is 0.689. And the only factor that emerges explains 77.611% of the variance. There are 4 items in the Office Software technology competency area, while the lowest factor load value of these 4 items is 0.692. And 77.933% of the variance is explained by the only factor that occurs. Creating/Editing Multimedia technology competency area has 9 items, while the lowest factor load value of these 9 items is 0.707. The total variance explanation rate of two factors emerging in Creating/Editing Multimedia technology competency area is 65.162%. Digital Calendar Application technology competency area includes 3 items. The lowest factor load value of these 3 items is 0.743. And the only factor that emerges explains 80.048% of the variance. The Cronbach’s alpha value of these 18 items under the framework title of Cognitive (Knowledge-Construction) Tools (41–59) was calculated as 0.953.
Social Media technology competency area in Conversation and Collaboration Tools framework title includes 5 items. The lowest factor load value of these 5 items is 0.596. And the only factor that emerges explains 70.022% of the variance. There are 6 items in the E-Mail technology competency area, while the lowest factor load value of these 6 items is 0.539. And 68.178% of the variance is explained by the only factor that occurs. Online Communication Applications technology competency area includes 5 items. The lowest factor load value of these 5 items is 0.695. And the only factor that emerges explains 77.629% of the variance. Cloud Technologies technology competency area includes 9 items. The lowest factor load value of these 9 items is 0.634. And the only factor that emerges explains 80.405% of the variance. There are 7 items in the Wiki technology competency area, while the lowest factor load value of these 7 items is 0.784. And 80.024% of the variance is explained by the only factor that occurs. Forums technology competency area includes 6 items. The lowest factor load value of these 6 items is 0.788. And the only factor that emerges explains 82.091% of the variance. Blogs technology competency area includes 6 items. The lowest factor load value of these 6 items is 0.806. And the only factor that emerges explains 85.968% of the variance. There are 5 items in the E-Portfolios technology competency area, while the lowest factor load value of these 5 items is 0.808. And 85.344% of the variance is explained by the only factor that occurs. Video Conference Software technology competency area includes 6 items. The lowest factor load value of these 6 items is 0.828. And the only factor that emerges explains 87.367% of the variance. The geographical Information Systems technology competency area includes 3 items. The lowest factor load value of these 3 items is 0.760. And the only factor that emerges explains 80.632% of the variance. There are 4 items in the 3-D Virtual Worlds competency area, while the lowest factor load value of these 4 items is 0.742. And 82.11% of the variance is explained by the only factor that occurs. The Cronbach’s alpha value of these 62 items under the framework title of Conversation and Collaboration Tools (60–121) was calculated as 0.953.
Social/Contextual Support is the only technology competency area in the Social/Contextual Support framework title. And there are 10 items in this technology competency area. The lowest factor load value of these items is 0.586. The Cronbach’s alpha value of this factor dimension, which explains 59.271% of the total variance, is 0.953.
As detailed above, total variance explained values in each technology area are between 58.543% and 87.367%. The fact that the total variance explained values used in determining the factor structure are over %50 indicates that the factor is representative. Factor load values are between 0.456 and 0.831. Having factor load values above 40%, which indicates the relationship between each item and the factor it is in, indicates that the item measures the factor. Cronbach’s alpha values in CLEs framework titles, which can also be expressed as subscales of the measurement tool, were found to be between 0.817 and 0.993. Cronbach’s alpha values above 0.80 indicate that the survey is valid and reliable (Cronbach & Meehl, 1956). As a result of the principal component analysis made after the literature review, expert opinion, and focus group discussion, dble_TCS is considered to be a measurement tool for measuring students’ information and communication technology competencies in design-based learning environments.
Discussion and Conclusion
In the constructivist approach, planning and implementing learning environments is a costly and time-consuming process compared to behavioral and cognitive learning environments. Student’s cognitive readiness and technological competency play an important role in the success of this process. The desired level of student technology competency will provide an effective and efficient learning process while increasing student motivation. In this study, it is aimed to build on student technological competency areas in design-based learning environments by using Jonassen’s CLEs framework and to develop a scale that measures them. For this purpose, firstly, the literature was reviewed. 36 technological competency areas relevant to the framework and 198 items questioning the applicability of these areas in the learning environment have been built on. This question pool with 5-point Likert-type ratings was presented to one measurement evaluation specialist and two information communication technology specialists’ opinions. As a result of the specialist evaluation, 10 technology competency areas and 67 items under these areas were excluded from the question pool. Two technology competency areas (7 items in these) were included under a different framework title. The name of 1 technological competency area was changed. Following the expert opinion, 26 technology competency areas and 131 items under these areas were created. The scale was discussed with 8 students in a focus group interview setting. After this interview, the names of frequently used websites and technology applications have also been added to the technology competency domains. The name of a technology competency area was also changed after this interview. The 131-item draft scale was applied to 152 secondary school students. The Kaiser-Meyer-Olkin (KMO) and Barlett test results calculated separately for each of the technology competency areas in the CLEs framework title showed that the data set was suitable for principal component analysis.
In order to determine the construct validity of the scale, principal component analysis was conducted for each technology competency area on the scale. Apart from the two technology competency areas, a one-factor structure has emerged for each of the 24 technology competency areas. In these two technology competency areas, two-factor structures emerged. Total variance explained values in these factors were about 77% and 79%. An item with close similar factor load values in two factors was extracted from the scale. The scale was completed with 26 technology competency areas and 130 items under these areas. When the factor load, explained total variance and Cronbach’s alpha values of the CLEs framework titles, which can also be expressed as subscales of the scale, were examined and it was concluded that the scale was valid and reliable.
Scales with less than 30 minutes of survey response time are considered applicable surveys (Yücedağ, 1993). The average time to answer dble_TCS by 152 students was 15.96 minutes. Indecision and lack of information on a scale lead to long response times (Heerwegh, 2003). The response time is therefore shown as an indication of uncertainty and response errors in a survey (Yan & Tourangeau, 2008). Although dble_TCS developed in the study has 130 items, the low average response time indicates that dble_TCS is understandable by the target group and answered with a determined attitude. In light of these evaluations, dble_TCS is a feasible scale for the target audience. dble_TCS developed within the scope of the research is thought to be an appropriate tool for teachers and students to evaluate their technological competency in learning environments based on the constructivist approach.
Suggestions for Future Research
152 participants were included in the study to test the reliability of the developed scale. The study can be repeated by increasing the number of participants by at least 300. The participants included in the study are at the middle school level. The scale can be tested at different education levels by repeating the study at high school and higher education levels.
Limitations
Information and communication technologies are constantly evolving and changing. The study was carried out within the scope of currently developed technologies. These technologies are one of the limitations of the study. Another limitation is that the scale and study are designed and implemented within Jonassen’s (1999) framework of Constructivist Learning Environment design principles. Although it is considered a comprehensive guide for designing constructivist learning, elements of other constructivist learning design guidelines, such as R2D2 (Willis, 1995), were not considered in this study.
Competing Interests
The authors have no competing interests to declare.