
Table 1
Factor Loadings (Oblique Rotated) from the Principal Axis Factor Analysis (N = 2477).
| Questions | Factor 1 | Factor 2 | Communalities |
|---|---|---|---|
| ‘How would you rate your basic skills when using digital tools in school?’ | .86 | .01 | .76 |
| ‘Based on the previous questions, how would you estimate your overall digital competence in relation to teaching?’ | .84 | .51 | .78 |
| ‘How would you rate your elementary skills when using digital tools in your leisure time?’ | .81 | -.02 | .72 |
| ‘How would you rate your skills within didactic ICT use?’ | .77 | .38 | .63 |
| ‘How would you estimate your competence to guide students’ digital judgement related to their digital lifestyle within and outside of school?’ | .66 | .56 | .58 |
| ‘How would you rate your skills in guiding students in the use of digital learning strategies?’ | .62 | .57 | .55 |
| ‘Based on the previous questions, how would you estimate the students’ overall digital competence within school subjects?’ | .27 | .75 | .57 |
| ‘To what extent do you believe the teachers at your school are good role models for the students’ curricular ICT use in education?’ | .13 | .74 | .56 |
| Eigenvalue: | 3.9 | 1.3 |
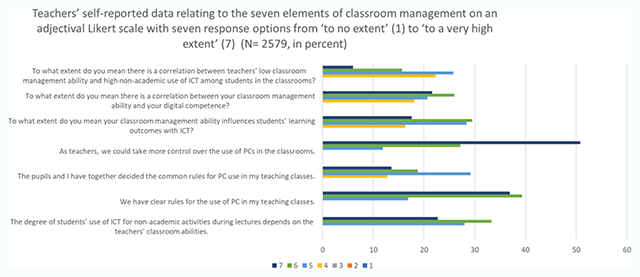
Figure 1
Teachers’ self-reported data relating to the seven elements of classroom management (N = 2579).
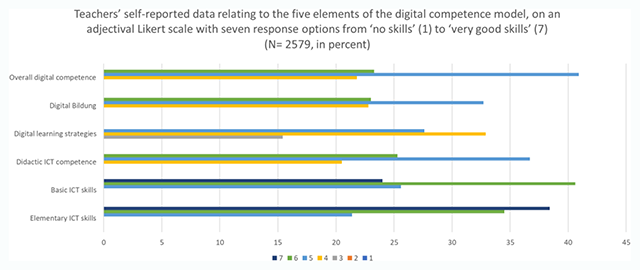
Figure 2
Teachers’ self-reported data relating to the five elements of the digital competence model (N = 2579).
Table 2
Regression analysis results of teachers’ reported ability for classroom management (dependent variable) predicted by professional digital competence, teaching control, age, work experience, screen time and ICT qualifications (formal and in-service).
| Predictor Variables | Classroom management | |
|---|---|---|
| B | Beta | |
| Digital competence | 0.43* | 0.34 |
| Screen time | 0.08* | 0.10 |
| Work experience | –0.07* | –0.07 |
| Teaching control | 0.05* | 0.10 |
| Age | 0.02 | 0.03 |
| Formal ICT training | 0.01 | 0.01 |
| In-service ICT training | 0.04 | 0.02 |
| R² (adj.) | 0.175 | |
[i] Note: * p < .001.
Table 3
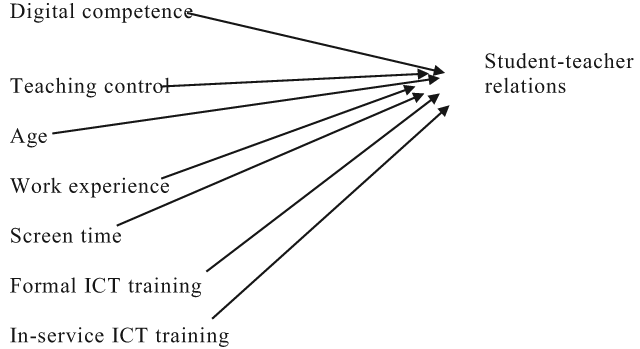
Regression analysis results of student-teacher relations (dependent variable) predicted by digital competence, teaching control, age, work experience, screen time and ICT qualifications (formal and in-service).
| Predictor Variables | Student-teacher relations | |
|---|---|---|
| B | Beta | |
| Digital competence | 0.50* | 0.39 |
| Teaching control | 0.15* | 0.31 |
| Age | 0.10* | 0.16 |
| Work experience | –0.04 | –0.04 |
| Screen time | –0.02 | –0.03 |
| Formal ICT training | 0.02 | 0.02 |
| In-service ICT training | 0.09 | 0.03 |
| R² (adj.) | 0.312 | |
[i] Note: * p < .001.