
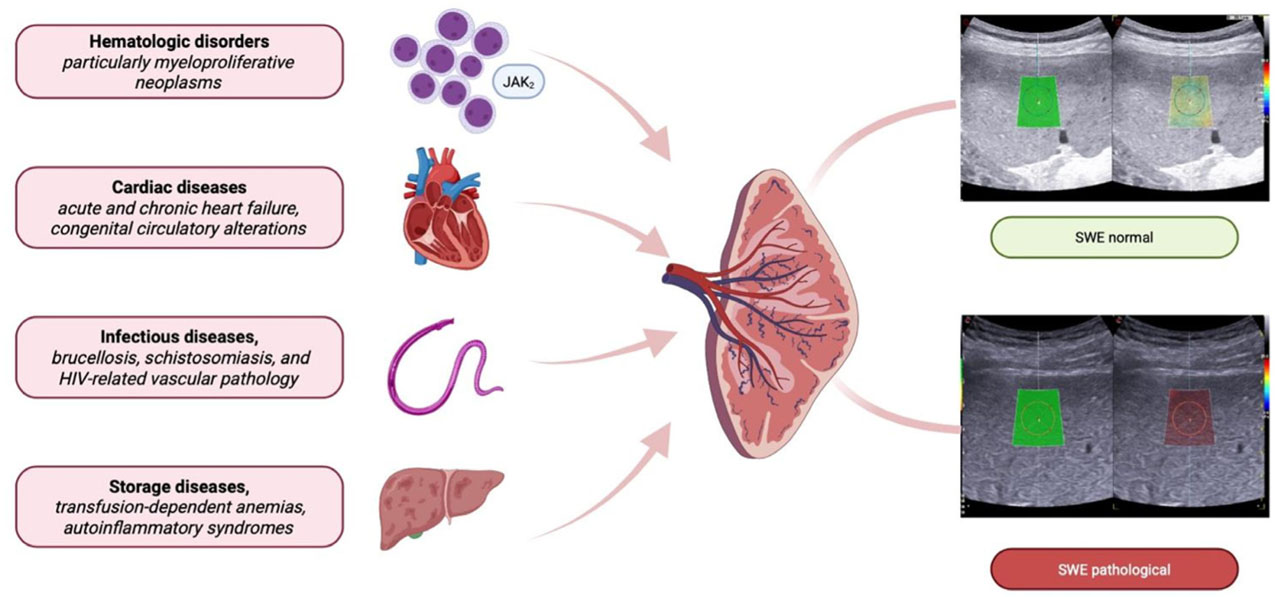
Fig. 1.
Non-portal applications of splenic shear wave elastography (SWE). Schematic representation of the main systemic conditions associated with altered splenic stiffness, including hematologic disorders (particularly myeloproliferative neoplasms), cardiac diseases (acute/chronic heart failure and congenital circulatory alterations), infectious diseases (such as brucellosis, schistosomiasis, and HIV-related vascular pathology), and storage or autoinflammatory disorders (e.g., transfusion-dependent anemias and Gaucher disease). These heterogeneous mechanisms – ranging from fibrosis and vascular remodeling to venous congestion, inflammatory infiltration, and parenchymal storage – can modify splenic biomechanics and lead to increased stiffness on SWE. Example ultrasound images show a normal splenic stiffness measurement (upper panel) and a pathological stiffness pattern (lower panel)
Tab. 1.
Splenic shear wave elastography in healthy subjects
| Author | No. | Technique | Mean/median value | Protocol | Notes |
|---|---|---|---|---|---|
| Luekiatphaisan et al. (2025) | 44 | 2D-SWE (GE LOGIQ E10) | 12.6 ± 1.2 kPa | Supine; intercostal approach; fasting and postprandial states compared. | Independent of sex, age, spleen size; postprandial decline at 180 min. |
| Patil et al. (2024) | 28 | p-SWE (Samsung HS70A) | 22.9 ± 9.5 kPa | Supine/right lateral decubitus; left arm elevated; intercostal and subcostal; breath-hold; 3 locations (upper, hilum, lower pole); 9 acquisitions averaged. | Controls significantly lower than splenomegaly (32.1 ± 12.5 kPa); correlation with spleen size (ρ = 0.48). |
| Giuffrè et al. (2019) | 100 | p-SWE | 18.1 ± 3.1 kPa | Intercostal approach; supine/left lateral decubitus; fasting; median of 10 valid acquisitions. | Excellent intra-/inter-observer reproducibility. |
| Kishimoto et al. (2019) | 30 | p-SWE (Siemens VTQ) | 2.5 m/s (IQR ~0.7) | Supine, intercostal; breath-hold after light inspiration; 5 repeated acquisitions. | High intra-operator ICC (>0.85); lower inter-operator ICC (~0.65). |
| Albayrak et al. (2019) | 127 | 2D-SWE (GE LOGIQ E9) | 13.8 ± 2.9 kPa | Supine; intercostal approach; fasting ≥4 h; ROI 1–2 cm below capsule; multiple acquisitions. | No effect of age, sex, or BMI. |
| Cho et al. (2018) | 313 | 2D-SWE (Aixplorer) | 20.5 ± 5.4 kPa | Supine; left intercostal/subcostal approach; fasting ≥8 h; measurements during quiet breathing. | Large cohort; excluded chronic liver disease and splenomegaly. |
| Pawlus et al. (2016) | 59 | 2D-SWE (Aixplorer) | 16.6 ± 2.5 kPa | Supine, left intercostal approach, fasting; breath-hold at end-expiration; ≥5 valid measurements. | No effect of sex, age, or spleen size; repeatability acceptable. |
Tab. 2.
Splenic shear wave elastography in hematologic diseases
| Author | Design | Population | Technique | Reference standard | Main results |
|---|---|---|---|---|---|
| Alhyari et al. (2024) | Prospective acquisition, retrospective analysis | 40 patients with splenomegaly (hematologic malignancies, congestive, immune-related causes) | p-SWE-SSM (Siemens, m/s) | Clinical diagnosis / etiology classification | Mean SS: malignant 3.25 ± 0.68 m/s; congestive 3.52 ± 0.47 m/s; immune 2.84 ± 0.92 m/s. |
| Sansone et al. (2024) | Prospective cross-sectional, single center | 218 patients with MPN (MF, PV, ET) + healthy volunteers | p-SWE-SSM and 2D-SWE-SSM (Esaote, kPa) | Bone marrow fibrosis grade | MF median SS: p-SWE 37.9 kPa; 2D-SWE 31.65 kPa vs. HV 23.4 and 20.1. Cutoffs: p-SWE ≥33.1 kPa for fibrosis ≥2 (AUROC 0.702); 2D-SWE ≥25.6 kPa for MF (AUROC 0.752). Associations with advanced fibrosis, thrombosis, and JAK2 homozygosity. |
| Omer et al. (2021) | Prospective cross-sectional, single center | 121 participants (52 HV, 52 PV/ET, 17 secondary MF) | 2D-SWE-SSM (Philips, m/s) | Bone marrow histology (fibrosis) | Median SS: HV 0.82 m/s; PV/ET 1.41 m/s; MF 2.32 m/s. Strong correlation with fibrosis grade (r = 0.757, p <0.001). |
| Yalçın et al. (2021) | Prospective | 61 patients with splenomegaly (21 hepatoportal, 23 MPN, 17 infectious) + 20 controls | p-SWE (ARFI, Siemens) Clinical, serology, marrow | Clinical assessment, serology, bone marrow evaluation | Median SS: hepatoportal 3.85 m/s, MPN 3.42 m/s, infectious 2.66 m/s, controls 2.22 m/s. Cutoffs: 3.42 (hepatoportal vs. MPN), 3.02 (hepatoportal vs. infectious), 2.84 (MPN vs. infectious). |
| Batur et al. (2019) | Prospective | 73 patients with splenomegaly (19 hepatoportal, 21 MPN, 16 infectious) + 17 controls | p-SWE (ARFI, Siemens) | Clinical assessment, serology, bone marrow evaluation | SS significantly higher in hepatoportal (3.27 m/s) vs. MPN (2.98 m/s) vs. infectious (2.44 m/s) vs. controls (2.08 m/s). Cutoffs: >3.10 m/s (hepatoportal vs. MPN), >2.77 m/s (hepatoportal vs. infectious), >2.75 m/s (MPN vs. infectious). |
| Webb et al. (2015) | Prospective pilot, single center | 9 patients with MF, 11 with cirrhosis, 8 healthy volunteers | 2D-SWE-SSM (Aixplorer, kPa) | Nonspecific (comparison groups) | Mean SS: MF 32.9 kPa; cirrhosis 40.5 kPa; controls 18.1 kPa. MF and cirrhosis > controls but not distinguishable. Correlation with spleen size (r ≈ 0.49) and with TE (r ≈ 0.78). |
[i] AUROC – area under the receiver operating characteristic curve; 2D-SWE – two-dimensional shear wave elastography; ET – essential thrombocythemia HV – healthy volunteers; MF – myelofibrosis; MPN – myeloproliferative neoplasms; PV – polycythemia vera; SSM – spleen stiffness measurement; SS – splenic stiffness; SWE – shear wave elastography; TE – transient elastography
Tab. 3.
Splenic shear wave elastography in cardiac diseases
| Author | Population | Technique | Main results |
|---|---|---|---|
| Venkatakrishna et al. (2024) | 22 Fontan patients (7–30 years) with liver biopsy | p-SWE (Siemens) | Median SS 2.94 m/s; no correlation with Ishak/METAVIR/CHFS fibrosis scores; correlated only with spleen size. |
| Misaka et al. (2023) | 232 chronic HF patients | 2D-SWE + shear wave dispersion | High SS (>2.52 m/s) and SWD predicted cardiac death/re-hospitalization. SS associated with CD36 mRNA upregulation. |
| Simmons et al. (2021) | 18 adult Fontan patients vs. 18 controls | 2D-SWE (Philips EPIC 7) | SS similar to controls (1.43 vs. 1.36 m/s, p = 0.26); LS elevated; SS/LS ratio <1 in most patients. |
| Saito et al. (2020) | 176 patients with acute decompensated HF | 2D-SWE | Higher SS at discharge correlated with right atrial pressure (r = 0.47, p <0.001), tricuspid regurgitation, NT-proBNP. SS ≥18.9 kPa predicted mortality/re-hospitalization. |
| Aliyev et al. (2020) | 30 children after Fontan procedure vs. 30 controls | p-SWE (Philips iU22) | SS higher in Fontan patients (25.6 ± 4.6 kPa) vs. controls (15.9 ± 1.4 kPa, p <0.001); correlated with PT/INR. |
Tab. 4.
Splenic shear wave elastography in storage and autoinflammatory disorders
| Author | Population | Technique | Main results |
|---|---|---|---|
| Salih et al. (2024) | 103 β-thalassemia major vs. 30 controls | p-SWE (Philips) | Median SS: 2.39 m/s in thalassemia vs. 2.19 m/s in controls (p = 0.014). No correlation with MRI T2* or ferritin. |
| Serdar et al. (2023) | 74 adult FMF patients vs. 40 controls | 2D-SWE (Samsung) | Mean SS: 14.3 vs. 14.0 kPa, p = 0.37. LS significantly increased in FMF. |
| Bayramoğlu et al. (2021) | Pediatric FMF with/without amyloidosis | p-SWE | Increased SS in FMF children with amyloidosis; normal values in uncomplicated FMF. |
| Lollert et al. (2020) | 50 GD1 patients (ERT and untreated) | p-SWE (Siemens) | Median SS: 2.54 m/s. SS correlated with BMI, triglycerides, GGT; association with GD-DS3 score when untreated patients were excluded. Higher SS in osteonecrosis and in non-N370S/N370S genotype. |
| Webb et al. (2018) | 42 GD1, 33 cirrhosis, 22 healthy controls | 2D-SWE (Aixplorer) | Median SS: GD 35 kPa (TE), 22 kPa (SWE); controls 17 kPa; cirrhosis 45 (TE), 34.5 (SWE). AUC SWE > TE for distinguishing GD vs. cirrhosis. |
[i] AUC – area under the curve; BMI – body mass index; GD1 – Gaucher disease type 1; GD-DS3 – Gaucher Disease Type 1 Severity Scoring System; GGT – gamma-glutamyl transferase; LS – liver stiffness; FMF – familial Mediterranean fever; SS – splenic stiffness; 2D-SWE – two-dimensional shear wave elastography; p-SWE – point shear wave elastography; TE – transient elastography
Tab. 5.
Splenic shear wave elastography in infectious diseases
| Author | Disease | Population | Technique | Main results |
|---|---|---|---|---|
| Dogan et al. (2023) | Brucellosis | 40 patients with acute brucellosis vs. 60 healthy controls | p-SWE (Philips Epic 7) | Mean SS 3.24 ± 1.80 kPa in brucellosis vs. 1.38 ± 0.62 kPa in controls (p <0.001). Cutoff 1.63 kPa, AUC 0.903, sensitivity 80%, specificity 85%. |
| Pereira et al. (2021) | Hepatosplenic schistosomiasis (HES) | 74 patients with S. mansoni | p-SWE and 2D-SWE | SS markedly increased in HES compared with controls; correlated with periportal fibrosis patterns and clinical morbidity scores. |
| Veiga et al. (2021) | Hepatosplenic schistosomiasis (HES) | 26 patients with portal hypertension due to S. mansoni | 2D-SWE (Aixplorer) | SS markedly increased in HES compared with controls; correlated with periportal fibrosis patterns and clinical morbidity scores. |
| Ahmad et al. (2019) | HIV-associated NCPH | 11 HIV + NCPH, 5 HIV + ddI, 9 HIV controls | p-SWE (Philips EPIQ7) | Median SS 76.3 kPa in NCPH vs. 20.8 kPa (ddI-exposed) and 18.4 kPa (controls). Cutoff 25.4 kPa, AUROC 0.948, Se 91%, Sp 93%. Correlated with CD4 counts, platelets, and bilirubin. |
[i] AUC – area under the curve; AUROC – area under the receiver operating characteristic curve; HES – hepatosplenic schistosomiasis; NCPH – non-cirrhotic portal hypertension; ns – not significant; SS – splenic stiffness; 2D-SWE – two-dimensional shear wave elastography; p-SWE – point shear wave elastography
Tab. 6.
Splenic shear wave elastography in pediatric non-portal settings
| Author | N | Age range | Technique | Values | Notes |
|---|---|---|---|---|---|
| Postek et al. (2025) | 44 | Term neonates | 2D-SWE | 2.36 m/s (~17 kPa) | High feasibility; no correlation with fasting duration >60 min. |
| Cetin et al. (2024) | 2781 | Children/adolescents | 2D-SWE | PH: 38.6 ± 15.2 kPa; BLH: 21.7 ± 9.8 kPa; Controls: 19.6 ± 8.4 kPa; MI: 18.5 ± 7.6 kPa | BLH > controls/MI (ns); MI < PH (p <0.05). |
| Bhatia et al. (2022) | 146 | 2–15 years | p-SWE (ElastPQ) | ≤5 years: 5.6 ± 4.2 kPa; 5–10 years: 6.5 ± 3.2 kPa; 10–15 years: 5.9 ± 3.6 kPa | No sex difference; slight correlation with spleen length. |
| Hanquinet et al. (2021) | 102 | 8 weeks–17 years | p-SWE | 2.43 ± 0.31 m/s | No effect of age or scanning plane. |
| Calışkan et al. (2019) | 58 (21 HIV, 37 controls) | Pediatric | 2D-SWE | HIV: 18.7 kPa (2.5 m/s); Controls: 16.8 kPa (2.4 m/s) | Higher SS in HIV despite normal US/laboratory findings. |
| Plabiyik et al. (2017) | 50 | Newborns–infants | SWE | 2.03 m/s | Provides neonatal reference values. |
| Cañas et al. (2015) | 60 | 1 day–14 years | p-SWE | 2.17 m/s (convex), 2.15 m/s (linear) | No difference between probes; higher variability with convex. |
| Cañas et al. (2015) | 72 CF patients | Pediatric | p-SWE | Higher than controls (exact values not specified) | Increase without clear clinical consequences. |
| Lee et al. (2013) | 202 | Pediatric | p-SWE | 2.25 m/s | Age-related variation significant (p <0.001). |