
Introduction
Elastography has revolutionized the non-invasive evaluation of tissue biomechanics by providing quantitative information on tissue stiffness and elasticity. Initially introduced for staging liver fibrosis and monitoring chronic liver disease, shear wave elastography (SWE) has progressively expanded to the assessment of portal hypertension, where spleen stiffness measurement (SSM) has demonstrated a strong correlation with portal pressure and the risk of variceal bleeding(1,2,3,4). In fact, recent consensus statements have recognized SSM as a valuable complement to liver stiffness measurement in the risk stratification of patients with advanced chronic liver disease(2,3).
Beyond its established role in portal hypertension, the spleen has emerged as a promising diagnostic window into systemic disorders. In hematology, splenic stiffness reflects extramedullary hematopoiesis, bone marrow fibrosis, and vascular remodeling in myeloproliferative neoplasms, suggesting potential utility for diagnosis and longitudinal monitoring(5,6). In cardiology, SSM captures venous congestion and right-sided cardiac dysfunction, with implications for both acute and chronic heart failure, as well as congenital circulatory states such as Fontan physiology. Pediatric studies have established reference values and explored applications in congenital, metabolic, and inflammatory diseases, confirming the feasibility of splenic SWE across all age groups(7). Moreover, splenic stiffness may increase in infectious, infiltrative, and systemic inflammatory conditions, highlighting its versatility as a biomarker of both vascular and parenchymal remodeling(6,8).
Despite these advances, several challenges continue to limit widespread clinical adoption. Variability among ultrasound vendors, the lack of harmonized acquisition protocols, and physiological confounders such as respiratory phase and postprandial status reduce reproducibility and generalizability(8). Furthermore, most data outside hepatology derive from small, single-center cohorts, and disease-specific thresholds remain undefined.
This review summarizes the available evidence regarding splenic SWE in non-portal contexts, including hematologic, cardiologic, infectious, inflammatory, and pediatric conditions. By integrating technical, clinical, and methodological perspectives, it aims to outline the potential of splenic elastography as a non-invasive biomarker and to identify priorities for future research(3,5,6,7,8).
Taken together, these heterogeneous conditions highlight the spleen as a dynamic systemic organ whose biomechanical properties reflect vascular, inflammatory, and infiltrative processes beyond portal hypertension. The main non-portal clinical settings in which splenic shear wave elastography has been investigated are schematically summarized in Fig. 1.
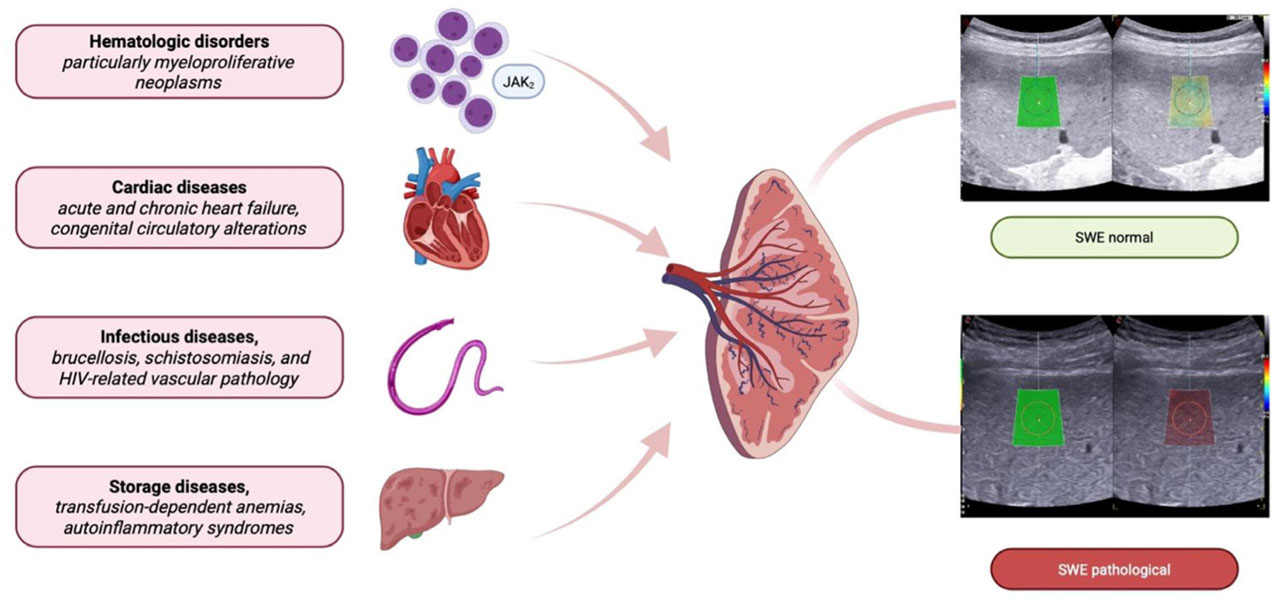
Fig. 1.
Non-portal applications of splenic shear wave elastography (SWE). Schematic representation of the main systemic conditions associated with altered splenic stiffness, including hematologic disorders (particularly myeloproliferative neoplasms), cardiac diseases (acute/chronic heart failure and congenital circulatory alterations), infectious diseases (such as brucellosis, schistosomiasis, and HIV-related vascular pathology), and storage or autoinflammatory disorders (e.g., transfusion-dependent anemias and Gaucher disease). These heterogeneous mechanisms – ranging from fibrosis and vascular remodeling to venous congestion, inflammatory infiltration, and parenchymal storage – can modify splenic biomechanics and lead to increased stiffness on SWE. Example ultrasound images show a normal splenic stiffness measurement (upper panel) and a pathological stiffness pattern (lower panel)
Normal splenic SWE values in adults
In healthy adults, splenic stiffness measured by point shear wave elastography (p-SWE) and two-dimensional shear wave elastography (2D-SWE) generally falls within the range of 13–20 kPa, although reported values vary according to device and acquisition protocol (Tab. 1). Medium- to large-scale studies consistently support this distribution. Pawlus and colleagues reported mean values of 16.6 ± 2.5 kPa using 2D-SWE (Aixplorer), whereas Giuffrè et al. found values of 18.1 ± 3.1 kPa with p-SWE and demonstrated excellent reproducibility. Cho et al. described higher values of approximately 20.5 ± 5.4 kPa in more than 300 subjects examined with 2D-SWE (Aixplorer). Other studies have provided slightly different estimates, with Albayrak et al. documenting a mean value of 13.8 ± 2.9 kPa in 127 volunteers, whereas Patil et al. reported values of 22.9 ± 9.5 kPa in healthy controls, significantly lower than the 32.1 ± 12.5 kPa observed in patients with splenomegaly. Overall, despite these variations, most studies converge on a relatively narrow physiologic range that appears independent of sex, age, and spleen size(9,10,11,12,13). Reproducibility has been a recurring focus of investigation. Giuffrè et al. demonstrated excellent intra- and interobserver agreement with p-SWE, while Kishimoto et al., using Siemens VTQ, confirmed a median splenic stiffness of 2.5 m/s (interquartile range (IQR) ~0.7), with high intra-operator consistency (intraclass correlation coefficient (ICC) >0.85) but lower inter-operator reliability (ICC ~0.65). These data suggest that splenic SWE can be performed with good repeatability in controlled settings, although operator training and acquisition conditions remain critical(10,14).
Tab. 1.
Splenic shear wave elastography in healthy subjects
| Author | No. | Technique | Mean/median value | Protocol | Notes |
|---|---|---|---|---|---|
| Luekiatphaisan et al. (2025) | 44 | 2D-SWE (GE LOGIQ E10) | 12.6 ± 1.2 kPa | Supine; intercostal approach; fasting and postprandial states compared. | Independent of sex, age, spleen size; postprandial decline at 180 min. |
| Patil et al. (2024) | 28 | p-SWE (Samsung HS70A) | 22.9 ± 9.5 kPa | Supine/right lateral decubitus; left arm elevated; intercostal and subcostal; breath-hold; 3 locations (upper, hilum, lower pole); 9 acquisitions averaged. | Controls significantly lower than splenomegaly (32.1 ± 12.5 kPa); correlation with spleen size (ρ = 0.48). |
| Giuffrè et al. (2019) | 100 | p-SWE | 18.1 ± 3.1 kPa | Intercostal approach; supine/left lateral decubitus; fasting; median of 10 valid acquisitions. | Excellent intra-/inter-observer reproducibility. |
| Kishimoto et al. (2019) | 30 | p-SWE (Siemens VTQ) | 2.5 m/s (IQR ~0.7) | Supine, intercostal; breath-hold after light inspiration; 5 repeated acquisitions. | High intra-operator ICC (>0.85); lower inter-operator ICC (~0.65). |
| Albayrak et al. (2019) | 127 | 2D-SWE (GE LOGIQ E9) | 13.8 ± 2.9 kPa | Supine; intercostal approach; fasting ≥4 h; ROI 1–2 cm below capsule; multiple acquisitions. | No effect of age, sex, or BMI. |
| Cho et al. (2018) | 313 | 2D-SWE (Aixplorer) | 20.5 ± 5.4 kPa | Supine; left intercostal/subcostal approach; fasting ≥8 h; measurements during quiet breathing. | Large cohort; excluded chronic liver disease and splenomegaly. |
| Pawlus et al. (2016) | 59 | 2D-SWE (Aixplorer) | 16.6 ± 2.5 kPa | Supine, left intercostal approach, fasting; breath-hold at end-expiration; ≥5 valid measurements. | No effect of sex, age, or spleen size; repeatability acceptable. |
Multi-vendor comparisons highlight the impact of technical factors. Nowotny and colleagues demonstrated that absolute values differed substantially across Siemens, Philips, Toshiba, and GE platforms, indicating that measurements are not directly interchangeable. Moreover, physiological conditions may influence stiffness. Luekiatphaisan et al. reported a significant decline in splenic stiffness three hours after meal ingestion (from 12.6 ± 1.2 kPa in fasting state), underscoring the effect of postprandial hemodynamics. Earlier reports also noted variability related to respiratory phase, with higher values during deep inspiration compared with expiration. Collectively, these findings stress the importance of standardized acquisition protocols, including fasting status, breathing instructions, and probe positioning(15,16).
Recent data from Viceconti et al. further underscore the impact of acquisition parameters on splenic SWE. In their cohort, measurement reliability improved when 10 p-SWE measurements were obtained, whereas protocols using only five acquisitions frequently resulted in unreliable values. Similarly, 2D-SWE measurements were more stable with a 15-mm region of interest (ROI) than with a 10-mm ROI. These findings highlight how both the number of measurements and ROI size influence technical feasibility and should therefore be standardized when defining normal reference ranges(17).
Taken together, evidence from p-SWE and 2D-SWE studies indicates that, in healthy adults, splenic stiffness typically ranges from 13 to 20 kPa, although variability between vendors and protocols can broaden this interval. Establishing device-specific reference ranges and standardized measurement criteria is essential before splenic SWE can be incorporated into clinical practice. Moreover, the Baveno VII consensus proposes a spleen stiffness threshold of <21 kPa to rule out clinically significant portal hypertension (CSPH). Although this cutoff was derived from transient elastography and has not yet been validated for 2D-SWE, it nonetheless provides a pragmatic reference point: a spleen stiffness value below 21 kPa in a healthy adult is reasonably expected to fall within the normal physiological range(18).
Splenic SWE in hematologic disorders
Hematologic disorders provided some of the earliest non-portal applications of splenic SWE, particularly in myeloproliferative neoplasms (MPN) and myelofibrosis (MF). The concept of splenic stiffness as a surrogate was initially explored using transient elastography, which suggested correlations with bone marrow fibrosis but proved technically limited(19). Shear wave–based methods have since offered more robust and reproducible insights.
Several studies have investigated the role of SWE in differentiating the etiology of splenomegaly. Batur et al. reported mean splenic shear wave velocities of 3.27 ± 0.36 m/s in hepatoportal disease, 2.98 ± 0.33 m/s in myeloproliferative disorders, 2.44 ± 0.21 m/s in infectious causes, and 2.08 ± 0.19 m/s in healthy controls, with statistically significant differences among groups (p = 0.001)(20). Similarly, Yalçın et al. found median values of 3.85 m/s for hepatoportal disease, 3.42 m/s for myeloproliferative disorders, 2.66 m/s for infectious splenomegaly, and 2.22 m/s in controls. ROC analysis identified cutoff values of 3.42 m/s for distinguishing hepatoportal from myeloproliferative causes (sensitivity 80.9%, specificity 56.5%), 3.02 m/s for hepatoportal versus infectious causes (100% sensitivity and specificity), and 2.84 m/s for myeloproliferative versus infectious etiologies (sensitivity 91.3%, specificity 88.2%)(21). These findings support the concept that different pathogenic mechanisms – fibrosis in hepatoportal disease, cellular proliferation in myeloproliferative disorders, and inflammatory infiltration in infectious conditions – yield distinct stiffness profiles, thereby broadening the potential applications of splenic SWE beyond MPN to a wide range of hematologic and systemic diseases.
Within MPN, several studies have confirmed a clear disease-related gradient. Webb et al. demonstrated that patients with MF exhibited higher splenic stiffness than controls (32.9 kPa vs. 18.1 kPa), although values overlapped with those observed in cirrhosis (40.5 kPa)(22). Ekinci et al. reported median values of 0.82 m/s in healthy subjects, 1.41 m/s in polycythemia vera (PV) / essential thrombocythemia (ET), and 2.32 m/s in secondary MF, with a strong correlation to bone marrow fibrosis grade (r = 0.757, p <0.001)(23). In a larger cohort, Sansone et al. observed that patients with MF had significantly higher stiffness than ET, PV, and controls, with median values of 37.9 kPa (p-SWE) and 31.65 kPa (2D-SWE) compared with 23.4 kPa and 20.1 kPa in healthy volunteers. The authors proposed cutoff values of ≥33.1 kPa (p-SWE) for fibrosis ≥2 (area under the receiver operating characteristic curve (AUROC) 0.702) and ≥25.6 kPa (2D-SWE) for MF (AUROC 0.752), also linking higher values to splanchnic thrombosis and homozygous JAK2 mutation(24).
Outside MPN, findings are less consistent. In a cohort of 40 patients with splenomegaly of various etiologies, Alhyari et al. reported mean velocities of 3.25 ± 0.68 m/s in hematologic malignancies, 3.52 ± 0.47 m/s in congestive cases, and 2.84 ± 0.92 m/s in immune-related disease, with no significant differences among groups(25).
Taken together, splenic SWE emerges as a promising adjunct in MPN, where it reflects marrow fibrosis severity and vascular complications (Tab. 2), whereas its role in other hematologic disorders remains uncertain because of limited diagnostic specificity. No studies have yet evaluated splenic stiffness by SWE in lymphoma or other lymphoproliferative disorders, despite the frequent splenic involvement in these conditions. Ultrasound-based quantification could complement PET/CT by helping distinguish reactive from malignant splenomegaly and enabling longitudinal monitoring. Similarly, although SWE has been explored for early detection of sinusoidal obstruction syndrome (SOS) after HSCT(26,27), its application to splenic stiffness has not been studied. Given the association of both lymphomas and SOS with splenomegaly, splenic SWE warrants investigation as a potential non-invasive biomarker.
Tab. 2.
Splenic shear wave elastography in hematologic diseases
| Author | Design | Population | Technique | Reference standard | Main results |
|---|---|---|---|---|---|
| Alhyari et al. (2024) | Prospective acquisition, retrospective analysis | 40 patients with splenomegaly (hematologic malignancies, congestive, immune-related causes) | p-SWE-SSM (Siemens, m/s) | Clinical diagnosis / etiology classification | Mean SS: malignant 3.25 ± 0.68 m/s; congestive 3.52 ± 0.47 m/s; immune 2.84 ± 0.92 m/s. |
| Sansone et al. (2024) | Prospective cross-sectional, single center | 218 patients with MPN (MF, PV, ET) + healthy volunteers | p-SWE-SSM and 2D-SWE-SSM (Esaote, kPa) | Bone marrow fibrosis grade | MF median SS: p-SWE 37.9 kPa; 2D-SWE 31.65 kPa vs. HV 23.4 and 20.1. Cutoffs: p-SWE ≥33.1 kPa for fibrosis ≥2 (AUROC 0.702); 2D-SWE ≥25.6 kPa for MF (AUROC 0.752). Associations with advanced fibrosis, thrombosis, and JAK2 homozygosity. |
| Omer et al. (2021) | Prospective cross-sectional, single center | 121 participants (52 HV, 52 PV/ET, 17 secondary MF) | 2D-SWE-SSM (Philips, m/s) | Bone marrow histology (fibrosis) | Median SS: HV 0.82 m/s; PV/ET 1.41 m/s; MF 2.32 m/s. Strong correlation with fibrosis grade (r = 0.757, p <0.001). |
| Yalçın et al. (2021) | Prospective | 61 patients with splenomegaly (21 hepatoportal, 23 MPN, 17 infectious) + 20 controls | p-SWE (ARFI, Siemens) Clinical, serology, marrow | Clinical assessment, serology, bone marrow evaluation | Median SS: hepatoportal 3.85 m/s, MPN 3.42 m/s, infectious 2.66 m/s, controls 2.22 m/s. Cutoffs: 3.42 (hepatoportal vs. MPN), 3.02 (hepatoportal vs. infectious), 2.84 (MPN vs. infectious). |
| Batur et al. (2019) | Prospective | 73 patients with splenomegaly (19 hepatoportal, 21 MPN, 16 infectious) + 17 controls | p-SWE (ARFI, Siemens) | Clinical assessment, serology, bone marrow evaluation | SS significantly higher in hepatoportal (3.27 m/s) vs. MPN (2.98 m/s) vs. infectious (2.44 m/s) vs. controls (2.08 m/s). Cutoffs: >3.10 m/s (hepatoportal vs. MPN), >2.77 m/s (hepatoportal vs. infectious), >2.75 m/s (MPN vs. infectious). |
| Webb et al. (2015) | Prospective pilot, single center | 9 patients with MF, 11 with cirrhosis, 8 healthy volunteers | 2D-SWE-SSM (Aixplorer, kPa) | Nonspecific (comparison groups) | Mean SS: MF 32.9 kPa; cirrhosis 40.5 kPa; controls 18.1 kPa. MF and cirrhosis > controls but not distinguishable. Correlation with spleen size (r ≈ 0.49) and with TE (r ≈ 0.78). |
[i] AUROC – area under the receiver operating characteristic curve; 2D-SWE – two-dimensional shear wave elastography; ET – essential thrombocythemia HV – healthy volunteers; MF – myelofibrosis; MPN – myeloproliferative neoplasms; PV – polycythemia vera; SSM – spleen stiffness measurement; SS – splenic stiffness; SWE – shear wave elastography; TE – transient elastography
Splenic SWE in cardiac diseases
The application of splenic SWE has recently expanded into cardiology, where splenic congestion reflects systemic hemodynamics and aligns with the emerging concept of the cardio-splenic axis.
In acute decompensated heart failure (ADHF), Saito et al. showed that splenic stiffness (SS), measured by 2D-SWE at discharge, correlated positively with right atrial pressure (r = 0.47, p <0.001) and independently predicted adverse events. Patients in the highest SS tertile (≥18.9 kPa) had significantly higher NT-proBNP levels, more severe tricuspid regurgitation, and larger right ventricular diameters. Over a median follow-up of 105 days, elevated SS was independently associated with mortality and re-hospitalization, even after adjustment for conventional risk scores and liver stiffness(28).
In chronic heart failure, Misaka et al. evaluated 232 patients and demonstrated that higher spleen SWE and shear wave dispersion (SWD) values were independently associated with adverse cardiac outcomes. Patients in the highest tertile of spleen SWE (>2.52 m/s) had markedly reduced event-free survival (p <0.0001). In multivariable Cox analysis, spleen SWE (HR 4.97, p = 0.003) and SWD (HR 1.38, p <0.0001) independently predicted cardiac death and re-hospitalization. Mechanistic analysis showed an association between elevated spleen stiffness and upregulation of CD36 mRNA in circulating leukocytes, supporting a role for splenic immune activation in heart failure progression(29).
The Fontan circulation represents another setting in which spleen SWE has been explored. In pediatric patients after the Fontan procedure, Aliyev et al. found significantly higher splenic stiffness compared with healthy controls (25.6 ± 4.6 vs. 15.9 ± 1.4 kPa, p <0.001), with positive correlations between SS and coagulation parameters such as prothrombin time and INR(30). Conversely, in adults, Simmons et al. reported no significant difference in SS between Fontan patients and controls (1.43 vs. 1.36 m/s, p = 0.26), although the spleen-to-liver stiffness ratio (SS/LS <1 in most cases) was distinctively lower than in other chronic liver diseases, suggesting that SS may offer additional insights into Fontan-associated portal hemodynamics(31). More recently, Venkatakrishna et al. compared spleen SWE with histology in 22 post-Fontan patients and found no correlation between splenic stiffness (median 2.94 m/s) and liver fibrosis scores, suggesting that SS may not serve as a surrogate for Fontan-associated liver disease(32).
Evidence from cardiac populations indicates that SS measured by SWE does not simply mirror the mechanisms of portal hypertension seen in chronic liver disease. In acute and chronic heart failure, SS correlates with indices of systemic venous congestion, including right atrial pressure, tricuspid regurgitation severity, and elevated natriuretic peptides, and independently predicts adverse outcomes(28,29). These findings suggest that in heart failure, SS primarily reflects systemic venous congestion and right heart dysfunction rather than intrahepatic resistance or classic portal hypertension.
In patients with Fontan circulation, the relationship is more complex. Pediatric cohorts demonstrate increased SS compared with controls, consistent with the hemodynamic burden of the Fontan pathway(30), whereas in adults SS values are often comparable to healthy individuals despite universally elevated liver stiffness. Studies in this setting have shown that the SS-to-LS ratio is frequently <1, contrasting with the pattern seen in cirrhosis and portal hypertension, and that SS does not correlate with histological fibrosis(31,32). These results suggest that in Fontan physiology, passive hepatic congestion is not consistently transmitted to the splenic circulation, limiting the role of SS as a surrogate for portal hypertension or liver fibrosis.
Collectively, these findings indicate that splenic SWE has prognostic value in both acute and chronic heart failure (HF), reflecting residual congestion and right heart dysfunction. In Fontan patients, however, SS appears less informative, particularly in adults, where it fails to correlate with liver fibrosis or portal hypertension, underscoring the need for further longitudinal validation (Tab. 3).
Tab. 3.
Splenic shear wave elastography in cardiac diseases
| Author | Population | Technique | Main results |
|---|---|---|---|
| Venkatakrishna et al. (2024) | 22 Fontan patients (7–30 years) with liver biopsy | p-SWE (Siemens) | Median SS 2.94 m/s; no correlation with Ishak/METAVIR/CHFS fibrosis scores; correlated only with spleen size. |
| Misaka et al. (2023) | 232 chronic HF patients | 2D-SWE + shear wave dispersion | High SS (>2.52 m/s) and SWD predicted cardiac death/re-hospitalization. SS associated with CD36 mRNA upregulation. |
| Simmons et al. (2021) | 18 adult Fontan patients vs. 18 controls | 2D-SWE (Philips EPIC 7) | SS similar to controls (1.43 vs. 1.36 m/s, p = 0.26); LS elevated; SS/LS ratio <1 in most patients. |
| Saito et al. (2020) | 176 patients with acute decompensated HF | 2D-SWE | Higher SS at discharge correlated with right atrial pressure (r = 0.47, p <0.001), tricuspid regurgitation, NT-proBNP. SS ≥18.9 kPa predicted mortality/re-hospitalization. |
| Aliyev et al. (2020) | 30 children after Fontan procedure vs. 30 controls | p-SWE (Philips iU22) | SS higher in Fontan patients (25.6 ± 4.6 kPa) vs. controls (15.9 ± 1.4 kPa, p <0.001); correlated with PT/INR. |
Splenic SWE in storage and inflammatory disorders
Splenic SWE has also been investigated in inherited storage diseases and systemic autoinflammatory conditions, in which splenomegaly and parenchymal infiltration are common hallmarks.
In Gaucher disease type 1 (GD1), both transient elastography and 2D-SWE studies have shown significantly higher splenic stiffness compared with healthy controls. Webb et al. reported median spleen stiffness values of 35 kPa (TE) and 22 kPa (SWE) in GD1, higher than those observed in healthy controls (≈17 kPa) but lower than those reported in cirrhosis (≈45 and 34.5 kPa, respectively), suggesting that SWE may help differentiate Gaucher-related splenomegaly from portal hypertensive splenomegaly(33). Lollert et al., using ARFI-based p-SWE in 50 patients with GD1, confirmed that splenic stiffness correlated with multiple disease-related parameters, including body mass index, triglycerides, gamma-GT, and showed a near-significant association with the GD-DS3 severity score (p = 0.059, significant when untreated patients were excluded). Importantly, splenic stiffness was higher in patients with osteonecrosis and in those lacking the protective N370S/N370S genotype, supporting its potential as a non-invasive marker of disease severity(34).
In beta-thalassemia major, chronic transfusions and iron overload may alter splenic tissue properties. In a cohort of 103 patients, Hattapoğlu et al. demonstrated that splenic p-SWE values were significantly higher than those in healthy controls (median 2.39 vs. 2.19 m/s, p = 0.014). However, unlike hepatic stiffness, splenic stiffness did not correlate with MRI T2* or ferritin levels, suggesting that increased stiffness may reflect tissue remodeling and extramedullary hematopoiesis rather than iron overload itself(35).
In familial Mediterranean fever (FMF), a chronic autoinflammatory condition associated with amyloid deposition, splenic stiffness has been less consistently affected. In adults, Akti et al. found no significant difference in splenic stiffness between patients with FMF and controls (mean 14.3 vs. 14.0 kPa, p = 0.37), despite significantly increased liver stiffness(36). In contrast, pediatric studies have suggested that splenic stiffness may rise in FMF complicated by amyloidosis, although the evidence remains limited(37).
Collectively, these observations suggest that, in storage and systemic inflammatory disorders, splenic SWE may capture organ infiltration and parenchymal remodeling; however, further studies are needed to determine its specificity and prognostic role (Tab. 4).
Tab. 4.
Splenic shear wave elastography in storage and autoinflammatory disorders
| Author | Population | Technique | Main results |
|---|---|---|---|
| Salih et al. (2024) | 103 β-thalassemia major vs. 30 controls | p-SWE (Philips) | Median SS: 2.39 m/s in thalassemia vs. 2.19 m/s in controls (p = 0.014). No correlation with MRI T2* or ferritin. |
| Serdar et al. (2023) | 74 adult FMF patients vs. 40 controls | 2D-SWE (Samsung) | Mean SS: 14.3 vs. 14.0 kPa, p = 0.37. LS significantly increased in FMF. |
| Bayramoğlu et al. (2021) | Pediatric FMF with/without amyloidosis | p-SWE | Increased SS in FMF children with amyloidosis; normal values in uncomplicated FMF. |
| Lollert et al. (2020) | 50 GD1 patients (ERT and untreated) | p-SWE (Siemens) | Median SS: 2.54 m/s. SS correlated with BMI, triglycerides, GGT; association with GD-DS3 score when untreated patients were excluded. Higher SS in osteonecrosis and in non-N370S/N370S genotype. |
| Webb et al. (2018) | 42 GD1, 33 cirrhosis, 22 healthy controls | 2D-SWE (Aixplorer) | Median SS: GD 35 kPa (TE), 22 kPa (SWE); controls 17 kPa; cirrhosis 45 (TE), 34.5 (SWE). AUC SWE > TE for distinguishing GD vs. cirrhosis. |
[i] AUC – area under the curve; BMI – body mass index; GD1 – Gaucher disease type 1; GD-DS3 – Gaucher Disease Type 1 Severity Scoring System; GGT – gamma-glutamyl transferase; LS – liver stiffness; FMF – familial Mediterranean fever; SS – splenic stiffness; 2D-SWE – two-dimensional shear wave elastography; p-SWE – point shear wave elastography; TE – transient elastography
To date, no published studies have investigated splenic stiffness using SWE in systemic autoimmune or inflammatory disorders such as systemic lupus erythematosus, rheumatoid arthritis, or sarcoidosis. Since these conditions are frequently associated with splenomegaly and immune-mediated tissue remodeling, splenic SWE could represent a valuable non-invasive tool for assessing disease activity and organ involvement. This lack of evidence highlights a relevant research gap deserving future attention.
Splenic SWE in infectious diseases
Among infectious diseases, splenic SWE has been investigated in conditions with significant reticuloendothelial or vascular involvement, including brucellosis, schistosomiasis, and HIV-related non-cirrhotic portal hypertension (NCPH).
In acute brucellosis, Dogan et al. compared 40 patients with 60 healthy controls using p-SWE (Philips Epic 7). Splenic stiffness was markedly higher in patients (3.24 ± 1.80 kPa vs. 1.38 ± 0.62 kPa, p <0.001), with excellent diagnostic accuracy (AUC 0.903) and an optimal cutoff value of 1.63 kPa(38). These findings indicate that splenic SWE may serve as a sensitive adjunctive tool for the non-invasive diagnosis of acute brucellosis by capturing inflammatory involvement of the reticuloendothelial system. Notably, the absolute spleen stiffness values reported in this study were lower than those typically observed in healthy adults, a discrepancy that may reflect technique-specific factors and warrants confirmation in future studies.
In a broader cohort of patients with splenomegaly, Batur et al. also included patients with brucellosis, infectious mononucleosis, tuberculosis, and typhoid fever, reporting lower splenic stiffness values in the infectious subgroup (2.44 ± 0.21 m/s) compared with hepatoportal (3.27 ± 0.36 m/s) and myeloproliferative (2.98 ± 0.33 m/s) causes, suggesting that inflammatory infiltration and tissue damage may not produce the same degree of stiffness increase observed in fibrosis- or congestion-related splenomegaly(20). Similarly, Yalçın et al. analyzed 61 patients with splenomegaly, including infectious etiologies such as mononucleosis, cytomegalovirus infection, and malaria, and confirmed that the infectious subgroup exhibited significantly lower stiffness values (median 2.66 m/s) than the hepatoportal (3.85 m/s) and myeloproliferative (3.42 m/s) groups(21).
In hepatosplenic schistosomiasis (HES), splenic stiffness is consistently elevated, reflecting the presinusoidal portal hypertension characteristic of the disease. Pereira et al. showed significantly higher stiffness in schistosomiasis patients compared with controls, with correlations to clinical morbidity scores and periportal fibrosis patterns. Veiga et al. reported even higher values, with a median splenic stiffness of 55.7 kPa (19.1–119.4) in 26 HES patients, exceeding those typically observed in cirrhosis. Importantly, reproducibility was excellent, as a single measurement strongly correlated with the median of multiple acquisitions(39,40). These findings highlight the ability of splenic SWE to capture the distinct vascular remodeling associated with schistosomiasis.
In HIV-associated NCPH, Ahmad et al. demonstrated markedly elevated spleen stiffness (median 76.3 kPa) compared with ddI-exposed (20.8 kPa) and unexposed controls (18.4 kPa). Using p-SWE, spleen stiffness outperformed liver stiffness in detecting NCPH (AUROC 0.948, cutoff 25.4 kPa, Se 91%, Sp 93%). Moreover, stiffness correlated with nadir CD4, current CD4, platelet count, and bilirubin(41). These findings underscore the diagnostic superiority of splenic over hepatic SWE in this context and its potential for non-invasive monitoring.
Altogether, splenic SWE emerges as a versatile tool in infectious diseases: it detects acute inflammatory infiltration in brucellosis, quantifies vascular remodeling in schistosomiasis, and accurately identifies HIV-associated NCPH (Tab. 5). The distinct pathophysiological mechanisms underlying these conditions illustrate the adaptability of splenic SWE, although disease-specific reference ranges and longitudinal studies are still required to clarify its prognostic significance.
Tab. 5.
Splenic shear wave elastography in infectious diseases
| Author | Disease | Population | Technique | Main results |
|---|---|---|---|---|
| Dogan et al. (2023) | Brucellosis | 40 patients with acute brucellosis vs. 60 healthy controls | p-SWE (Philips Epic 7) | Mean SS 3.24 ± 1.80 kPa in brucellosis vs. 1.38 ± 0.62 kPa in controls (p <0.001). Cutoff 1.63 kPa, AUC 0.903, sensitivity 80%, specificity 85%. |
| Pereira et al. (2021) | Hepatosplenic schistosomiasis (HES) | 74 patients with S. mansoni | p-SWE and 2D-SWE | SS markedly increased in HES compared with controls; correlated with periportal fibrosis patterns and clinical morbidity scores. |
| Veiga et al. (2021) | Hepatosplenic schistosomiasis (HES) | 26 patients with portal hypertension due to S. mansoni | 2D-SWE (Aixplorer) | SS markedly increased in HES compared with controls; correlated with periportal fibrosis patterns and clinical morbidity scores. |
| Ahmad et al. (2019) | HIV-associated NCPH | 11 HIV + NCPH, 5 HIV + ddI, 9 HIV controls | p-SWE (Philips EPIQ7) | Median SS 76.3 kPa in NCPH vs. 20.8 kPa (ddI-exposed) and 18.4 kPa (controls). Cutoff 25.4 kPa, AUROC 0.948, Se 91%, Sp 93%. Correlated with CD4 counts, platelets, and bilirubin. |
[i] AUC – area under the curve; AUROC – area under the receiver operating characteristic curve; HES – hepatosplenic schistosomiasis; NCPH – non-cirrhotic portal hypertension; ns – not significant; SS – splenic stiffness; 2D-SWE – two-dimensional shear wave elastography; p-SWE – point shear wave elastography
Splenic SWE in pediatric healthy and non-portal settings
The definition of normal splenic stiffness in children has been addressed in several prospective studies. Cañas et al. reported mean shear wave velocities of 2.17 m/s (convex probe) and 2.15 m/s (linear probe) in 60 healthy children (1 day–14 years), with no difference between transducers, although variability was greater with convex probes(42). Hanquinet et al. confirmed comparable values in 102 children (8 weeks–17 years), reporting a median velocity of 2.43 ± 0.31 m/s, with no effect of age or scanning plane(43). Lee et al. studied 202 children and found a mean splenic stiffness of 2.25 m/s, with age-related differences (p <0.001)(44). In neonates, Plabiyik et al. reported a mean value of 2.03 m/s in 50 healthy newborns and infants(45), while Postek et al. documented 2.36 m/s (~17.0 kPa) in term neonates using 2D-SWE, demonstrating high feasibility and no correlation with feeding interval(46). More recently, Bhatia et al. used ElastPQ in 146 children (2–15 years) and found mean values of 5.6 ± 4.2 kPa (≤5 years), 6.5 ± 3.2 kPa (>5–10 years), and 5.9 ± 3.6 kPa (>10–15 years), with no sex differences and only a mild association with spleen length(47). Collectively, these studies indicate that normal pediatric splenic stiffness typically ranges around 2.2–2.5 m/s (~15–18 kPa) in older children, with slightly lower values in neonates.
Beyond physiological values, splenic SWE has also been evaluated in pediatric conditions unrelated to portal hypertension. In a large cohort of 2,781 children, Cetin et al. compared several clinical groups and observed the highest stiffness values in portal hypertension (38.6 ± 15.2 kPa). Benign lymphoid hyperplasia (21.7 ± 9.8 kPa) showed slightly higher values than healthy controls (19.6 ± 8.4 kPa) and malignant infiltration (18.5 ± 7.6 kPa), although these differences did not reach statistical significance. Notably, malignant infiltration values were significantly lower than those observed in portal hypertension, suggesting potential utility in the differential diagnosis of splenomegaly(48). In systemic infections, Calışkan et al. demonstrated that HIV-infected children had significantly higher splenic stiffness (18.7 kPa/2.5 m/s) compared with healthy peers (16.8 kPa/2.4 m/s), despite normal ultrasound and laboratory findings, indicating that splenic SWE may detect early parenchymal involvement(49). Finally, in cystic fibrosis, Cañas et al. observed higher velocities in affected children than in controls, although without clear clinical implications, suggesting a possible signal of tissue remodeling(50).
Altogether, pediatric data demonstrate that splenic SWE is feasible across all age groups, with emerging reference values and promising applications in selected non-portal conditions. While diagnostic specificity remains to be established, these results highlight the potential of splenic SWE as a non-invasive adjunct in the evaluation of pediatric splenomegaly (Tab. 6).
Tab. 6.
Splenic shear wave elastography in pediatric non-portal settings
| Author | N | Age range | Technique | Values | Notes |
|---|---|---|---|---|---|
| Postek et al. (2025) | 44 | Term neonates | 2D-SWE | 2.36 m/s (~17 kPa) | High feasibility; no correlation with fasting duration >60 min. |
| Cetin et al. (2024) | 2781 | Children/adolescents | 2D-SWE | PH: 38.6 ± 15.2 kPa; BLH: 21.7 ± 9.8 kPa; Controls: 19.6 ± 8.4 kPa; MI: 18.5 ± 7.6 kPa | BLH > controls/MI (ns); MI < PH (p <0.05). |
| Bhatia et al. (2022) | 146 | 2–15 years | p-SWE (ElastPQ) | ≤5 years: 5.6 ± 4.2 kPa; 5–10 years: 6.5 ± 3.2 kPa; 10–15 years: 5.9 ± 3.6 kPa | No sex difference; slight correlation with spleen length. |
| Hanquinet et al. (2021) | 102 | 8 weeks–17 years | p-SWE | 2.43 ± 0.31 m/s | No effect of age or scanning plane. |
| Calışkan et al. (2019) | 58 (21 HIV, 37 controls) | Pediatric | 2D-SWE | HIV: 18.7 kPa (2.5 m/s); Controls: 16.8 kPa (2.4 m/s) | Higher SS in HIV despite normal US/laboratory findings. |
| Plabiyik et al. (2017) | 50 | Newborns–infants | SWE | 2.03 m/s | Provides neonatal reference values. |
| Cañas et al. (2015) | 60 | 1 day–14 years | p-SWE | 2.17 m/s (convex), 2.15 m/s (linear) | No difference between probes; higher variability with convex. |
| Cañas et al. (2015) | 72 CF patients | Pediatric | p-SWE | Higher than controls (exact values not specified) | Increase without clear clinical consequences. |
| Lee et al. (2013) | 202 | Pediatric | p-SWE | 2.25 m/s | Age-related variation significant (p <0.001). |
Pathophysiological mechanisms underlying splenic SWE
Collectively, evidence from non-portal applications of splenic SWE highlights both the versatility of the method and the heterogeneity of its biological determinants. Distinct pathophysiological processes dominate across different contexts, including fibrosis and microvascular remodeling in myeloproliferative neoplasms, systemic venous congestion in acute and chronic heart failure, parenchymal infiltration in storage diseases, and inflammatory cell recruitment in infectious disorders. These differences likely account for the wide range of reported stiffness values and the variability in diagnostic accuracy and proposed thresholds. Of note, infectious splenomegaly frequently shows only modest increases in stiffness despite marked organ enlargement, suggesting that SWE reflects not merely volumetric expansion but rather the combined biomechanical effects of extracellular matrix deposition, vascular pressure, and cellular infiltration.
A further consistent observation is the superior diagnostic yield of splenic over hepatic stiffness in selected settings. This advantage is well established in portal hypertension and HIV-related non-cirrhotic portal hypertension, where splenic stiffness more closely mirrors clinically relevant hemodynamic changes. Similar findings have been reported in hematologic and infectious disorders, in which splenic involvement may precede or exceed hepatic manifestations. By contrast, in congenital circulatory conditions such as Fontan physiology, splenic stiffness appears less informative, suggesting that its diagnostic value is strongly context-dependent and should not be generalized indiscriminately.
Taken together, splenic SWE should be regarded less as a generic marker of splenomegaly and more as a dynamic biomarker of systemic pathophysiology, integrating signals from congestion, fibrosis, infiltration, and immune activation. To move toward clinical application, harmonization of acquisition protocols, definition of device-specific thresholds, and incorporation of multiparametric elastographic indices (e.g., SWD, attenuation) will be required. Equally critical will be prospective, multicenter validation in disease-specific cohorts to establish reproducibility, specificity, and prognostic value across the broad spectrum of non-portal disorders.
Technical considerations and future perspectives
Despite the expanding literature, several technical challenges continue to limit the adoption of splenic SWE in routine clinical practice. Chief among these is inter-vendor variability: absolute stiffness values differ substantially across platforms (e.g., Siemens, Philips, GE, Aixplorer, Esaote), precluding direct comparability. This issue, compounded by variation in measurement units (m/s vs. kPa), ROI size, probe type, and acquisition site, hampers the definition of universal cutoff values. Operator dependence remains a relevant factor: reproducibility improves with training and standardized protocols, yet performance in routine practice may be less consistent. Physiological factors, including respiratory phase and postprandial state, further contribute to variability, underscoring the need for harmonized acquisition criteria.
Looking ahead, technological innovation offers potential solutions. Artificial intelligence and radiomics may support automated ROI placement, texture characterization, and multiparametric analysis, thereby reducing operator dependency and enhancing reproducibility. Multiparametric SWE, combining stiffness with SWD (viscosity) and attenuation (steatosis), could provide a more comprehensive characterization of splenic parenchymal changes, differentiating congestion, infiltration, and fibrosis. Moreover, machine learning–based predictive models may enable disease-specific risk stratification, particularly in conditions where splenic involvement reflects systemic processes such as hematologic or cardiologic disorders.
Standardization of protocols, validation of device-specific reference ranges, and integration of multiparametric and AI-driven tools represent the key steps toward realizing the full clinical potential of splenic SWE.
Conclusions
Splenic SWE has demonstrated versatility across hematologic, cardiologic, infectious, and storage disorders, positioning itself as more than a surrogate marker of portal hypertension. By capturing signals of congestion, fibrosis, infiltration, and immune activation, it provides a unique window into systemic pathophysiology. While single-center studies have consistently shown promising diagnostic and prognostic correlations, heterogeneity in acquisition protocols and inter-vendor variability currently limit clinical translation. Looking forward, harmonized methodology, disease-specific cutoffs, and integration with multiparametric and AI-driven approaches will be required to ensure reproducibility and comparability. Ultimately, splenic SWE should be considered not only as a hepatology-related parameter but as a potential systemic biomarker applicable across multiple medical fields. Establishing its role through multicenter, prospective validation could enable its adoption as a reliable, non-invasive tool in both routine practice and clinical research.
Acknowledgements
Thanks to Fondazione Roma for its commitment to supporting our research.
This study received no grant from any funding agency.
Notes
[7] Contributed by Author contributions
Original concept of study: MP. Writing of manuscript: MP, SA, MSL, SM, GDA, EM, NV, FdP, FM, FRP, FS, AG, LR, MG. Analysis and interpretation of data: MP, SA, MSL, SM, GDA, EM, NV, FdP, FM, FRP, FS, AG, LR, MG. Final approval of the manuscript: MP, SA, MSL, SM, GDA, EM, NV, FdP, FM, FRP, FS, AG, LR, MG. Collection, recording and/or compilation of data: MP, SA, MSL, SM, GDA, EM, NV, FdP, FM, FRP, FS, AG, LR, MG. Critical review of manuscript: MP, SA, MSL, SM, GDA, EM, NV, FdP, FM, FRP, FS, AG, LR, MG