
Tab. 1.
Characteristics of the studied population
| Cases (N = 40) | |
|---|---|
| Chronic migraine (n) | 16.0 (40.0) |
| Episodic migraine (n) | 24.0 (60.0) |
| Years of illness (years) | 36.3 (11.4) |
| Therapy with anti-CGRP mAbs (months)* | 16.0 (6.5–31.0) |
| Triptans | 8.0 (20.0) |
| NSAIDs | 13.0 (32.5) |
| Paracetamol | 1.0 (2.5) |
| Opioids | 3.0 (7.5) |
| Triptans + NSAIDs | 14.0 (35.0) |
| NSAIDs + Paracetamol | 1.0 (2.5) |
| MIDAS T0* | 81.5 (65.3–114.8) |
| MIDAS T1* | 25.5 (17.5–33.8) |
| Fremanezumab 225 mg monthly | 11.0 (27.5) |
| Fremanezumab 675 mg every 3 months | 4.0 (10.0) |
| Galcanezumab 120 mg monthly | 13.0 (32.5) |
| Erenumab 140 mg monthly | 12.0 (30.0) |
[i] Data are presented as mean ± standard deviation (* median and IQR) or number and percentage. N – number; CGRP mAB – monoclonal antibodies targeting calcitonin gene-related peptide; mg – milligrams; MIDAS – Migraine Disability Assessment Test; T0 – prior to initiation of anti-CGRP mAb therapy; T1 – after 3 months of completed anti-CGRP mAb therapy
Tab. 2.
Characteristics of the population evaluated with TCCD
| Cases (N = 40) | Controls (N = 40) | P value | |
|---|---|---|---|
| Age (years) | 52.0 (±10.9) | 50.0 (±7.5) | 0.268 |
| Female (n) | 31.0 (77.5) | 30.0 (75.0) | 0.541 |
| Essential hypertension (n) | 8.0 (20.0) | 4.0 (10.0) | 0.210 |
| Dyslipidemia (n) | 1.0 (2.5) | 2.0 (5.0) | 0.556 |
| Anxious-depressive disorder (n) | 12.0 (30.0) | 10.0 (25.0) | 0.616 |
| Hyperthyroidism (n) | 4.0 (10.0) | 1.0 (2.5) | 0.165 |
| Hypothyroidism (n) | 11.0 (27.5) | 8.0 (20.0) | 0.430 |
| Fibromyalgia (n) | 3.0 (7.5) | 0 | 0.074 |
| Smoking habit (n) | 5.0 (12.5) | 6.0 (15.0) | 0.745 |
Tab. 3.
Results of TCCD examination
| Cases (N = 38) | Controls (N = 40) | P value | |
|---|---|---|---|
| PSV of MCA at rest (cm/s) | 99.0 (28.1) | 97.3 (23.2) | 0.771 |
| EDV of MCA at rest (cm/s) | 50.7 (16.6) | 43.7 (10.9) | 0.029 |
| MFV of MCA at rest (cm/s) | 65.1 (22.3) | 61.6 (14.2) | 0.182 |
| PI of MCA at rest | 0.7 (0.2) | 0.9 (0.2) | 0.002 |
| PSV of MCA post-apnea (cm/s) | 125.4 (33.4) | 120.9 (27.3) | 0.510 |
| EDV of MCA post-apnea (cm/s) | 67.5 (19.6) | 63.5 (16.3) | 0.333 |
| MFV of MCA post-apnea (cm/s) | 84.6 (26.9) | 82.6 (19.1) | 0.391 |
| PI of MCA post-apnea | 0.7 (0.2) | 0.7 (0.2) | 0.422 |
| BHI of MCA* (%/s) | 1.3 (0.9–1.7) | 1.1 (0.9–1.4) | 0.136 |
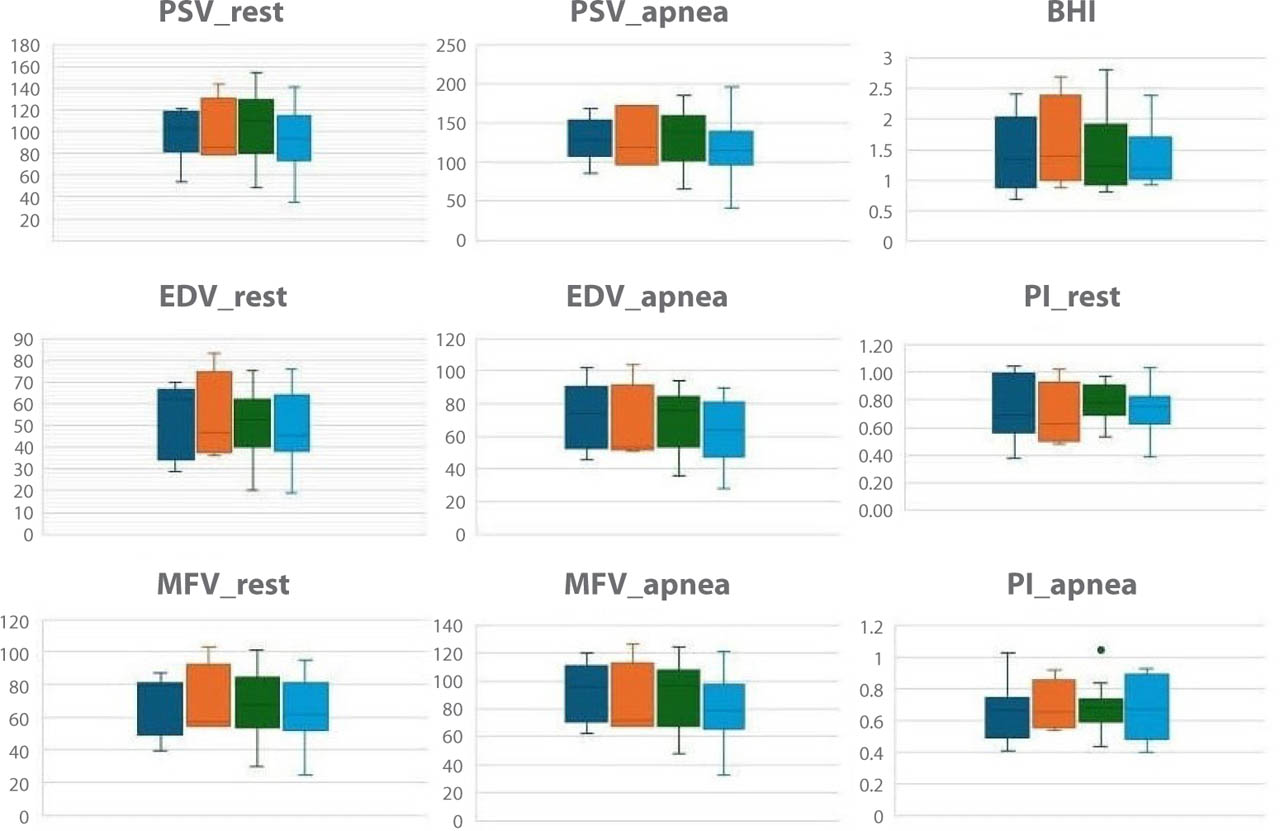
Fig. 1.
Subanalysis of cerebral hemodynamic parameters in patients treated with different types and dosages of anti-CGRP monoclonal antibodies at rest and after apnea. Dark blue – Fremanezumab 225 mg monthly; Orange – Fremanezumab 675 mg every three months; Green – Galcanezumab 120 mg monthly; Light blue – Erenumab 140 mg monthly. PSV – peak systolic velocity (cm/s); EDV – end-diastolic velocity (cm/s); MFV – mean flow velocity (cm/s); BHI – breath-holding index (%/s); PI – pulsatility index
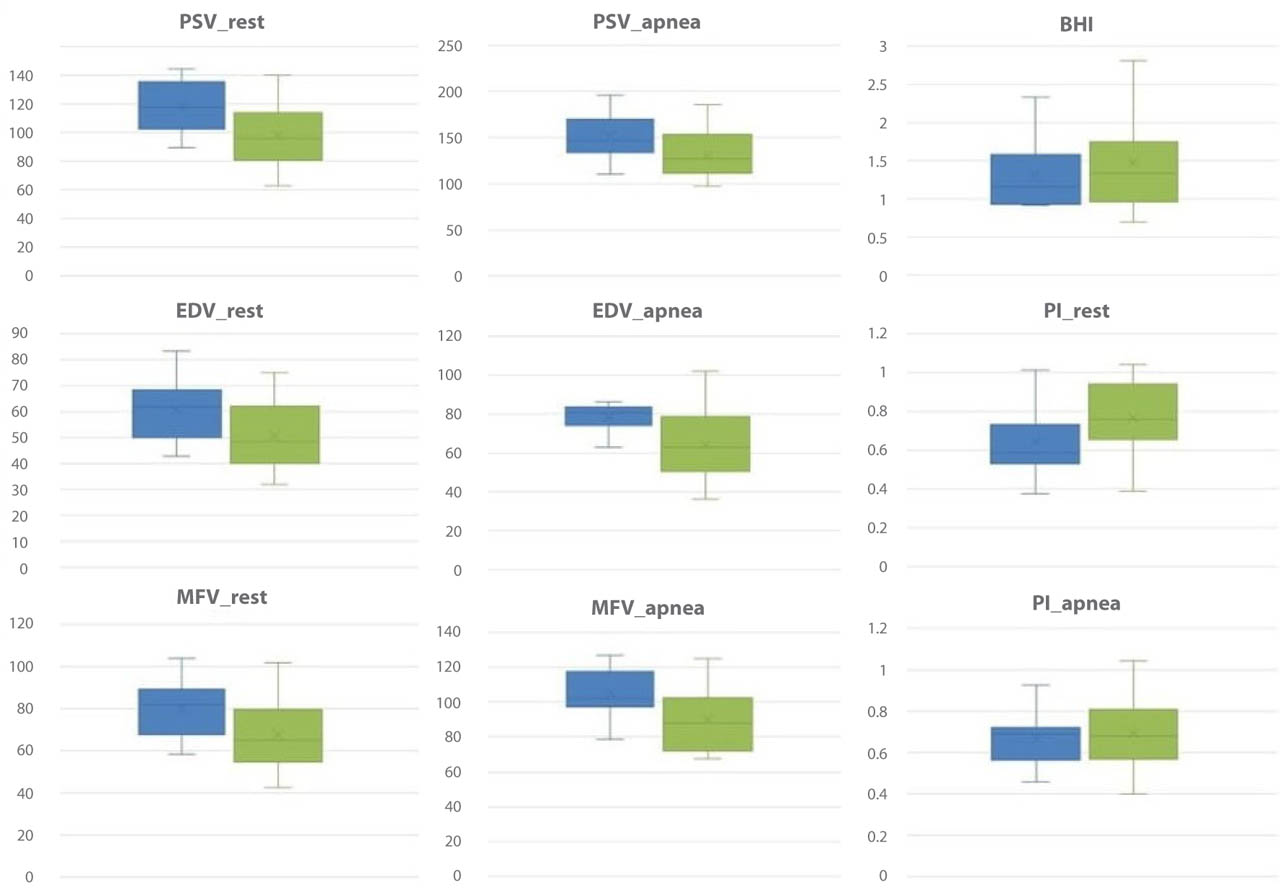
Fig. 2.
Comparison of TCCD-derived cerebrovascular parameters between responders and non-responders to anti-CGRP mAbs. Blue – responders; Green – nonresponders; PSV – peak systolic velocity (cm/s); EDV – end-diastolic velocity (cm/s); MFV – mean flow velocity (cm/s); BHI – breath-holding index (%/s); PI – pulsatility index