
Tab. 1.
Methodology of sub-studies
| Sub-study | Participants (n) | Sex (F/M) | Age, median (range), years | Key protocol and comparison |
|---|---|---|---|---|
| Probe orientation | 35 pediatric volunteers | 14/21 | 12 (7–18) | Same kidney scanned longitudinally and then transversely; paired comparison of IQR/M ratios |
| Breathing impact | 20 pediatric volunteers | 10/10 | 13 (6–17) | Baseline measurements during quiet free breathing, then during a ~5-s mid-expiratory breath-hold; paired comparison of median stiffness and IQR/M |
| Hydration | 12 young adults | 8/4 | 29 (24–30) | Baseline after 4-h fluid restriction and micturition, then SWE repeated at 20 and 40 min after 700 mL water intake; concurrent bladder-volume tracking – baseline 20 min before water intake, repeated at the moment of intake and 20 and 40 min after intake to measure the increase in diuresis |
| Cortex vs. medulla | 29 pediatric volunteers | 10/19 | 13 (6–17) | Separate ROIs placed in the cortex and pyramids; ROI depth recorded; paired cortex-versus-medulla stiffness comparison, assessment of the impact of measurement depth |
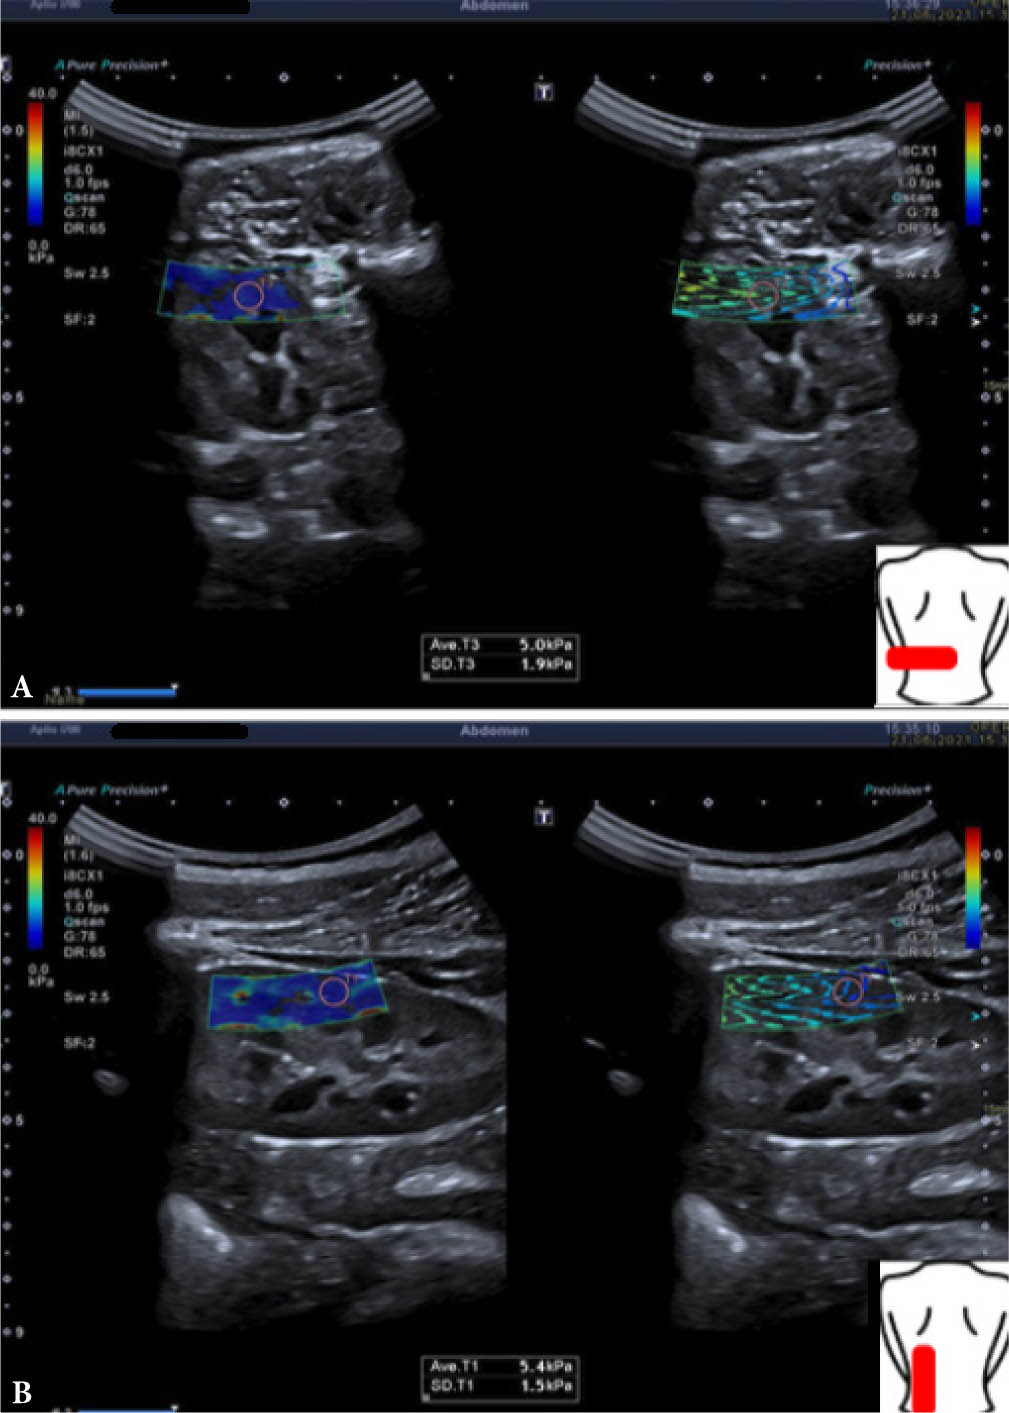
Fig. 1.
ROI placements in transverse (A) and longitudinal (B) planes of the kidney from the dorsal approach, measurements were taken in the cortex of the mid-portion of the kidney
Tab. 2.
Hydration sub-study (n = 12 adults): effect of drinking 700 mL water on renal SWE
| Kidney | Parameter | Baseline mean (±SD) of subject-level medians, kPa | +20 min, kPa | +40 min, kPa | Friedman χ2 (2 df) | p-value |
|---|---|---|---|---|---|---|
| Right | Stiffness (kPa) | 5.3 ± 0.7 | 6.7 ± 0.8 | 6.6 ± 0.9 | 8.27 | 0.016 |
| IQR/M ratio | 0.25 ± 0.05 | 0.23 ± 0.06 | 0.22 ± 0.05 | – | – | |
| Left | Stiffness (kPa) | 5.3 ± 0.6 | 6.4 ± 0.7 | 6.7 ± 0.8 | 13.15 | 0.0014 |
| IQR/M ratio | 0.24 ± 0.06 | 0.23 ± 0.05 | 0.23 ± 0.05 | – | – |
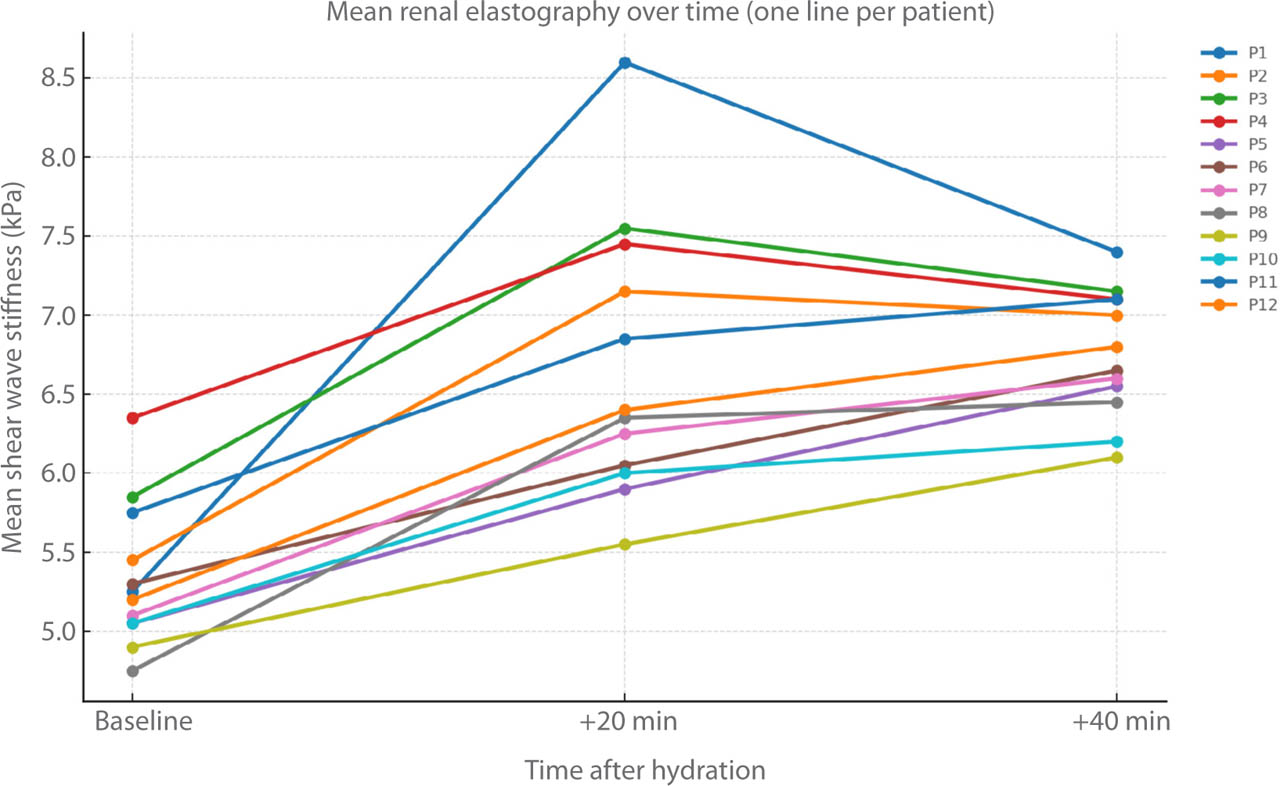
Fig. 2.
Average renal shear wave stiffness (kPa) before and after hydration in 12 adult volunteers. Each line represents the mean value of both kidneys for one participant. Measurements were taken at baseline, 20 minutes, and 40 minutes following oral fluid intake. The plot demonstrates a consistent post-hydration increase in renal cortex stiffness
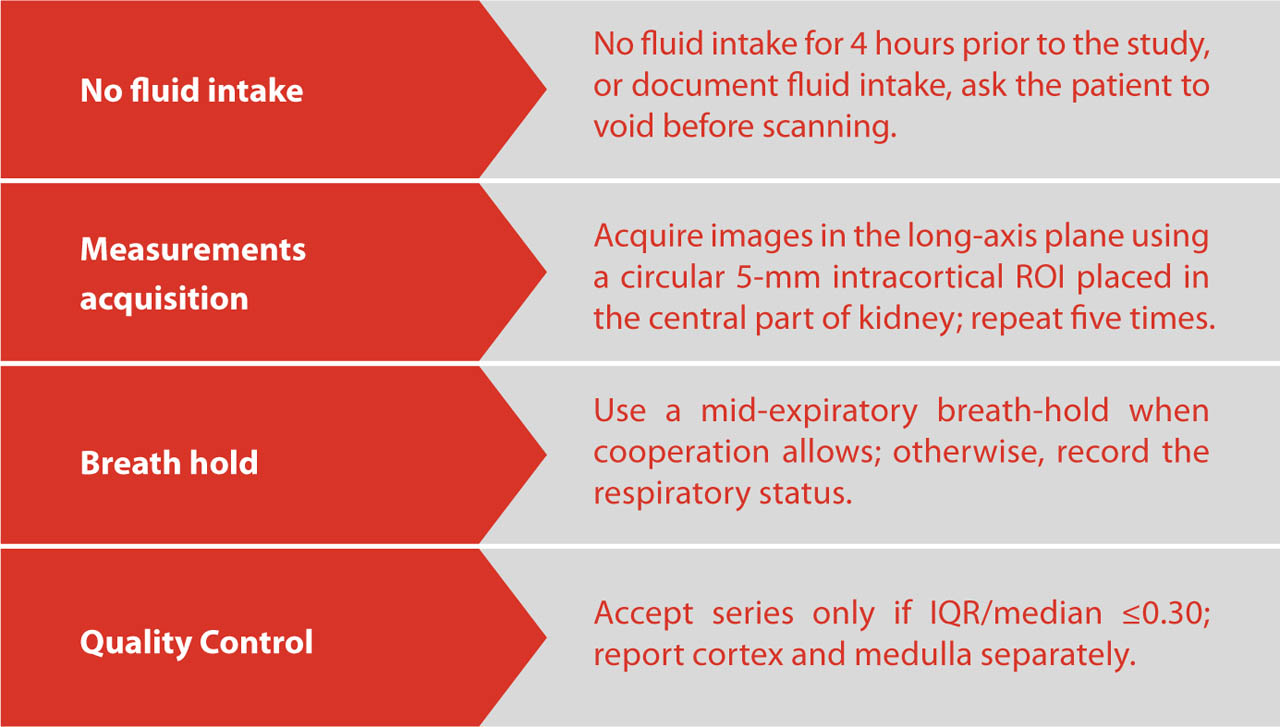
Fig. 3.
Suggested protocol for renal shear wave elastography