
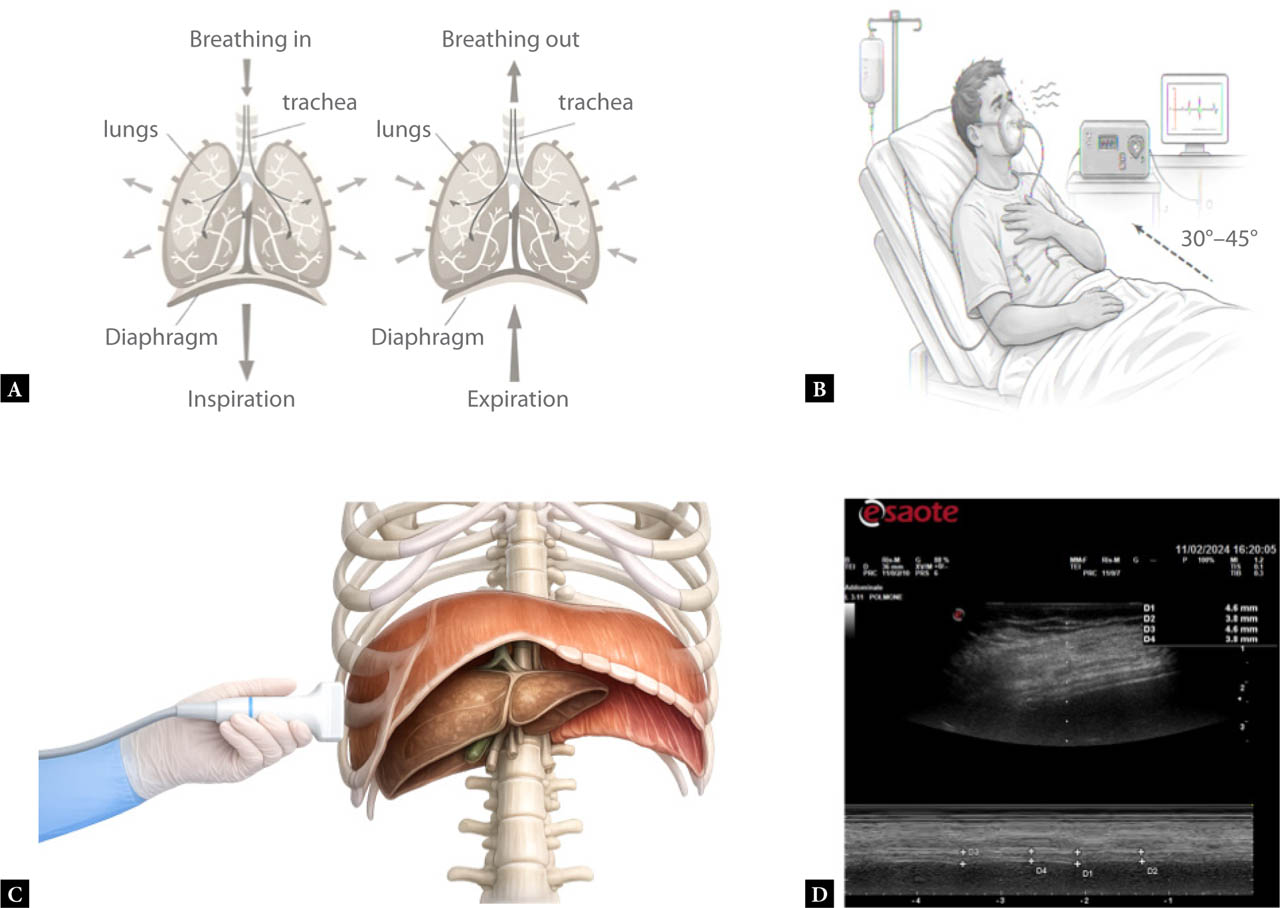
Fig. 1.
Ultrasound protocol for the assessment of diaphragm thickening fraction (DTF). A. Schematic representation of diaphragmatic motion during inspiration and expiration: during inspiration, the diaphragm thickens and moves caudally, whereas during expiration it becomes thinner and ascends. B. Patient positioning in a semi-recumbent posture (30–45°) for standardized diaphragm ultrasound acquisition. C. Probe placement using a high-frequency linear transducer (7–12 MHz) along the right mid-axillary line at the 8th–9th intercostal space to visualize the diaphragm within the zone of apposition. D. M-mode ultrasound image illustrating measurements of diaphragm thickness at end-inspiration (T_ins) and end-expiration (T_exp), averaged over three consecutive tidal breaths. These measurements were used to calculate the diaphragm thickening fraction according to the formula: DTF = ((T_ins– T_exp) / T_exp) × 100
Tab. 1.
Baseline characteristics and diaphragmatic ultrasound parameters by ventilation status
| Variable | Population (n = 56) | No ventilatory support (n = 34) | Ventilatory support (n = 22) | p-value |
|---|---|---|---|---|
| Sex (male), n (%) | 30 (54%) | 14 (41%) | 16 (73%) | 0.029 |
| Age (years), median (IQR) | 80 (75–87) | 78 (74–87) | 84 (75–88) | 0.351 |
| Charlson Comorbidity Index, median (IQR) | 6 (5–8) | 6 (5–8) | 6 (5–8) | 0.531 |
| Dyspnea, n (%) | 55 (98%) | 33 (97%) | 22 (100%) | 1.000 |
| Cough, n (%) | 15 (27%) | 9 (27%) | 6 (27%) | 1.000 |
| Fever, n (%) | 16 (29%) | 11 (32%) | 5 (23%) | 0.550 |
| End-inspiratory diaphragm thickness (mm), median (IQR) | 3.4 (2.7–5.0) | 3.40 (3.1–5.2) | 3.0 (2.4–4.5) | 0.052 |
| End-expiratory diaphragm thickness (mm), median (IQR) | 2.5 (2.0–3.4) | 2.6 (2.0–3.5) | 2.3 (1.9–3.3) | 0.430 |
| Diaphragmatic thickening fraction (DTF) (%), median (IQR) | 25.6 (17.5–35.2) | 29.8 (21.1–37.2) | 20.93 (10.6–26.8) | 0.006 |
| PaO2/FiO2 ratio (mmHg), median (IQR) | 258 (216–318) | 282 (244–350) | 216 (169–248) | 0.003 |
| Systolic blood pressure (mmHg), median (IQR) | 130 (115–150) | 132 (110–155) | 130 (120–145) | 0.904 |
| Diastolic blood pressure (mmHg), median (IQR) | 80 (65–90) | 80 (65–85) | 85 (64–90) | 0.283 |
| Heart rate (bpm), median (IQR) | 92 (79–110) | 95 (79–110) | 89 (82–104) | 0.610 |
| SpO2 (%), median (IQR) | 90 (85–94) | 91 (88–94) | 88 (84–94) | 0.289 |
| Respiratory rate (bpm), median (IQR) | 21 (18–32) | 20 (18–22) | 29 (22–35) | 0.024 |
| Body temperature (°C), median (IQR) | 36.5 (36.0–37.3) | 36.7 (36.0–37.6) | 36.1 (36.0–37.0) | 0.164 |
| Oxygenation in the ED | 50 (89%) | 30 (88%) | 20 (91%) | 1.000 |
| Oxygenation (hospital) | 44 (79%) | 25 (74%) | 19 (86%) | 0.329 |
| LOS (days), median (IQR) | 12 (7–17) | 10 (5–14) | 14 (8–21) | 0.050 |
| Death, n (%) | 7 (13%) | 4 (12%) | 3 (14%) | 1.000 |
[i] Values are reported as median (IQR) or n (%). P-values refer to between-group comparisons (no ventilatory support vs ventilatory support (NIV/IMV)). ED – emergency department; IMV – invasive mechanical ventilation; IQR – interquartile range; LOS – length of stay; NIV – non-invasive ventilation; SpO2, peripheral oxygen saturation; PaO2/FiO2 – arterial oxygen partial pressure to inspired oxygen fraction ratio
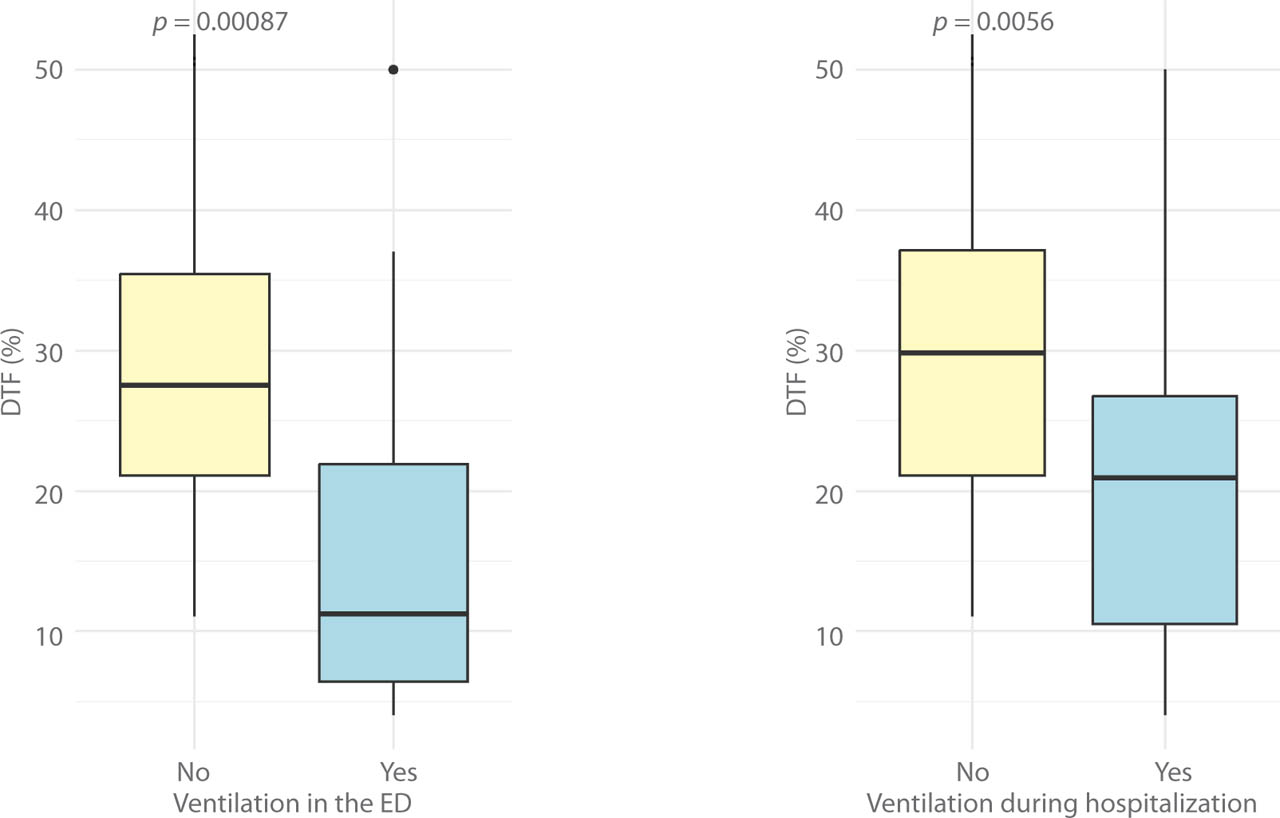
Fig. 2.
Comparison of diaphragm thickening fraction (DTF) by ventilatory support status. Yellow box: No ventilatory support; Blue box: Ventilatory support (noninvasive ventilation or invasive mechanical ventilation); Left panel: Comparison of DTF in the emergency department (ED) based on ventilation status (p = 0.00087); Right panel: Comparison of DTF during hospitalization based on ventilation status (p = 0.0056)
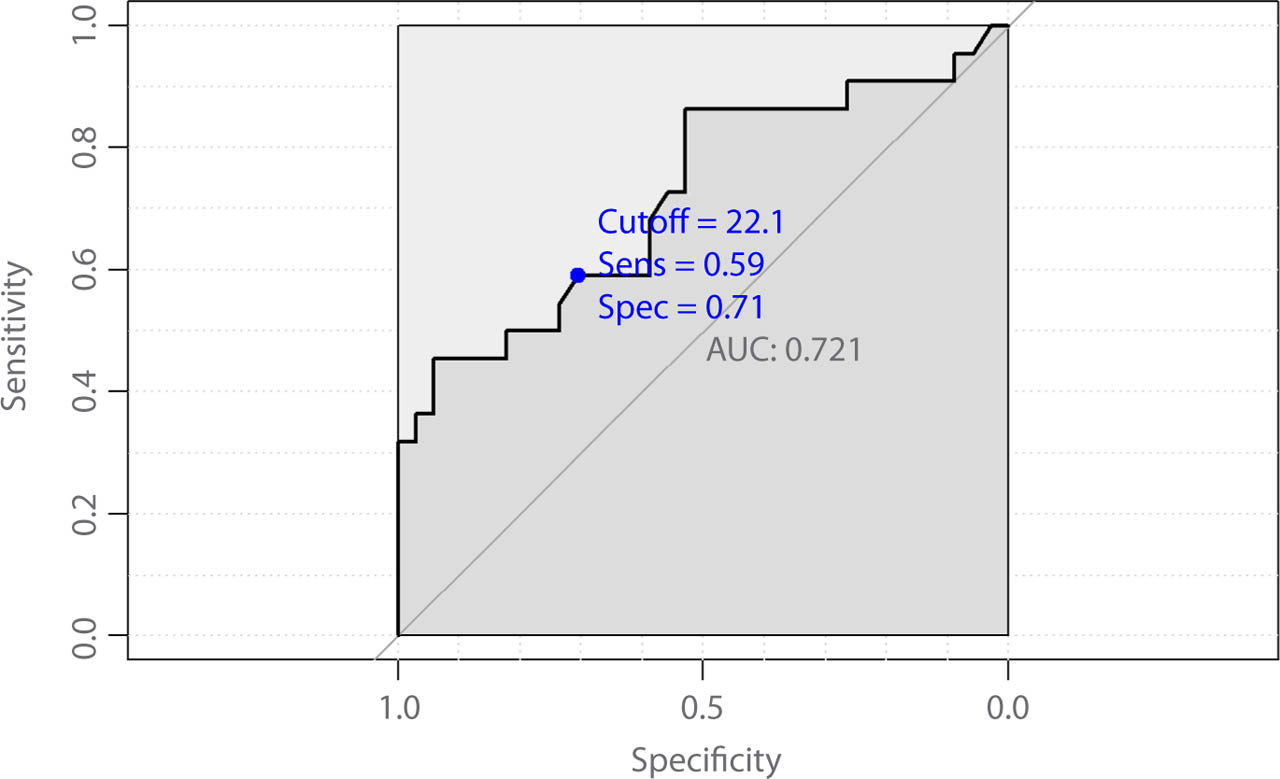
Fig. 3.
Receiver operating characteristic curve for diaphragm thickening fraction (DTF) in predicting the need for ventilatory support (non-invasive ventilation or invasive mechanical ventilation) from emergency department presentation through hospitalization. The area under the curve (AUC) was 0.72 (95% CI 0.58–0.87). The optimal DTF cutoff identified using the Youden index was 22.1%, corresponding to a sensitivity of 0.59 and a specificity of 0.71 (blue point). The diagonal reference line represents no discriminative ability