Fig. 1.

Fig. 2.
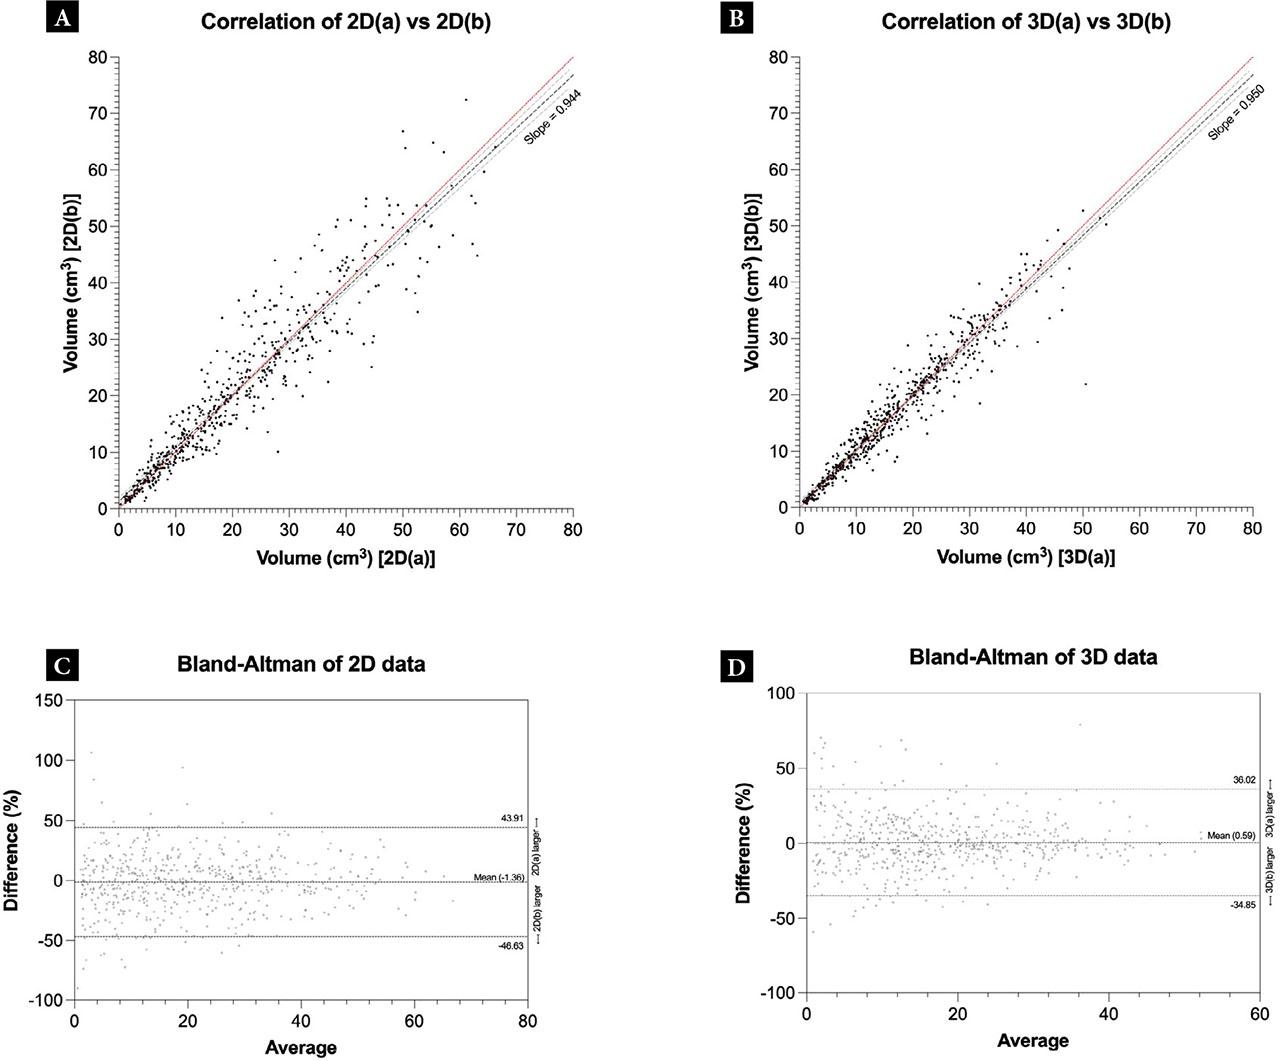
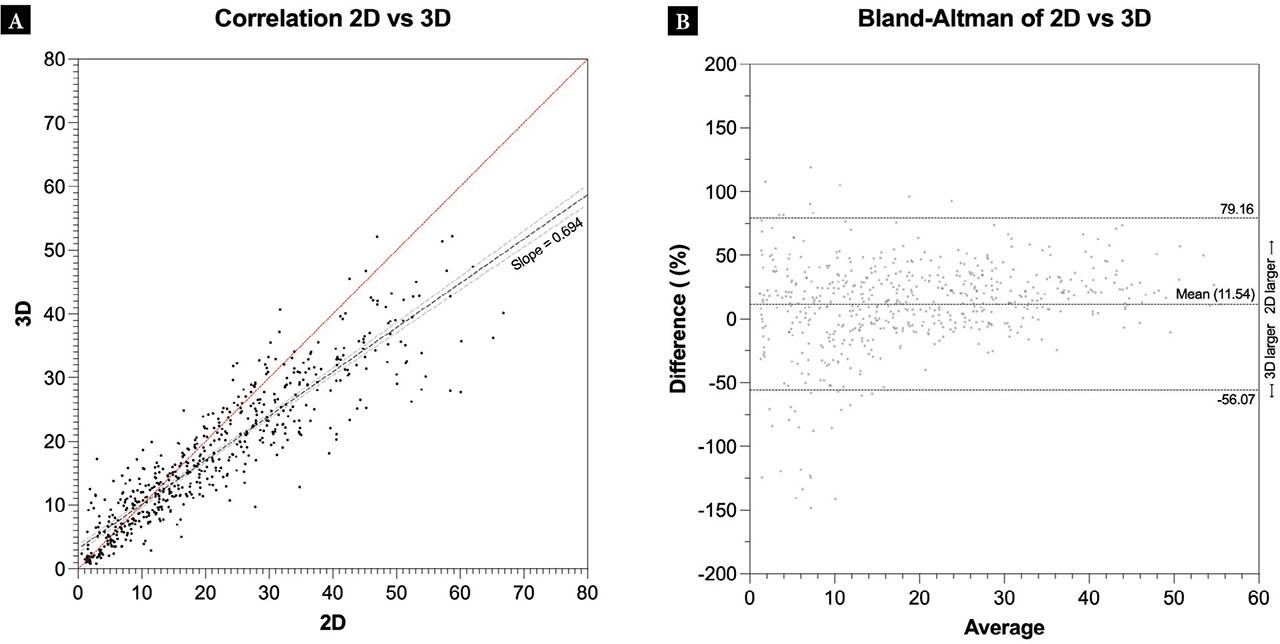
Fig. 3.
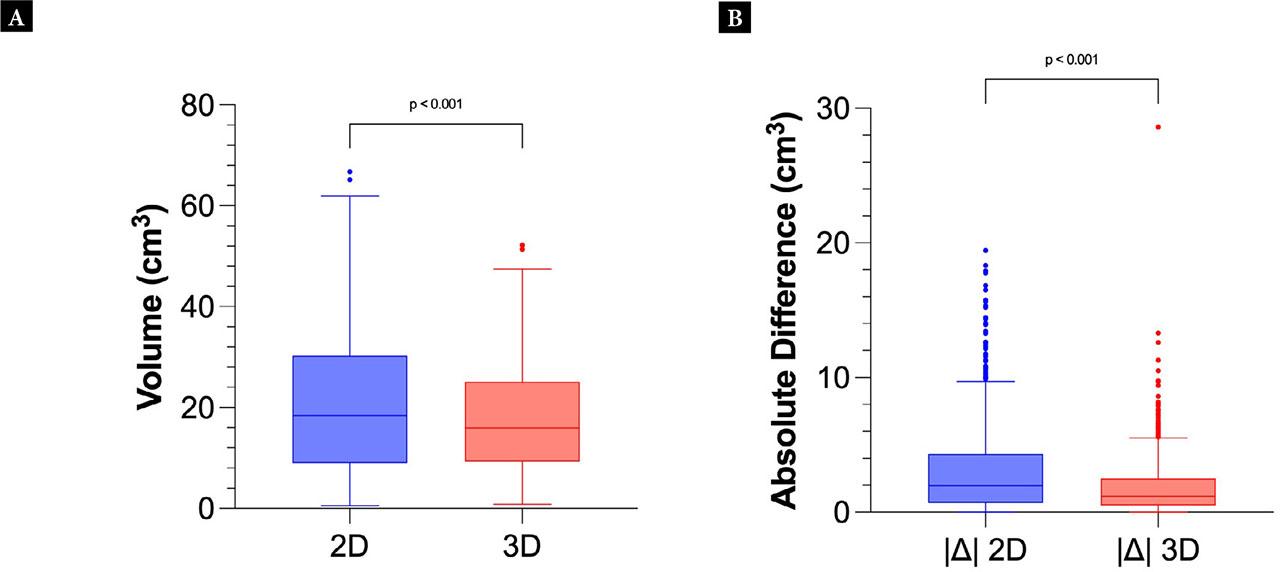
Fig. 4.
Clinical characteristics of the included subjects
| Variables | Values | Range (Min–Max) |
|---|---|---|
| N | 62 | N/A |
| Sex, males (%) | 31 (50.0) | N/A |
| Age, mean (SD) in years | 69.1 (6.6) | 52.0–84.0 |
| BMI, median (IQR) in kg/m2 | 24.3 (22.9–28.6) | 18.5–33.3 |
| Smoking status, % present / past / never | 6.5/33.9/59.7 | N/A |