
Fig. 1.
Fig. 2.
Fig. 3.
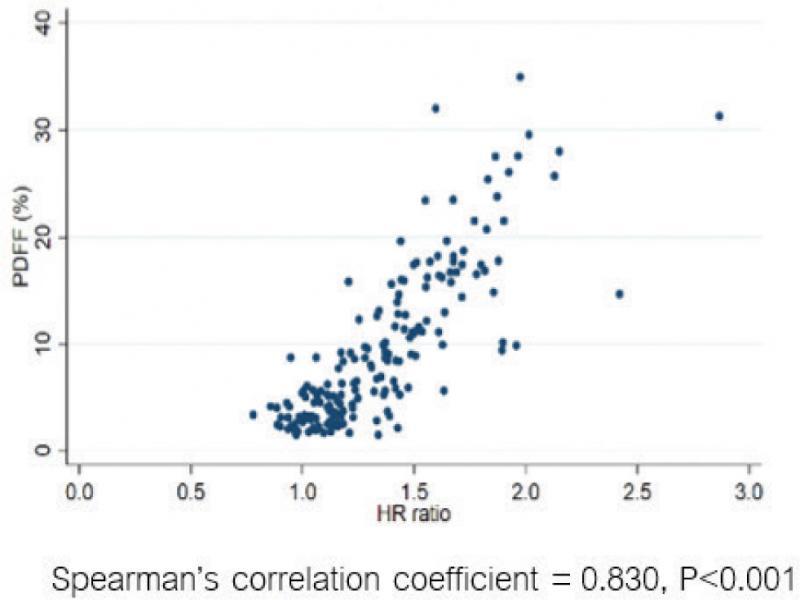
Fig. 4.
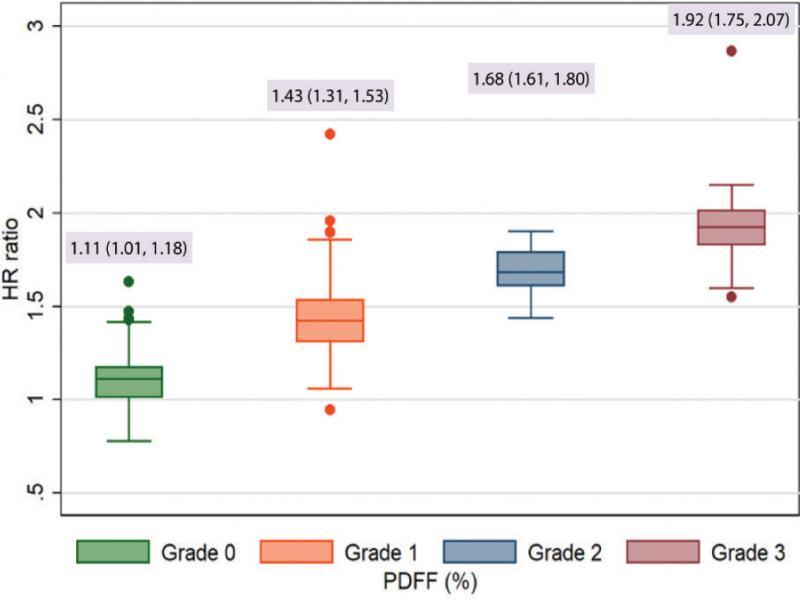
Fig. 5.
Fig. 6.
Correlation between hepatorenal ratio and MRI-PDFF by liver stiffness (n = 179)
| Liver stiffness by MRE (kPa) | N | Spearman’s correlation coefficient | p-value |
|---|---|---|---|
| <2.5 | 87 | 0.874 | <0.001 |
| 2.5–2.8 | 18 | 0.849 | <0.001 |
| 2.9–3.4 | 26 | 0.832 | <0.001 |
| ≥3.5–5 | 48 | 0.591 | <0.001 |
Demographic data of the 179 patients in the study sample
| Characteristics | Non-steatosis group (N = 75) | Steatosis group (N = 104) | p-value |
|---|---|---|---|
| Age (y), median (IQR) | 58 (49–64) | 51 (41–60) | 0.007 |
| BMI (kg/m2), mean (SD) | 23.7 (3.5) | 26.9 (3.4) | <0.001 |
| TC, mean (SD) | 189.9 (41.0) | 201.8 (40.6) | 0.111 |
| TG, median (IQR) | 117 (82–141) | 137 (97–187) | 0.033 |
| LDL (mg/dL), mean (SD) | 113.7 (38.4) | 121.2 (38.5) | 0.11 |
| Albumin, median (IQR) | 4.1 (3.8–4.3) | 4.2 (4.0–4.4) | 0.059 |
| TB, median (IQR) | 0.78 (0.56–1.30) | 0.73 (0.57–0.94) | 0.884 |
| SGPT, median (IQR) | 32.5 (19–55) | 45 (29–64) | 0.033 |
| ALP, median (IQR) | 79.0 (61–101) | 77 (61–88) | 0.557 |
| HR ratio, median (IQR) | 1.11 (1.01–1.18) | 1.49 (1.34–1.68) | <0.001 |