
Fig. 1.

Fig. 2.
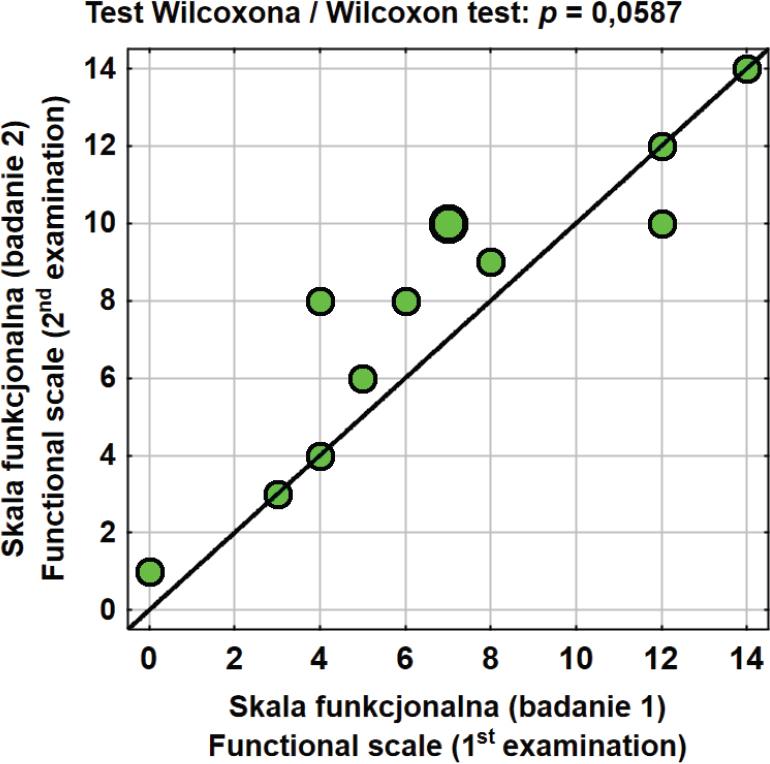
Fig. 3.

Fig. 4.

Age and time from stroke onset in the examined group
| Analizowane zmienne / Analysed variables | Średnia / Mean | Mediana / Median | Minimum / Minimum | Maksimum / Maximum | Odch. Std. / Standard Deviation |
|---|---|---|---|---|---|
| Wiek [lat] / Age [years] | 65,3 | 64,5 | 29 | 84 | 14 |
| Czas od udaru [m-c] / Time from stroke onset [months] | 55 | 59,5 | 12 | 81 | 22 |
The level of hand spasticity according to Ashworth Scale and adopted scoring
| Liczba porządkowa badanych / Patient number | I badanie / 1st examination | II badanie / 2nd examination | ||
|---|---|---|---|---|
| Skala Ashworth / Ashworth Scale | Przyjęta punktacja / Adopted scoring | Skala Ashworth / Ashworth Scale | Przyjęta punktacja / Adopted scoring | |
| 1 | 3 | 5 | 4 | 6 |
| 2 | 1 | 2 | 1 | 2 |
| 3 | 3 | 5 | 2 | 4 |
| 4 | 1+ | 3 | 1+ | 3 |
| 5 | 1+ | 3 | 1+ | 3 |
| 6 | 2 | 4 | 1+ | 3 |
| 7 | 1+ | 3 | 1+ | 3 |
| 8 | 2 | 4 | 2 | 4 |
| 9 | 2 | 4 | 1+ | 3 |
| 10 | 2 | 4 | 2 | 4 |
| 11 | 1 | 2 | 1 | 2 |
| 12 | 2 | 4 | 1+ | 3 |
Ashworth Scale distribution of results in the first and second examination
| Poziom spastyczności / Level of spasticity | Skala Ashworth / Ashworth Scale | |||
|---|---|---|---|---|
| Badanie 1 / 1st examination | Badanie 2 / 2nd examination | |||
| N | % | N | % | |
| 1 | 0 | 0% | 0 | 0% |
| 2 | 2 | 17% | 2 | 17% |
| 3 | 3 | 25% | 6 | 50% |
| 4 | 5 | 42% | 3 | 25% |
| 5 | 2 | 17% | 0 | 0% |
| 6 | 0 | 0% | 1 | 8% |
| 3,58 | 3,33 | |||
Values of descriptive statistics for the measurement of paretic palm area
| Powierzchnia ręki niedowładnej [mm] / Palm area of a paretic limb [mm] | N | Me | s | min | max | |
|---|---|---|---|---|---|---|
| Badanie 1 / 1st examination | 11 | 12 023 | 11 932 | 1 960 | 8 470 | 15 046 |
| Badanie 2 / 2nd examination | 11 | 11 757 | 11 931 | 1 737 | 8 541 | 13 806 |
| Badanie 1 vs. Badanie 2/1st examination vs. 2nd examination (p = 0,7221) | 11 | -266 | 14 | 834 | -2138 | 1 110 |
| p – wartość prawdopodobieństwa testowego obliczona za pomocą testu Wilcoxona / probability value calculated with Wilcoxon test | ||||||
Changes in the values of p max/p min against Fugl-Meyer Assessment and Ashworth Scale
| Liczba porządkowa badanych/Patient number | Zmiana stanu ręki pomiędzy badaniem 1 a 2 / Changes in hand function between the 1st and 2nd examination | ||
|---|---|---|---|
| Skala Ashworth / Ashworth Scale | Skala Fugl-Meyer / Fugl-Meyer Assessment | Wskaźnik / Value p max/p min | |
| 1 | (3/4) nasilenie spastyczności / increased spasticity | 0/1 poprawa / improvement | 19,69/2,36 pogorszenie / deterioration |
| 2 | (1/1) brak zmian / no changes | 14/14 brak zmian / no changes | 19,45/72,43 poprawa / improvement |
| 3 | (3/2) obniżenie spastyczności / decreased spasticity | 3/3 brak zmian / no changes | 1,5/1,39 pogorszenie / deterioration |
| 4 | (1+/1+) brak zmian / no changes | 4/4 brak zmian / no changes | 20,7/23,14 poprawa / improvement |
| 5 | (1+/1+) brak zmian / no changes | 5/6 poprawa / improvement | 8,65/11,38 poprawa / improvement |
| 6 | (2/1+) obniżenie spastyczności / decreased spasticity | 4/8 poprawa / improvement | 8,48/36,46 poprawa / improvement |
| 7 | (1+/1+) brak zmian / no changes | 7/10 poprawa / improvement | 17,38/3,36 pogorszenie / deterioration |
| 8 | (2/2) brak zmian / no changes | 12/10 pogorszenie / deterioration | 20,25/38,6 poprawa / improvement |
| 9 | (2/1+) obniżenie spastyczności / decreased spasticity | 8/9 poprawa / improvement | 4,04/5,44 poprawa / improvement |
| 10 | (2/2) brak zmian / no changes | 6/8 poprawa / improvement | 17,4/18,37 poprawa / improvement |
| 11 | (1/1) brak zmian / no changes | 12/12 brak zmian / no changes | 24,13/15,71 pogorszenie / deterioration |
| 12 | (2/1+) obniżenie spastyczności / decreased spasticity | 7/10 poprawa / improvement | 3,84/6,42 poprawa / improvement |
Values of descriptive statistics for p max / p min
| p max/p min | N | Me | s | min | max | |
|---|---|---|---|---|---|---|
| Badanie 1 / 1st examination | 12 | 13,8 | 17,4 | 7,9 | 1,5 | 24,1 |
| Badanie 2 / 2nd examination | 12 | 19,6 | 13,5 | 20,9 | 1,4 | 72,4 |
| Badanie 1 vs. Badanie 2/1st examination vs. 2nd examination (p = 0,2721) | 12 | 5,8 | 1,9 | 19,3 | -17,3 | 53,0 |
| p -probability value calculated with Wilcoxon test | ||||||
The values of descriptive statistics for the results of Fugl-Meyer Assessment (FMA)
| Skala funkcjonalna / Functional scale | N | Me | s | min | max | |
|---|---|---|---|---|---|---|
| Badanie 1 / 1st examination | 12 | 6,8 | 6,5 | 4,1 | 0 | 14 |
| Badanie 2 / 2nd examination | 12 | 7,9 | 8,5 | 3,8 | 1 | 14 |
| Badanie 1 vs. Badanie 2 /1st examination vs. 2nd examination (p = 0,0587) | 12 | 1,1 | 1,0 | 1,7 | -2 | 4 |
| p – wartość prawdopodobieństwa testowego obliczona za pomocą testu Wilcoxona / probability value calculated with Wilcoxon test | ||||||
Characteristics of the participants
| Zmienna / Variable | Liczność / No. of patients | Procent / Percent |
|---|---|---|
| Płeć / Sex | ||
| Kobieta / Female | 6 | 50 |
| Mężczyzna / Male | 6 | 50 |
| Strona porażona / Paretic side | ||
| Prawa / Right | 6 | 50 |
| Lewa / Left | 6 | 50 |
| Lateralizacja / Lateralisation | ||
| Prawostronna / Right-sided | 12 | 100 |
| Lewostronna / Left-sided | 0 | 0 |
| Wdrożona terapia / Implemented therapy | ||
| Fizykoterapia / Physiotherapy | 5 | 42 |
| Masaż / Massage | 7 | 58 |
| Kinezyterapia indywidualna / Individual kinesiotherapy | 10 | 83 |
| Kinezyterapia zespołowa / Group kinesiotherapy | 8 | 67 |
| Odruchy ścięgniste / Tendon reflexes | ||
| Prawidłowe / Proper | 7 | 58 |
| Wzmożone / Increased | 3 | 25 |
| Zniesione / Absent | 2 | 17 |
| Klonusy / Clonuses | ||
| Obecne / Present | 1 | 8 |
| Nieobecne / Absent | 11 | 92 |
| Skala Brunnstrom (bad. 1) / Brunnström Approach (1st examination) | ||
| 2 | 8 | 67 |
| 3 | 4 | 33 |
| Skala Ashwortha (bad. 1) / Ashworth Scale (1st examination) | ||
| 1 | 2 | 17 |
| +1 | 3 | 25 |
| 2 | 5 | 41 |
| 3 | 2 | 17 |