
Figure 1
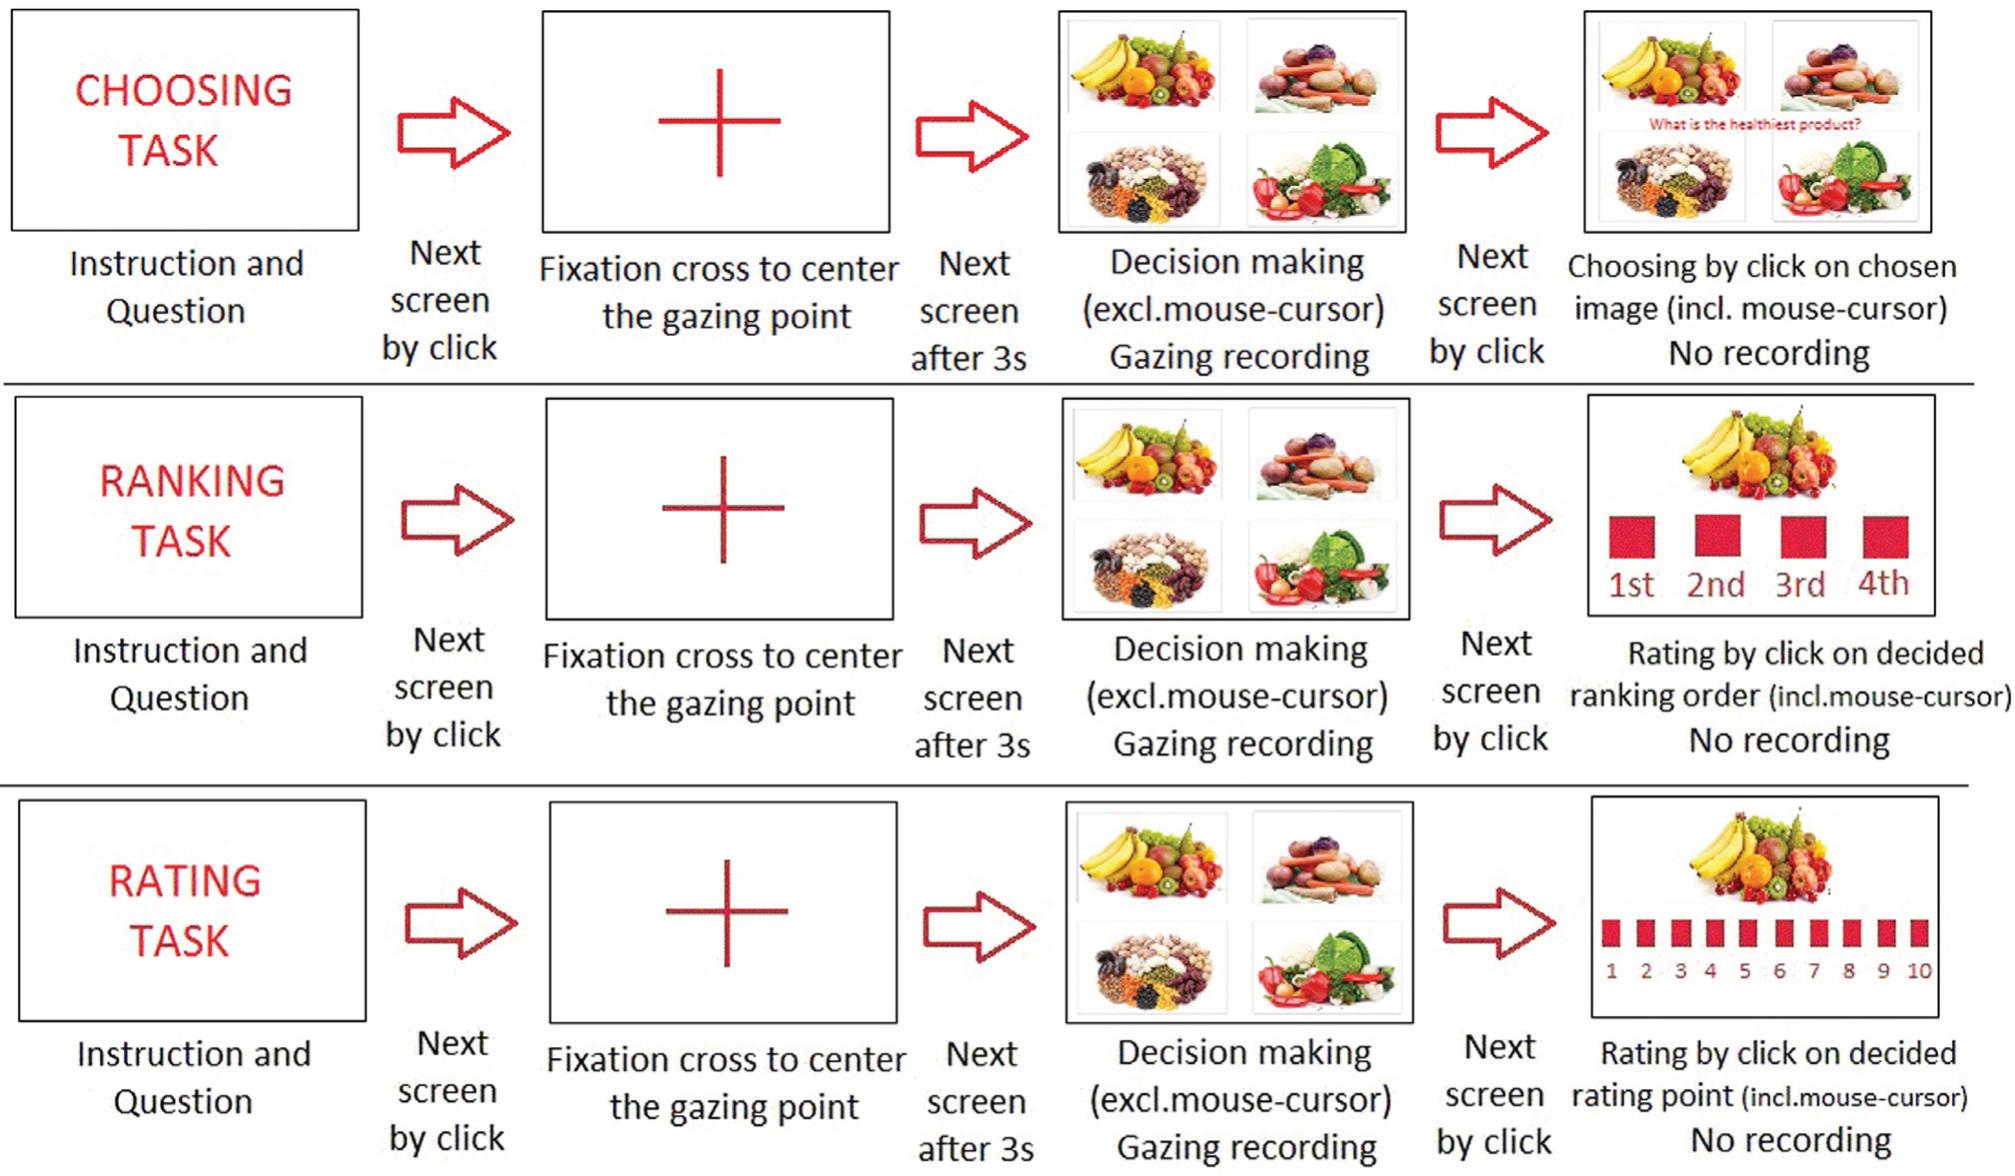
Figure 2a, b, c, d
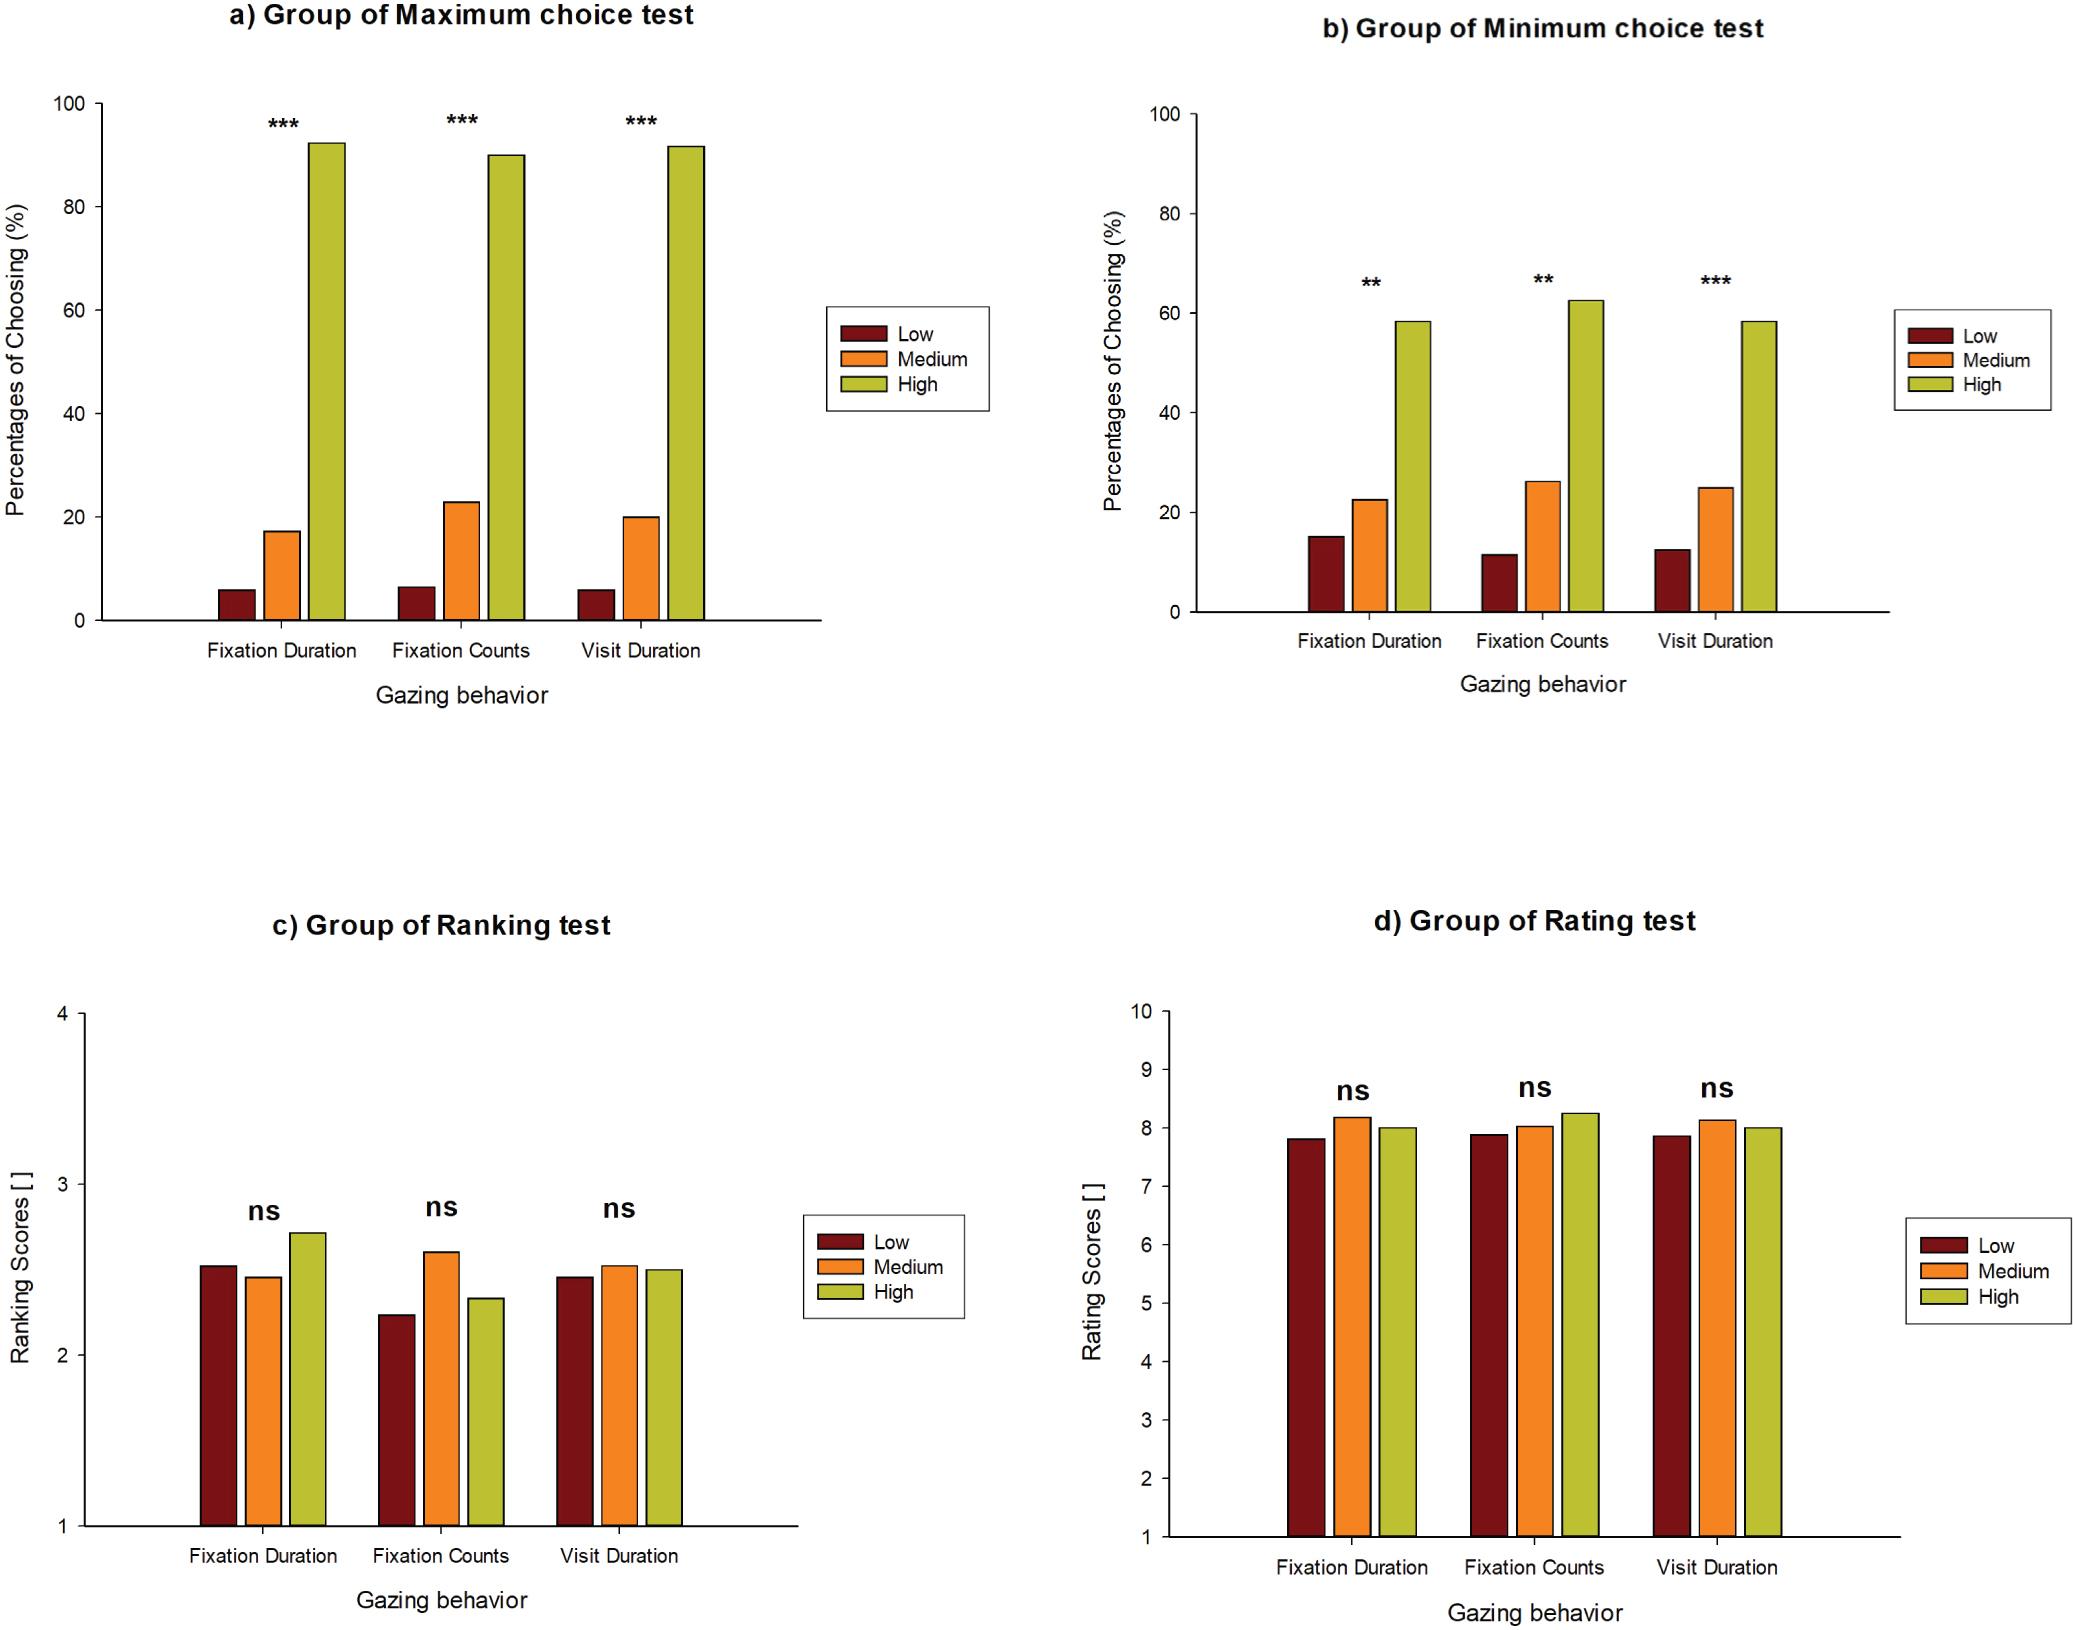
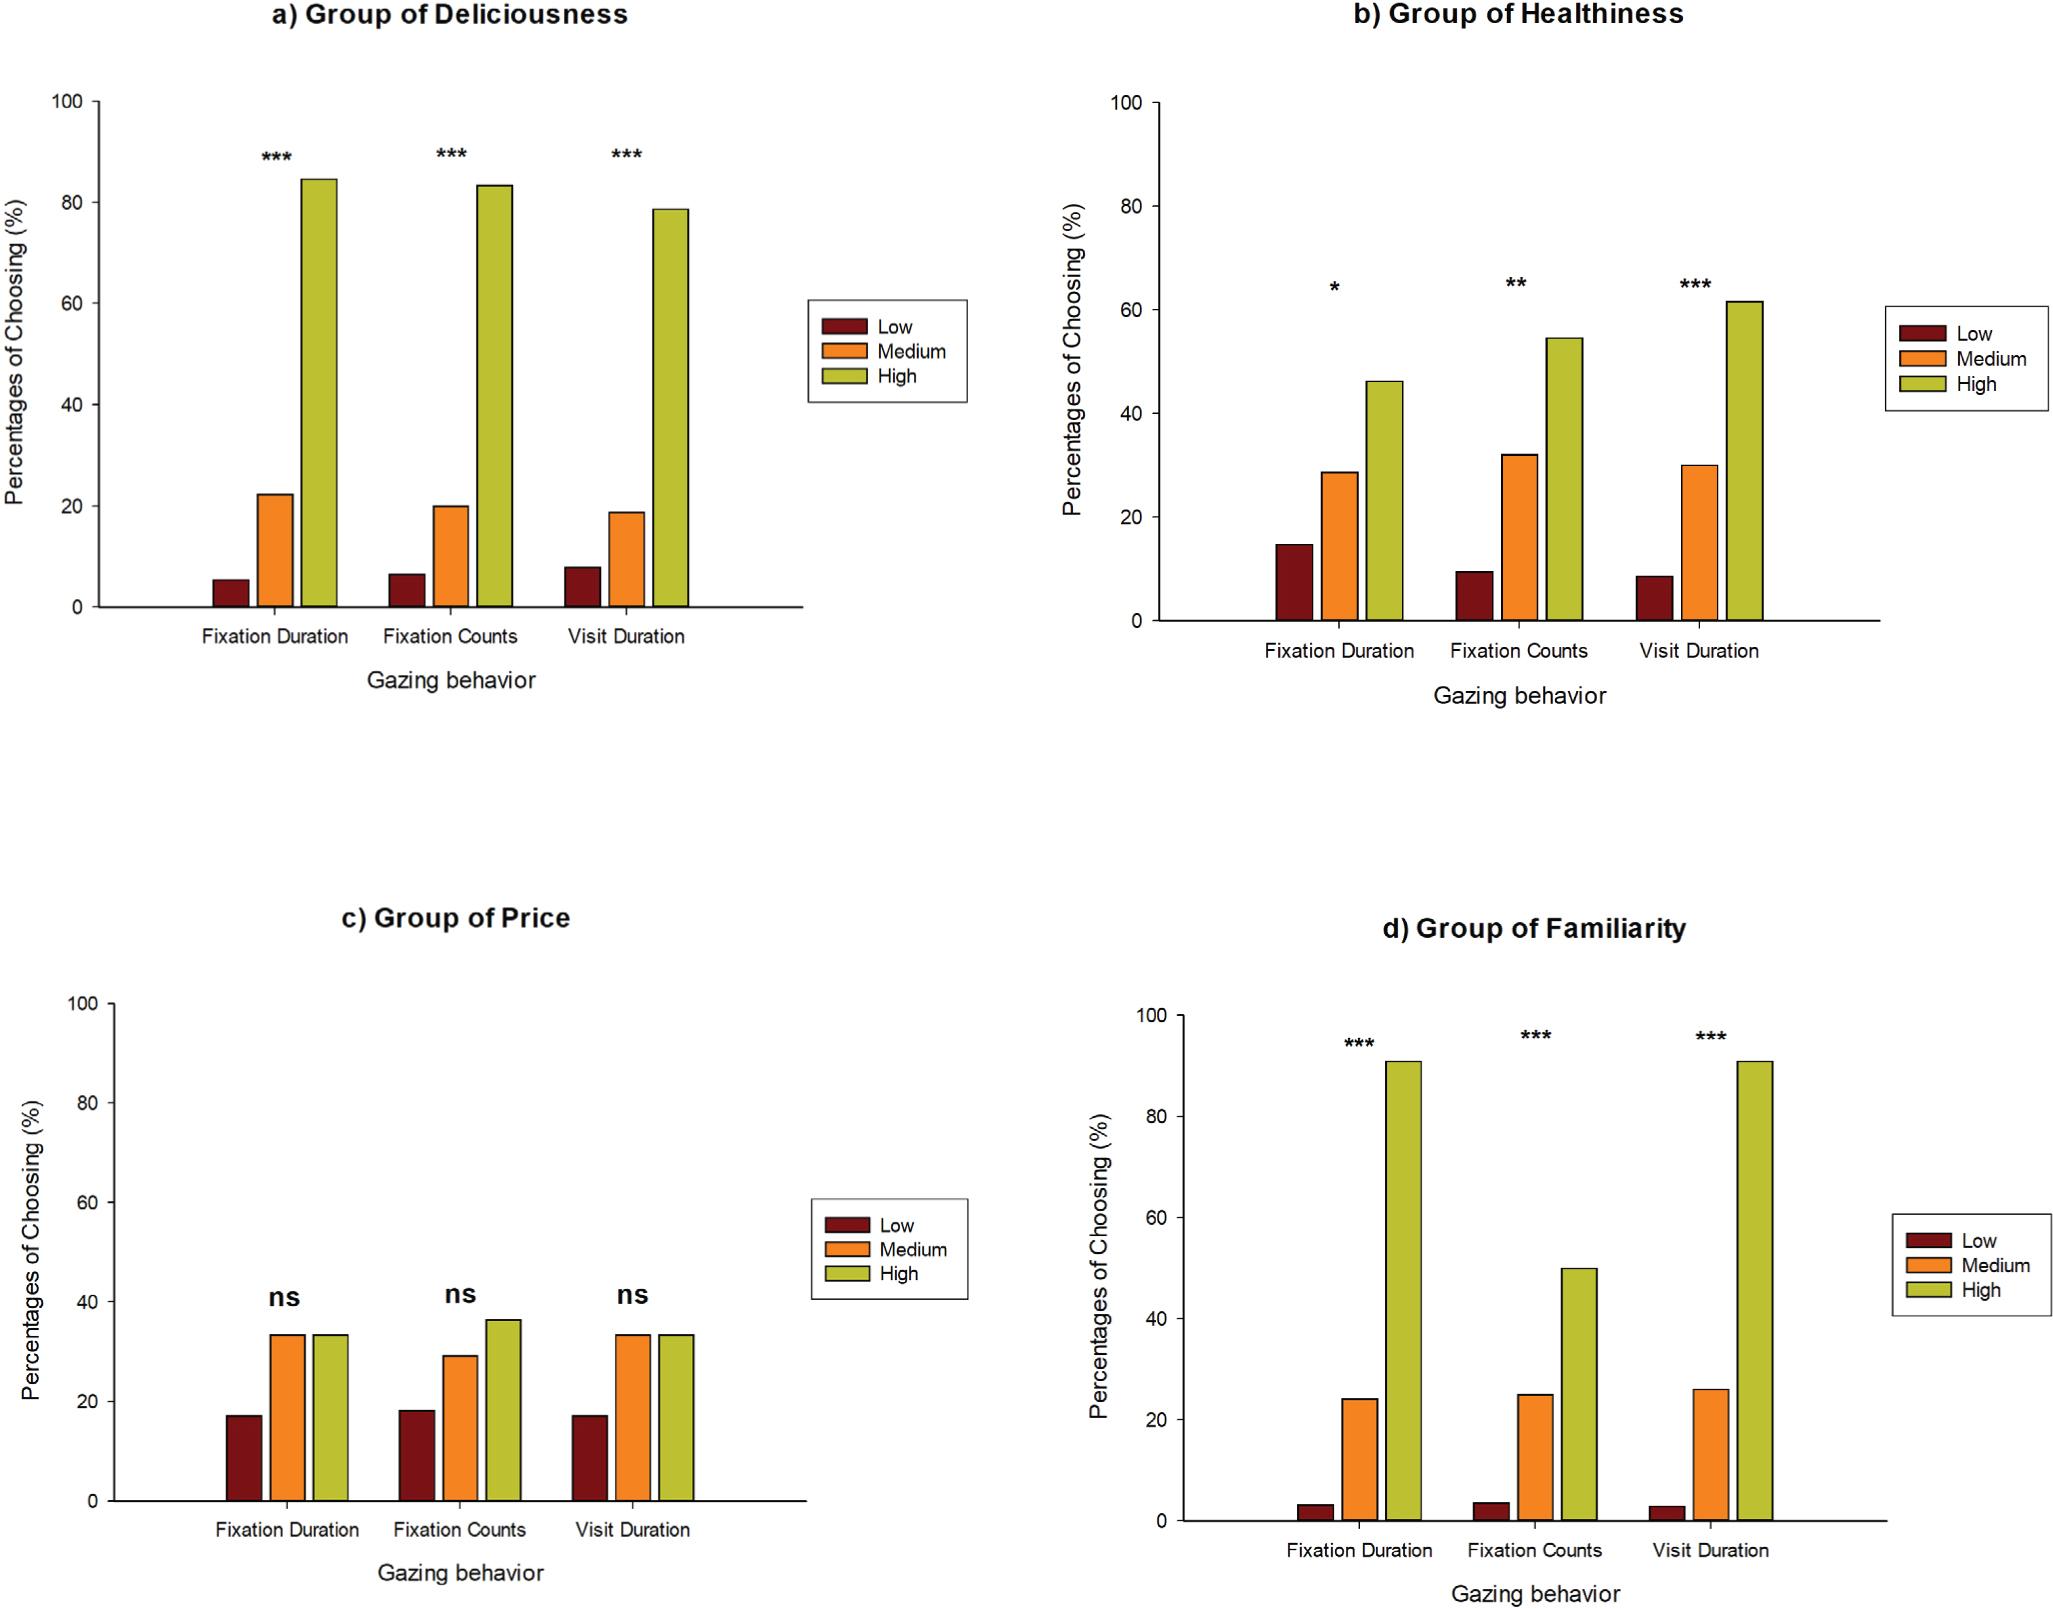
Figure 3
F- and p-values from the ANOVA performed for the effect of AOIs (food images)Tabelle 3_ F- und p-Werte der ANOVA bzgl_ Wirkung von AOIs (Bilder der Speisen)
| Tested factors | Fixation duration | Fixation count | Visit duration | |||
|---|---|---|---|---|---|---|
| F-value | p-value | F-value | p-value | F-value | p-value | |
| Type of evaluation | 1.118 | 0.380 indicates no significant effect at p>0.1 | 0.710 | 0.565 indicates no significant effect at p>0.1 | 0.764 | 0.536 indicates no significant effect at p>0.1 |
| Question content | 2.427 | 0.116 indicates no significant effect at p>0.1 | 1.117 | 0.381 indicates no significant effect at p>0.1 | 1.911 | 0.182 indicates no significant effect at p>0.1 |
p-values of the chi-squared (χ2) test of independence between gazing behaviour and consumer’s choicesTabelle 5_ p-Werte des Chi-Quadrat-Test (χ2) auf Unabhangigkeit bzgl_ Blickverhalten und Auswahl durch die KonsumentInnen
| Gazing parameters | Group of Deliciousness | Group of Healthiness | Group of Price | Group of Familiarity |
|---|---|---|---|---|
| Fixation Duration | 9.726E-08 | 7.551E-02 | 0.3050 indicates no significant effect at p>0.1 | 4.895E-08 |
| Fixation Counts | 9.193E-07 | 6.939E-03 | 0.4070 indicates no significant effect at p>0.1 | 1.613E-03 |
| Visit Duration | 9.701E-07 | 6.888E-04 | 0.3050 indicates no significant effect at p>0.1 | 3.523E-08 |
p-values of the one-way ANOVA between gazing behaviour and consumer’s ranking scores or consumer’ rating pointsTabelle 4_ p-Werte der Einfaktoriellen ANOVA bzgl_ Blickverhalten und Ranking bzw_ Bewertung durch die KonsumentInnen
| Gazing parameters | Group of Maximum choice p-values of the chi-square (χ2) test of independence between gazing behaviour and consumer’s choices | Group of Minimum choice p-values of the chi-square (χ2) test of independence between gazing behaviour and consumer’s choices | Group of Ranking p-values of the one-way ANOVA between gazing behaviour and consumer’s ranking scores or rating points. | Group of Rating p-values of the one-way ANOVA between gazing behaviour and consumer’s ranking scores or rating points. |
|---|---|---|---|---|
| Fixation Duration | 3.452E-09 | 0.0116 | 0.8499 indicates no significant effect at p>0.1 | 0.8499 indicates no significant effect at p>0.1 |
| Fixation Counts | 7.131E-07 | 0.0139 | 0.4730 indicates no significant effect at p>0.1 | 0.4730 indicates no significant effect at p>0.1 |
| Visit Duration | 1.983E-08 | 0.0075 | 0.9745 indicates no significant effect at p>0.1 | 0.9745 indicates no significant effect at p>0.1 |
Experimental designTabelle 2_ Versuchsdesign
| Tested Factors | Type of evaluation | Content of question | Questions | |
|---|---|---|---|---|
| Gr1 | Maximum choice | What is the healthiest food for you? | ||
| Gr2 | Minimum choice | What is the least healthy food for you? | ||
| Exp1. | Gr3 | Ranking | Healthiness | Rank the healthiness of products, please |
| Gr4 | Rating | Rate the healthiness of products from 1 (very unhealthy) to 10 (very healthy), please | ||
| Gr1 | Deliciousness | What is the most delicious food for you? | ||
| Exp2. | Gr2 | Maximum choice | Healthiness | What is the healthiest food for you? |
| Gr3 | Price | What is the cheapest food for you? | ||
| Gr4 | Familiarity | What is the most familiar food for you? | ||
Food images used in the studyTabelle 1_ Bilder der in der Studie verwendeten Speisen
| Stimulus | Set of food images |
|---|---|
| Experiment 1: Type of evaluation | Vegetables - Tubers - Legumes - Fruits |
| Experiment 2: Question content | Fast food - Home food - Restaurant food - Processed food |